How does consumer strength translate into stock prices?
Evelina M. Tainer, Chief Economist
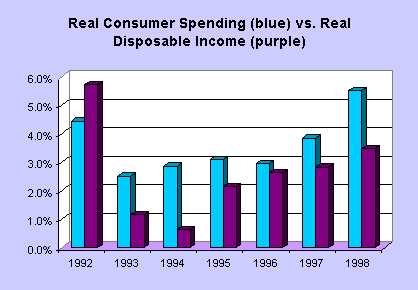
This article looks at the consumer sector in the U.S. economy. Personal consumption expenditures account for roughly two-thirds of gross domestic product, so understanding the consumer is clearly important. Most economists are predicting that consumer spending will moderate in 1999 as the economy slows down and income growth softens as well. Furthermore, even among the most bullish prognosticators, most don't expect the kind of rapid growth in stock prices that occurred in the past few years. This would suggest that consumer spending will have to realign with income patterns. Nonetheless, it is a good idea to look at where consumers are spending their money - and how this relates to stock prices in these industries.
Retail sales - overall strength stems from optimism
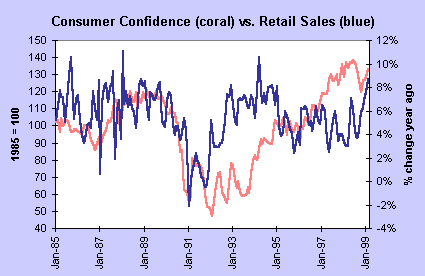
The chart below depicts the yearly change in retail sales compared with the level of consumer confidence. Analysts like to believe that any change in confidence will be matched by a change in retail spending. As indicated in the chart below, the broad trends do move in tandem, but it appears that consumers became more confident in the past couple of years, but didn't match their exuberance by accelerating their spending. To be fair, it is useful to note that the growth in retail sales in 1985 through 1990 was accompanied by somewhat higher inflation. Current activity in the retail sector is accompanied by virtual price stability.
Where are consumer dollars going?
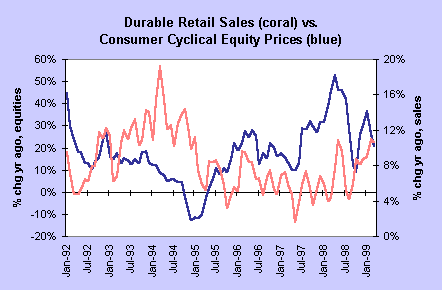
There is no question that consumer spending on durable goods is rising more rapidly than spending on nondurable goods. The chart below compares the year-over-year gain on durable retail sales to the yearly rise in equity prices of consumer cyclical goods (using the S&P consumer cyclical index). Note how equity prices of consumer cyclical stocks have fallen off in the past year even as retail spending has grown more rapidly. Durable goods include motor vehicles, furniture and building materials. These are cyclical because they rise more rapidly than the rest of the economy during expansions, and fall more precipitously during recessions. These are all affected by interest rates as well, since they are large ticket items.
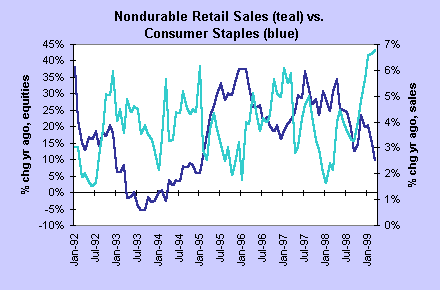
Showing a similar pattern, retail spending on nondurable goods, albeit more moderate than durable goods, has accelerated in recent months. Yet, the yearly rise in stock prices of consumer staples (measured by the S&P index) has moderated significantly. It is important to note the different scales for the two series since even though equity prices are moderating, they are still rising between 5 and 10 percent a year. Also, note that the yearly changes in prices and retail spending since 1992 were generally moving inversely to one another (rising sales generally led to falling stock prices and vice versa). Nondurable goods include food, apparel, department stores, gasoline and restaurants. One doesn't normally associate eating out as a consumer staple, but removing this category from nondurable retail sales didn't changes the overall pattern of growth during the 1990s. Consumer staples are typically items one needs in good and bad economic times. Consider Clorox.
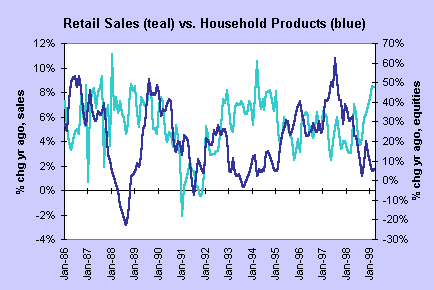
Household products are generally considered a consumer staple, although they can fall in either the durable or nondurable sector of the economy. (For instance, the S&P category includes Maytag the appliance manufacturer and Armstrong World Industries the tile maker in this category, as well as Seagram and Fruit of the Loom.) Due to the diversity of the group, we compared the yearly change in total retail sales to the yearly change in equity prices of household products. The relationship appears to be an inverse one, where stock prices rise when retail sales are falling and vice versa. We have experienced that pattern in recent months as well. (Again, note the difference in scale for the two series, where the stock prices fluctuate more dramatically than sales.)
How housing affects retail sales and equity prices of furniture and appliances
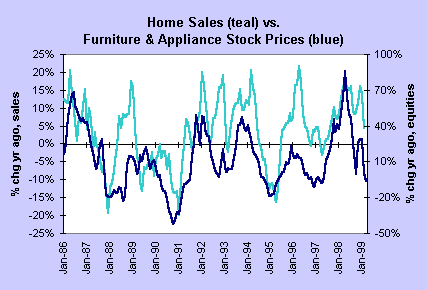
Not surprisingly, a strong relationship exists between home sales and furniture and appliances. The chart below reflects the year-over-year change in home sales (new and existing) with the yearly change in equity prices of furniture and appliances. (Note the different scales for the two series, where equity prices fluctuate more wildly.) While home sales have posted record levels nearly every month for the past year, the yearly growth in sales is already moderating. Similarly, the rise in stock prices in this sector has moderated even more dramatically. It is possible that stock prices in this sector have over-compensated for the moderation in home sales.
Factors that could stall the consumer in 1999
No doubt, American consumers are spending machines. Give us cash, we will find some way to spend it. Indeed, consumers don't need to have cash in hand. The chart below describes two aspects of the consumer's balance sheet - and the prospects of consumers to sustain last year's spending rate. The debt-to-income ratio has never been higher. Certainly more people are using credit cards for some premium such as cashback bonus or mileage points and fully pay their credit card debt in full each month. But this no longer explains the upward drift in the ratio in the past 20 years because consumers have been using credit cards in this fashion for awhile. Yet, debt burdens are higher than they were in previous expansions.
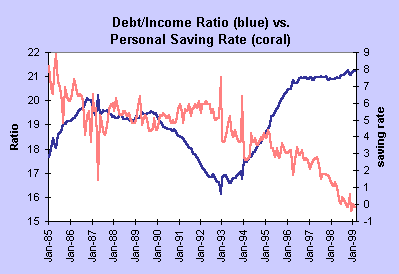
At the same time, the personal saving rate has dipped below the zero mark. The Commerce Department has redefined income - which now excludes capital gains from mutual funds - but still incorporates capital gains taxes. Therefore, the level of the saving rate is a bit misleading. Nonetheless, the downward trend in the saving rate since the early 1990s is quite dramatic and suggests that consumers might not have a big savings cushion to fall back on if economic conditions suddenly soured.
Consumers have financed some of their expenditures in the past couple of years with the extra money coming from equity in their homes. Refinancing activity surged in the past couple of years and is still going gangbusters. The increased wealth from the appreciation of their homes may have led many consumers to tap into this equity and use it for goods and services and perhaps even alternative investments. As mortgage rates stop decreasing, it is likely that refinancing activity will eventually wane. Indeed, the rate of refinancing has dropped in the past two months, although levels of refinancing remain robust by historical standards. But during the course of the year, the additional new money to spend on goods and services will trickle off. Consumers will only be able to spend as much as they earn.
The Bottom Line for Investors
The rapid acceleration of consumer spending has helped to spur stock prices in many consumer-oriented companies. There is no doubt that companies will continue to profit from consumer expenditures in the coming year.
It is useful for investors to follow retail spending in a more detailed fashion as shifts in spending over time will likely lead to shifts in those companies and industries gaining the highest profits. For instance, you might want to follow the department store, apparel and building materials portion of retail sales if you invest in discount and fashion retailing stocks since the Gap, Home Depot and Nordstrom's all fall in this category. Similarly, you would have to follow both durable and nondurable retail sales in order to assess the outlook of various consumer product companies that include Coca-Cola, Circuit City, Avon Products and Maytag. Certainly, you would follow auto sales to get a bead on Ford or GM, but also Goodyear Tire & Rubber.
Overall economic conditions do help to assess the direction of stock prices. Yet, after the early phase of economic recovery, shifts in industry conditions suggests that sectors fall in and out of favor with investors. As a result, long-term investors as well as short-term speculators need to stay abreast of the various economic sectors where the profit potential is greatest.