Monday, August 2, 2004

Crude oil prices ramp up yet again
Oil prices soared over $43 a barrel for the first time in 21 years over concerns about the loss of production from Russian oil company OAO Yukos. A deadly bombing in Iraq and tepid data on U.S. energy reserves added to the concerns. Russia has surpassed Saudi Arabia as the world's largest oil producer and exporter. And Yukos produces about 1.7 million barrels a day - as much oil as Iraq pumped last month. The Russian government is trying to collect billions of dollars in back taxes from Yukos, a move the financially troubled company says could force it into bankruptcy. The prospect of losing nearly two million barrels a day comes at a critical time for the oil market amid risk that demand may outstrip supply. Crude futures for West Texas Cushing ended the week at $43.80 a barrel. In an effort to rein in surging prices, OPEC agreed back on June 3rd to increase its output ceiling by 2.5 million barrels a day - two million barrels beginning July 1st and an additional 500,000 barrels effective August 1st. As oil prices climb, more expensive alternative fuels will look more attractive to producers.

Global Markets
Last week's closes belie recent activity on the equity markets. Investors have been caught between record high earnings on one hand and uncertainties over U.S. elections, slower U.S. economic growth, terrorism and soaring oil prices on the other. And investors have tended to focus on negative news for the most part. While last week ended on the plus side for all indexes followed here except the Kospi and Hang Seng, the results for the month of July differed significantly. In July, only the All Ordinaries and the Singapore Straits Times bettered their end of June levels. The first table below shows last week's results while the second table shows the percent change for each month in 2004. Clearly July was awful.
Global Stock Market Recap


Europe and Britain
Despite the rebounds by the FTSE, CAC and DAX last week, the gains were too little, too late to save the month of July. Investors here continue to keep an eye on U.S. events, so it was no surprise that the indexes fluctuated between gains and losses amid mixed U.S. reports. The United States is Europe's largest export market so favorable growth signs are relied upon to measure Europe's prospects. Investor disappointment was obvious when previous gains were pared on Friday after U.S. second quarter advance GDP grew at an annualized rate of only 3 percent.

Oil prices played a role as well. European raw materials stocks rose on expectations of sustained demand for metals, but companies that use oil as an input to the manufacturing process such as tire makers dropped as the price of crude rose to 21 year record highs.
Asia/Pacific
It was an awful July for Japanese stocks. The Nikkei sank 4.5 percent - its largest monthly drop since March 2003. The Topix, which fell to its lowest level since May 20th, sank 4.3 percent on the month. Only the Nasdaq and Kospi lost more - 7.8 percent and 6.4 percent respectively. Shares in Tokyo ended higher on the week helped by news of a rare takeover battle involving Japan's biggest banks. UFJ Holdings Inc., which has more bad loans than any other lender in Japan, jumped 10 percent, its biggest gain in two weeks. Sumitomo Mitsui Financial Group Inc. said it will offer to merge with UFJ, setting the stage for a bidding contest with Mitsubishi Tokyo Financial Group Inc. Both the Nikkei and Topix were also boosted by computer and electronics related stocks.

Currencies
The dollar gained against most currencies again last week. But the yen was the week's big loser as Japan's economic data disappointed analysts. A deep-seated belief that Japan's export-led recovery has spread to the domestic economy and is on the verge of ending 15 years of economic malaise has been the markets' focus. But declines in industrial production, retail sales and worker household spending have tarnished this premise.

The dollar rose modestly against the euro and the pound sterling. Analysts said the dollar's climb was the work of speculators liquidating short positions built up during the recent streak of soft U.S. data, with few willing to go long prior to next week's employment situation report. Preliminary second quarter GDP data shows that the British economy grew at a faster pace than the U.S. - 0.9 percent vs. 0.75 percent on the quarter respectively. However, when compared with the second quarter of 2003, the U.S. economy grew 4.8 percent vs. 3.7 percent for Britain. The current spread between interest rates in the two countries is 3.25 percent, with that spread likely to widen by at least 25 basis points on Thursday when the Bank of England is expected to raise interest rates to at least 4.75 percent.

Indicator scoreboard
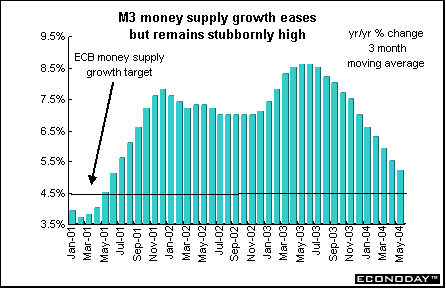
EMU - M3 money supply for the three months until June was up 5.2 percent when compared with the same three months in 2003. June M3 money supply was up 5.4 percent from June 2003. The ECB, with a growth rate target of 4.5 percent, uses the three-month number for its measure of M3 growth.
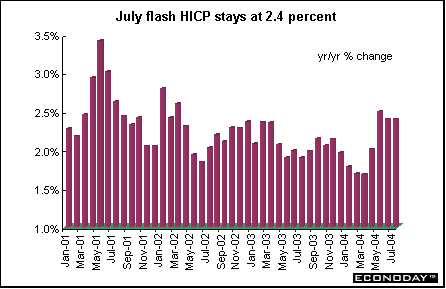
July flash harmonized index of consumer prices was up 2.4 percent when compared with last year. Eurostat said the data were adjusted to take into account an earlier start of German summer sales.
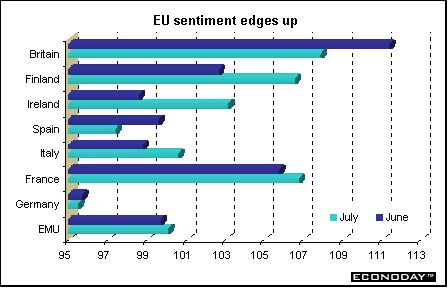
EU - July EU Commission economic sentiment index climbed to 100.1 from 99.7 in the previous month. The overall index sank in Spain, the Netherlands and Germany but was up both in France and Italy. Consumer confidence remained at minus 14 for the second month. Industrial confidence also remained unchanged from June at minus 4. Services confidence edged up to 11 from 10 in June. Retail sentiment inched up to minus 9 from minus 10 in June while construction sentiment edged down to minus 17 from minus 16 in the prior month.
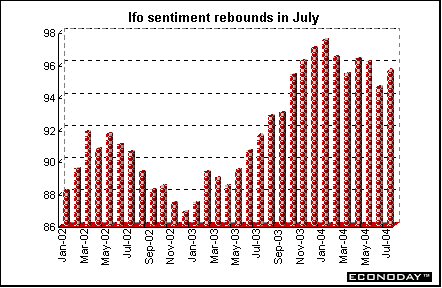
Germany - July Ifo Institute business sentiment index climbed to 95.6 from 94.6 in June. Both current conditions and business expectations improved. Future expectations increased to 97.1 from 96.0 in June, up for the first time since January. Current conditions increased to 94.1 from 93.2 in June, up for the first time since April.
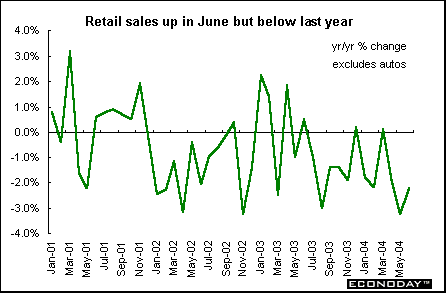
June total retail sales including autos and gasoline stations were up 0.4 percent but were down 5.1 percent when compared with last year. Excluding autos and gasoline stations, retail sales were up 1.7 percent but were down 3.9 percent on the year.
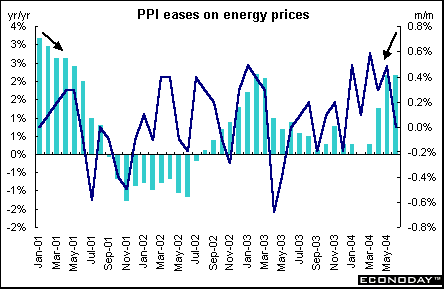
France - June producer price index was unchanged but up 2.2 percent when compared with last year. Energy prices were down 1.0 percent after soaring 2.5 percent in May but were still 6.2 percent above last June's level. Excluding energy and agriculture, core PPI was up 0.2 percent and 0.8 percent on the year.
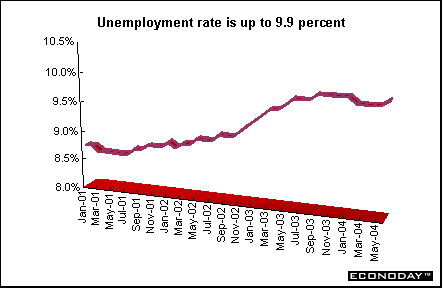
June seasonally adjusted International Labour Organization unemployment rate inched up to 9.9 percent from the 9.8 percent level of the previous four months. The number of unemployed was up by 7,000 according to the ILO definition which excludes jobseekers who did any work during the month. The recent jobless trends are probably less a reflection of the economic cycle than of the impact of political factors on official statistics.
Italy - June producer price index was up 0.2 percent and 3.2 percent when compared with last year. Excluding energy the PPI was up 0.3 percent and 3 percent on the year. The overall PPI increase was held down by lower refined petroleum product prices. The steepest price increases were for mining products, rubber products and metal products.
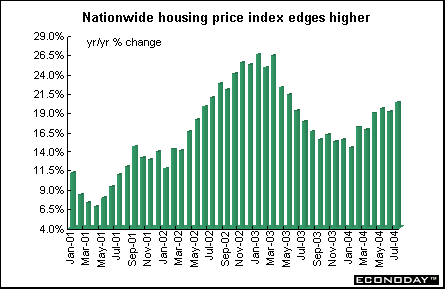
Britain - July seasonally adjusted Nationwide house price index jumped 2.1 percent and 20.3 percent when compared with last year. This is above June's increases of 0.9 percent and 19.1 percent on the year and shows that rising interest rates have had little impact on house prices.
Asia
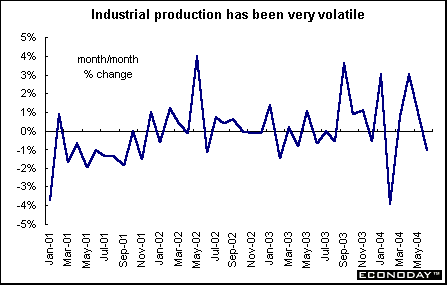
Japan - June seasonally adjusted industrial production sank 1.3 percent but was 7.6 percent higher than June 2003. Transport equipment, electrical machinery, and plastic products led the declines. However, industrial production is expected to rebound for the next two months according to the MITI forecast included in the report.
June spending by households headed by wage earners sank 3.8 percent and was down 1.3 percent on the year. Wage earner household spending is an important gauge of personal consumption, which accounts for roughly 55 percent of the nation's gross domestic product. The propensity for wage earner households to consume, a ratio that measures the amount of disposable income that went to household spending, rose to 76.6 percent from 72.8 percent in the previous month.
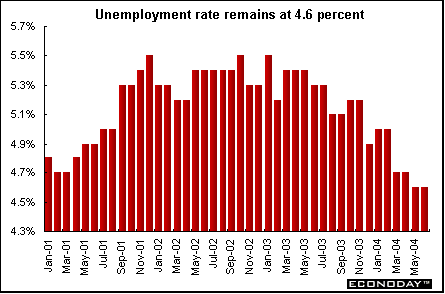
June unemployment rate remained at 4.6 percent for the second month. This is the lowest level since August 2000. Employment declined by 380,000 jobs, the largest monthly loss since July 1974.
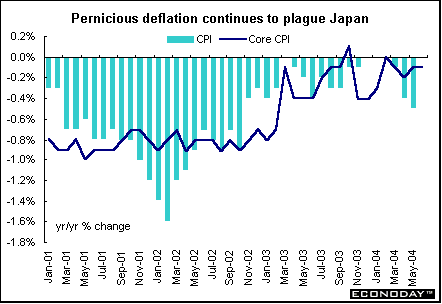
July Tokyo consumer price index was down 0.5 percent and dropped 0.2 percent when compared with last year. The Tokyo core CPI which excludes fresh food was down 0.1 percent both on the month and on the year. The CPI when compared with last year has declined since October 1999. June nationwide CPI was up 0.2 percent and was unchanged on the year. The core CPI was up 0.1 percent but down 0.1 percent on the year.
Australia - Second quarter consumer price index was up 0.5 percent and 2.5 percent when compared with the same quarter a year ago. This leaves inflation within the Reserve Bank of Australia's target range of 1 to 3 percent. Excluding volatile items, the CPI was up 0.4 percent and 1.2 percent on the year. Prices for fuel, housing, construction and health care all increased, while the prices of vegetables and consumer electronics declined.
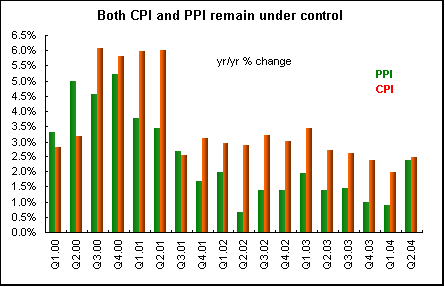
Second quarter producer price index was up 1.1 percent and 2.4 percent when compared with last year. Domestic PPI index was up 0.8 percent and 4.4 percent on the year, mainly due to increases in prices of building construction and petroleum refining that were partially offset by price drops in other agricultural products and motor vehicles and parts. The final imports index jumped 2.3 percent but was down 7.6 percent on the year due to exchange rate driven price increases for both consumer and capital goods, including industrial machinery and equipment, refined petroleum products and a range of manufactured goods.
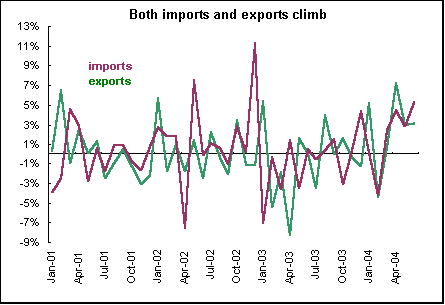
June seasonally adjusted merchandise trade deficit climbed to A$2.22 billion from A$1.85 billion in May. Exports were up 3.2 percent while imports jumped 5.3 percent. Exports growth was fueled by a robust performance from the rural sector and is being driven by strong demand from Asia, reflecting continued strong economic growth in China and the recent improvement in the Japanese economy.
Americas
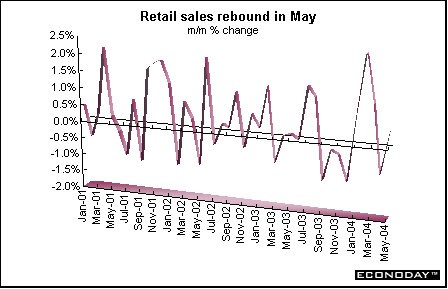
Canada - May retail sales were up 0.5 percent and 4.6 percent when compared with last year. Retail sales in constant dollars were down 0.2 percent. The most significant price increases were at gasoline stations, where the average price of gasoline jumped 13.6 percent, the largest monthly gain in 21 years. Higher prices were also observed in supermarkets but to a much lesser extent. Excluding sales by dealers of new, used and recreational vehicles and auto parts, retail sales were up 1.4 percent. In constant dollars, this gain translates to an increase of 0.5 percent. Five of the eight retail sectors were up in May.
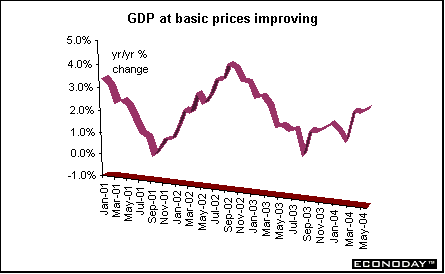
May monthly gross domestic product was up 0.3 percent and 3.1 percent when compared with last year. Goods producing industries were up 0.6 percent while services producing industries edged up 0.1 percent. Production increased for the production, exploration & pipeline transportation of crude oil and natural gas products. There was also higher public sector activity, a continuation of the housing boom and higher hotel occupancy rates. On the downside, the wholesale and retail sectors were restrained by fewer new motor vehicle sales.
June industrial product price index (IPPI) was down 0.5 percent after jumping 1.6 percent in May. The IPPI was up 6.4 percent when compared with last year. Lower prices for motor vehicles and other transport equipment contributed to half of the monthly decrease. This was mainly the result of the effect of the exchange rate. Lumber and other wood products prices were down as increased supply resulted in lower prices for softwood lumber and particleboard. Prices for petroleum and coal products as well as gasoline and fuel oil prices also were down. Petroleum and coal products group continued to have a strong influence on the change on the year with an increase of 25.9 percent. If petroleum and coal product prices had been excluded, the IPPI would have increased 5.1 percent on a 12-month basis.
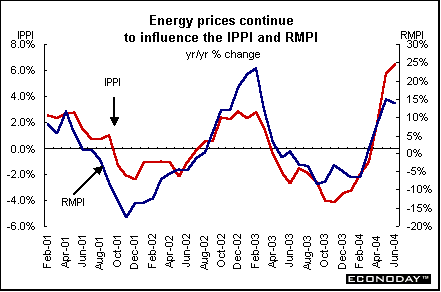
June raw material price index (RMPI) was down 1.7 percent after increasing 2.8 percent in May. Mineral fuels were mostly responsible for the decline. Crude oil prices declined 3.9 percent because of increased production. Prices for animals and animal products were down mainly as the result of lower prices for cattle for slaughter and fresh fish. Manufacturers paid 13.8 percent more for their raw materials compared with one year ago. Mineral fuels were up 15.3 percent from a year ago with crude oil prices rising 20.1 percent. If mineral fuels had been excluded, the RMPI would have increased 12.6 percent.
Between May and June, the value of the U.S. dollar weakened against the Canadian dollar with a decrease of 1.5 percent. As a result, the total IPPI excluding the effect of the exchange rate would have remained unchanged, compared with the actual decrease of 0.5 percent. On a 12-month basis, the change in IPPI excluding the effect of the exchange rate was 6.0 percent from June 2003 to June 2004, compared with the 6.4 percent actual increase.
Bottom line
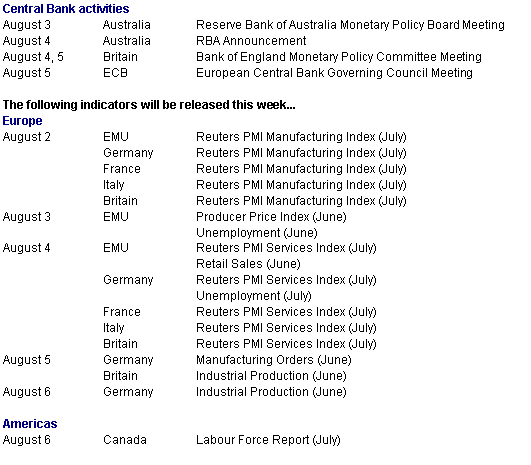
It's that time again! The next two weeks will be filled with central bank meetings and announcements and plenty of fodder for bank watchers. During August's first week, the Reserve Bank of Australia, Bank of England and European Central Bank will hold meetings. The second week will be dominated by the FOMC meeting, but the Bank of Japan is also scheduled.
During the first week, only the Bank of England is expected to raise their policy making rate, but analysts are divided over whether it will be 25 or 50 basis points. The Reserve Bank of Australia is expected to leave their interest rate at its current 5.25 percent, primarily because second quarter CPI remained solidly within the Bank's 1 to 3 percent inflation target range. With signs of growth beginning to stir in the EMU, the ECB is anticipated to leave rates unchanged at 2 percent.
Looking Ahead: August 2 through August 6, 2004
