Monday, September 20, 2004

Global Markets
Equity markets were more sanguine about capricious crude oil prices last week despite hurricanes and a shortfall in U.S. crude oil inventories. All indexes followed here were up on the week with exception of the Dow industrials and those in Japan. Although OPEC, in a public relations maneuver at last week's meeting, agreed to raise official oil output quotas by 1 million barrels per day to 27 million, the members are already pumping almost 28 million barrels and using almost their entire capacity. The exceedingly active hurricane season has raised concern that shutdowns, including those caused by Hurricane Ivan, will further reduce U.S. inventories that have already plunged 8.7 percent since the beginning of July. Oil prices climbed as Ivan prompted Gulf of Mexico producers such as Royal Dutch/Shell to shut platforms in the biggest disruption of the region's output in at least two years. States along the Gulf are home to a major portion of the U.S.'s refining capacity.
Global Stock Market Recap

Europe and Britain
The FTSE, CAC and DAX all were up on the week. Climbing crude prices had a muted impact on investors in contrast to earlier drops on price increases. The FTSE ended the week at its highest level since July 8, 2002. It has been up in four of the last five weeks. Mining stocks such as BHP Billiton Plc, which is projected to benefit from increased iron ore demand, contributed to the gains. Stocks on the continent were also propelled by mining companies on hopes the industry might be able to raise prices next year. Oil stocks also were up as oil prices climbed four of five days. An industry executive opined that the era of cheap oil might be over as Middle East tensions along with growing consumption boosts prices and spurs the need for new refineries, pipelines and oil and gas rigs.

Asia/Pacific
While indexes in Singapore, South Korea, Hong Kong and Australia continued to climb, traders in Japan are trying to determine if the nation's slowdown is systemic or an isolated soft patch. Early in the week, stocks in Japan and elsewhere were helped by falling energy prices, which in turn helped boost airline stocks. But airline and other shares dropped back after energy prices climbed when Ivan disrupted oil production in the Gulf of Mexico. Jet fuel accounts for about a fifth of some airlines' costs. The Platts jet kerosene spot price in Singapore, a regional industry benchmark, has climbed 43 percent this year.
Technology stocks, after boosting the indexes on Monday, suffered from profit taking the remainder of the week. This negated the gains and pushed the Nikkei and Topix lower. Initially, tech stocks (especially those of chip makers) were up as investors became more optimistic about their future. But stocks fell after oil prices increased for a third day, eroding the spurt of optimism amid fears that higher energy costs will slow global economic growth. This has been a recurrent theme in all equity markets followed here. Exporters such as Toyota Motor and Fuji Photo Film paced declines.

Currencies
The yen fell against the dollar three of five days on speculation Japan would resume currency sales should the economy's recovery slow. The economy expanded only 0.3 percent on the quarter in the second quarter after expanding 1.6 percent in the first. Trader worries about intervention have resurfaced as the end of the fiscal half-year approaches. In the first quarter, record amounts of yen were sold to prevent a stronger yen from jeopardizing the recovery. A higher yen reduces repatriated earnings and increases prices for Japan's exports. With domestic demand anemic, the economy relies on exports for growth. Exports account for about 12 percent of Japan's economy.

Indicator scoreboard
EMU - August seasonally adjusted harmonized index of consumer prices was up 0.3 percent and 2.4 percent when compared with last year. Price increases for transport, hotels & restaurants and clothing, housing & recreation more than offset lower prices for food, communications and health. HICP excluding food, alcohol and tobacco was up 0.2 percent and 1.9 percent on the year. Core HICP excluding energy and unprocessed food - the measure preferred by the ECB - was unchanged on the month but was up 2.1 percent on the year.

July industrial output was up 0.4 percent and 2.4 percent when compared with last year. Most categories were up on the month with the exception of energy and nondurable consumer goods. Capital goods were up 0.8 percent while consumer durable goods were up 1.7 percent on the month. Output declined in the Netherlands, Portugal, Spain and Belgium. It was up in Ireland, Finland and Germany.

Germany - September ZEW economic expectations index sank to 38.4 from 45.3 in August. The decline was due to worries about a slowdown in world growth and its impact on the nation's exports as well as continued weakness in domestic demand. The Center for European Economic Research (ZEW) in Mannheim surveyed 298 German financial experts from August 30th to September 13th for their opinions on current economic conditions and the economic outlook for major industrial economies.

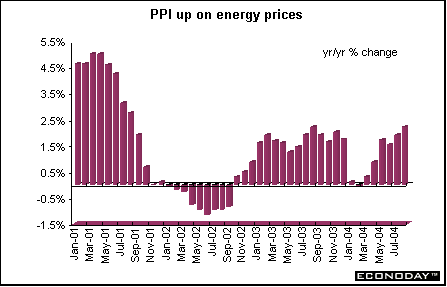
August seasonally adjusted producer price index was up 0.4 percent and 2.2 percent when compared with last year primarily due to high mineral oil and steel costs. Unadjusted mineral oil prices were up 3.6 percent and 12.2 percent on the year while rolled steel prices were up 1.5 percent and 29.1 percent on the year. Excluding volatile oil prices, producer prices were up 0.2 percent and 2 percent on the year.
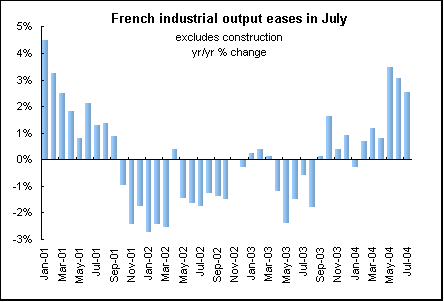
France - July seasonally adjusted industrial output excluding construction was up 0.2 percent and 2.5 percent when compared with last year. Manufacturing output was up 0.3 percent and 3.5 percent on the year. Consumer goods output declined 1 percent while energy dropped 1.2 percent.
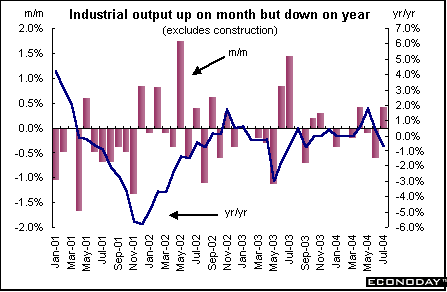
Italy - July seasonally adjusted industrial output excluding construction was up 0.4 percent but down 0.7 percent when compared with last year. Consumer goods output was up 1.5 percent but investment goods output was down 0.3 percent. Twelve out of 18 product categories were up with the strongest gains occurring in other manufacturing industries, transport and electric, gas & water.
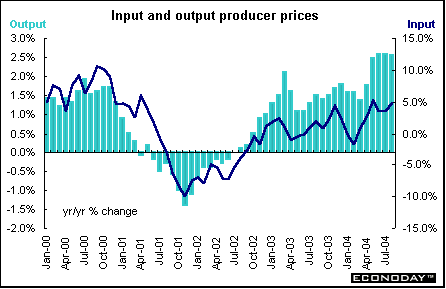
Britain - August producer output prices were up 0.2 percent and 2.6 percent when compared with last year. Producer input prices were up 2.4 percent and 4.8 percent on the year. Both input and output prices were boosted by petroleum product prices. Output prices for petroleum products were up 1.6 percent and 8.8 percent on the year. Input prices for crude oil skyrocketed 17.8 percent and 29.9 percent on the year.
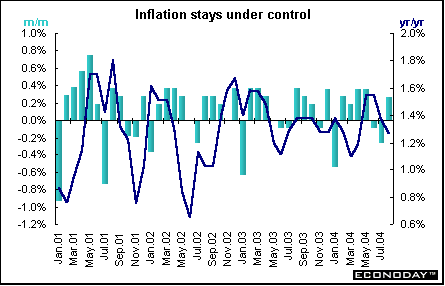
August consumer price index was up 0.3 percent and 1.3 percent when compared with last year. Clothing and footwear prices were the main downward influence on prices along with the rest and recreation sector. The CPI is used as the Bank of England's inflation target gauge. The current target is 2 percent. The retail price index excluding mortgage interest payments was up 0.3 percent and 2.2 percent on the year.
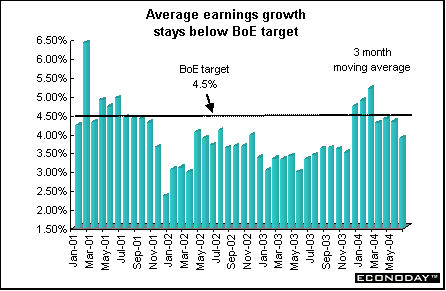
Average earnings for the three month to July were up 3.8 percent when compared with the same three months a year ago. July average earnings excluding bonuses were up 4.2 percent on the year, the same as in June.
August claimant count unemployment was down by 6,100. This was the 15th consecutive monthly drop. The claimant unemployment rate remained at 2.7 percent for the third month. The International Labour Organization unemployment rate for the three months to July edged down to 4.7 percent from 4.8 percent. In the U.S., the jobless rate stands at 5.6 percent, in Japan it is 4.9 percent and in Germany it is 9.9 percent.

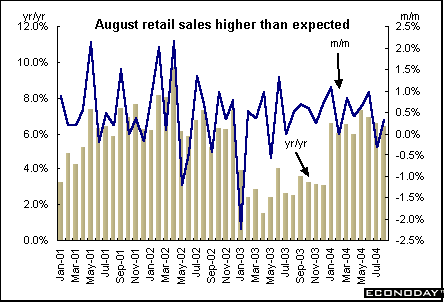
August retail sales were up 0.6 percent and 6.5 percent when compared with last year. Clothing and shoe store sales rose 3.7 percent, the most since June 2003. Non-specialized store sales, which include department stores, were up 3.3 percent, the most since July 2002. The gains helped offset declines from garden centers and shops that rely on summer fashions. The retail sales deflator used by the statistics office to measure the change in retail prices fell 1.4 percent in August. Retail sales measured by volume were up 0.3 percent and 6.4 percent on the year. Retail sales in the three months through August, a preferred measure of government statisticians, rose 1.4 percent, the lowest since September 2003.
Americas
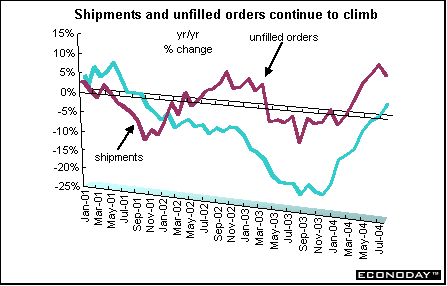
Canada - July manufacturers' shipments were up 0.5 percent and 9.8 percent when compared with last year. Although the monthly increase was the slowest since January, shipments were driven by higher prices in key industries such as petroleum, chemicals, wood and primary metals. Twelve out of 21 industries reported increases, accounting for 80.7 percent of total shipments. Shipments of nondurable goods were up 1.2 percent, with chemical products up 2.6 percent and petroleum products up 1.7 percent. Shipments of durable goods were down 0.1 percent. New orders were up 1.4 percent following a 1.9 percent jump in June. The increase in new orders was primarily among durable goods industries, led by aerospace, where it soared 50 percent. New orders for machinery and fabricated metals were up 3.3 percent. The backlog of unfilled orders was up 1.7 percent. The increase was led by the machinery, fabricated metals and aerospace industries, and partly offset by a decline in the computer and electronic products and motor vehicle parts industries.
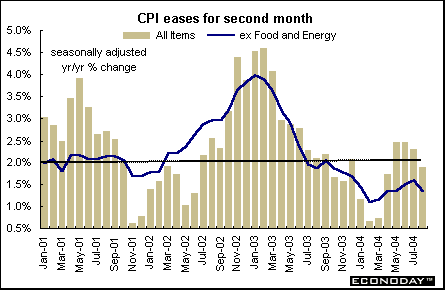
August consumer price index was down 0.2 percent but climbed 1.9 percent when compared with last year. Core CPI, which excludes food and energy, also dropped 0.2 percent but was up 1.2 percent on the year. The monthly decline was due to lower auto prices thanks to increased manufacturers' incentive programs. On the year, the primary upward pressure was exerted by gasoline prices, which were up 7.8 percent, along with homeowners' replacement costs, up 6.9 percent. Cigarette prices jumped 7.7 percent on the year due primarily to higher taxes. On a seasonally adjusted basis, the CPI was down 0.2 percent but up 1.9 percent on the year.
Bottom line
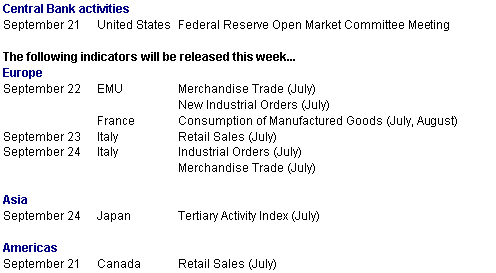
After a rather quiet week with only the weather to watch, investors everywhere will be focused on Tuesday's Federal Reserve Open Market Committee meeting. While no one doubts the outcome - another 25 basis point increase in the Fed funds rate to 1.75 percent - all will focus on the statement's arcane language that will accompany the move. Investors will be looking for clues whether the Fed will continue its slow deliberate pace of interest rate increases.
Looking Ahead: September 20 through September 24, 2004
