Monday, April 4, 2005

Oil prices and weak data pressure equities
Markets fluctuated last week on a combination of events including end-of-quarter squaring and a shortened trading week for most. But crude prices continued to play their role in roiling investors. On Thursday, equities sank after a major U.S. investment bank (Goldman Sachs) suggested in a research note that oil prices were at risk of a "super-spike" above $100 a barrel. They rationalized their view by saying that the oil market looked a lot like it did in the 1970s, when supply disruptions led to a "super-spike" in prices to $90 a barrel (in today's dollars). Crude prices, which had settled below $55 dollars a barrel, immediately climbed over $56 for west Texas intermediate crude, and ended the week over $57 a barrel. Worries about gasoline supplies ahead of the summer driving season added further upward pressure on crude and gasoline prices. It was also a heavy week for major market-moving indicators especially in the U.S. and Japan. The key data from the U.S. - the employment report - disappointed as did the quarterly Tankan from Japan. On the week, nine indexes were down while the Kospi, DAX, CAC and Toronto S&P/TSX Composite were up. (First quarter results will be covered in Tuesday's Short Take article.)
Global Stock Market Recap

Europe and Britain
Markets here were lackluster as British and European investors returned from their long holiday weekend. Equities showed little movement despite discouraging unemployment data from both France and Germany. On Friday, European equities ignored weakening EMU purchasing managers' surveys and managed to recoup some of the losses from earlier in the week. Although the FTSE was up on Friday, it was not sufficient to offset its earlier losses.

The euro oozed downward during the week as the press of disappointing economic data deflated the currency. Dollar strength was attributed to a combination of better growth prospects combined with an increasing spread between U.S. and EMU interest rates. But the dollar reversed direction Thursday after weekly U.S. unemployment claims increased, adding to jitters over pending U.S. employment data. On Friday, the weaker-than-expected U.S. employment report produced a knee-jerk reaction in the currency markets. The dollar sank against the euro, only to rise again. But then the U.S. purchasing management index for the manufacturing sector was released and the dollar really took off as the report showed U.S. manufacturing expanded in March and prices increased at a faster pace than in the previous month. The dollar is up about 5 percent from a record low of $1.3666 per euro on December 30th with spreads between U.S. 10-year Treasury notes and German bunds at their widest point since 2000. Some analysts think that investors have shifted their attention to inflation and potential Fed rate increases, and are putting less emphasis on the employment report.

Asia/Pacific
What a difference a year makes! Thursday marked the end of the Japanese fiscal year 2004. And the quiet end illustrates that investors are no longer worried about financial sector stability. In prior years, the economy was under a black cloud, burdened by a dreary and seemingly unending slump while banks were saddled with overwhelming amounts of bad debt. Often policy makers were forced to take steps to ensure an orderly end to the fiscal year by flooding the market with funds while intervening in the currency markets to force the yen's value down to help repatriated profits. Fiscal 2004 was different. It ended calmly with the Bank of Japan leaving more extra cash in the market than it usually does. The reasons were to allay financial institutions' concerns over fiscal year-end financing and to prepare for the lifting of the government's blanket guarantee of bank deposits on Friday (April 1st).
Both the Nikkei and Topix spent most of the fiscal year under their March 2004 close, but they ended the year basically unchanged - the Nikkei was down 0.4 percent while the Topix managed to gain 0.25 percent. The indexes were depressed by the ever-rising price of crude oil combined with softening exports thanks to the stronger yen. Negative growth in the second and third quarters and a mere 0.1 percent growth rate in the fourth on the quarter also depressed investors.

Unlike last year, the Bank of Japan did not intervene in the currency market to drive the value of the yen downward as it had, at the behest of the Finance Ministry, in the previous fiscal year. The yen ended the fiscal year at around �107.2, down about 3 percent. Analysts think that the yen would have to climb to the �100 level before intervention would be considered again. But few traders expect the dollar to head south again to approach �100.

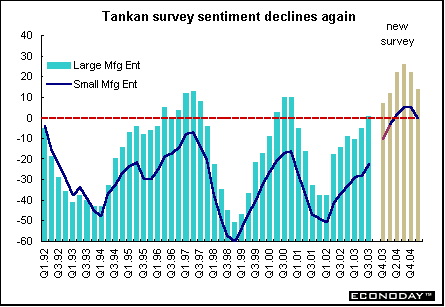
Widening interest-rate differentials in favor of the dollar have led to an initial exodus out of Japanese financial instruments, which in turn is causing yen weakness. And as interest rates continue to climb in the U.S., more pressure is expected on the yen. Analysts say that yen selling has accelerated since mid-February. The yen has also weakened because of recent economic data, which show that the unemployment rate increased from 4.5 percent to 4.7 percent in February as the economy lost 280,000 jobs. This has been further exacerbated by weak wage-earner spending along with soft exports. The softness led to a weaker-than-expected Tankan survey for the first quarter, which was released on April 1st. (See indicator scoreboard below)
Indicator scoreboard
EMU - February seasonally adjusted M3 money supply was up 0.2 percent and 6.4 percent when compared with last year. For the three months ending in February, M3 was up 6.5 percent when compared with the same three months last year.

March flash harmonized index of consumer prices was up 2.1 percent when compared with last year. This is slightly above the ECB's inflation target of 2 percent. Eurostat does not provide index details with flash reports.

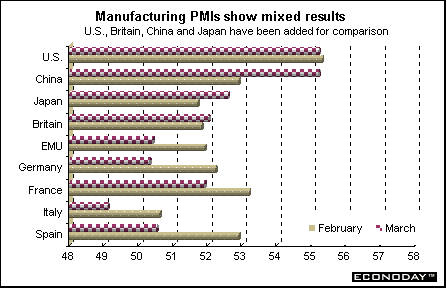
March manufacturing purchasing managers' index declined to 50.4 from 51.9 in February. The PMI has recorded a level above the 50.0 no-change mark, which signals improved business conditions, for 19 successive months. A slowdown in output and new order growth dragged the PMI down to a four-month low. The output index signaled the slowest pace of growth for four months. Rates of growth fell markedly in France, Germany and Spain, hitting 17-, four- and nine-month lows respectively. Italy recorded the weakest expansion, with growth dipping to a three-month low, followed by the Netherlands. New orders index fell in March.
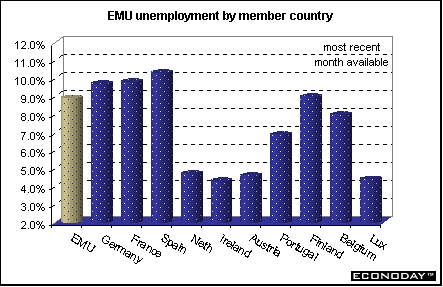
February seasonally adjusted unemployment rate increased to 8.9 percent from 8.8 percent in the prior month. Of the nine countries reporting, unemployment was up in four and unchanged in five. Spain continued to have the highest unemployment rate followed by France and Germany. Ireland registered the lowest unemployment rate followed by Luxembourg and Austria. Eurostat estimated that 12.8 million men and women were unemployed in the eurozone.
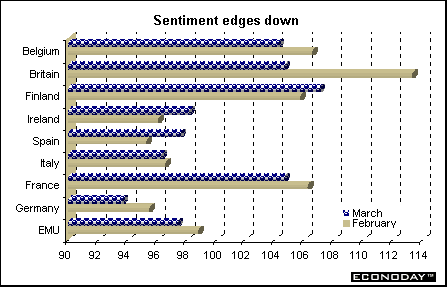
EU - March EU economic sentiment index dropped to 97.4 from 98.8 in the previous month. Industrial sentiment slumped to minus 8 from minus 6 in February while consumer sentiment edged down to minus 14 from minus 13. Industrial sentiment reflected weak output and order books. Sentiment dropped in Germany, France and to a lesser extent in Italy. Service sector and retail sector sentiments were also down.
Germany - January industrial production excluding construction was revised to a gain of 2.8 percent, down from the originally reported increase of 3.2 percent. On the year, industrial production was revised up to an increase of 3.9 percent from the originally reported 3.8 percent. Manufacturing output was revised down to an increase of 3.6 percent from 3.8 percent.

March unemployment rate soared to 12 percent from 11.7 percent in the previous month. In the west the unemployment rate jumped to 10 percent from 9.7 percent while in the east it soared to 19.5 percent from 19.3 percent in the prior month. It was the 14th straight monthly increase. The unadjusted number of jobless, which rose above 5 million for the first time since World War II in January, fell 41,000 to 5.18 million in March, while the seasonally adjusted number of those in work rose 10,000 in February, the sixth straight monthly increase. Employment figures lag behind those for unemployment by one month. According to the ILO method, all persons count as unemployed who were without a job at the time of the survey, who are actively looking for a job and would be able to start a new job immediately.

France - February producer price index was up 0.3 percent and 3.1 percent when compared with the same month a year ago. Core PPI, which excludes food and energy was up 0.2 percent and 2.6 percent on the year. Energy prices jumped 0.9 percent and 10.1 percent on the year. Semi-finished goods were up 0.4 percent and 4.5 percent on the year.

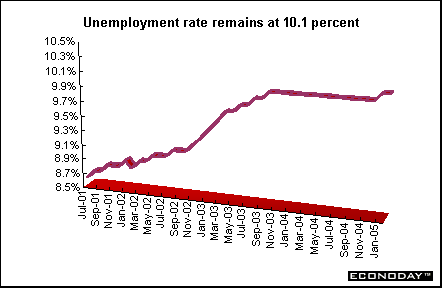
February unemployment rate remained at 10.1 percent but the number of unemployed increased by 4,000. Unemployment is measured according to the International Labour Organization definition which excludes jobseekers who did any work during the month.
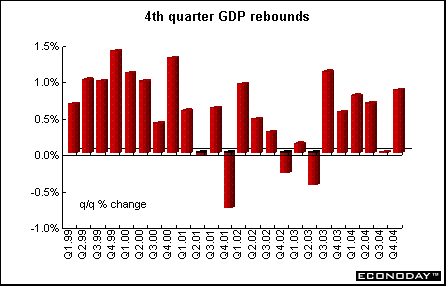
Final estimate of seasonally and calendar adjusted fourth quarter gross domestic product was revised upward to 0.9 percent from 0.8 percent. On the year, GDP was up a revised 2.4 percent from the originally reported 2.3 percent. Imports were revised downward but capital investment was revised upward.
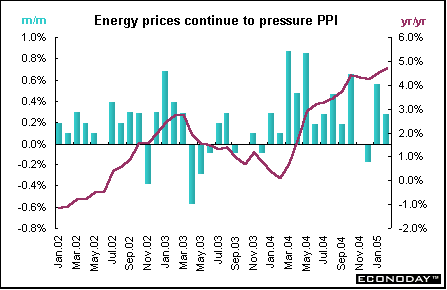
Italy - February producer price index was up 0.3 percent and 4.7 percent when compared with last year. Energy prices jumped 1.1 percent and were up 11.9 percent on the year. Excluding energy, the PPI was up 0.1 percent and 3.4 percent on the year. Three of 18 product categories experienced falling prices. Refined gasoline prices were up 2 percent while means of transport prices were up 0.8 percent and plastics were up 0.5 percent.
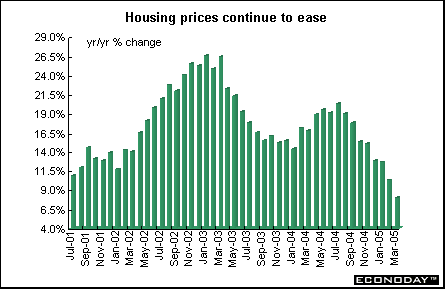
Britain - March Nationwide house price index dropped 0.6 percent but was up 7.9 percent when compared with last year. The monthly drop was the largest since June 1995.
Asia
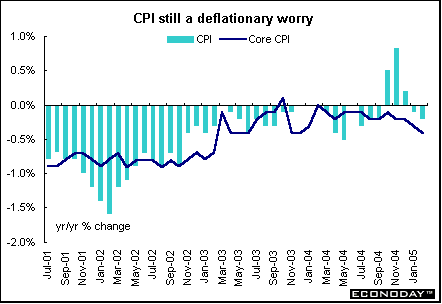
Japan - March Tokyo consumer price index was up 0.4 percent but down 0.3 percent when compared with last year. Core CPI was also up 0.4 percent but sank 0.5 percent on the year. The Tokyo index is considered a precursor to the national index which lags by one month. The national CPI was down 0.2 percent on the month and down 0.3 percent on the year. Falling utility and telecom charges pushed prices down by their fastest rate in almost two years, underlining the stubbornness of Japanese deflation. Core CPI was down 0.1 percent and declined 0.4 percent on the year. Nationwide, the CPI has been sinking for seven years. Measured by the gross domestic product deflator, Japan has been mired in deflation since 1995.
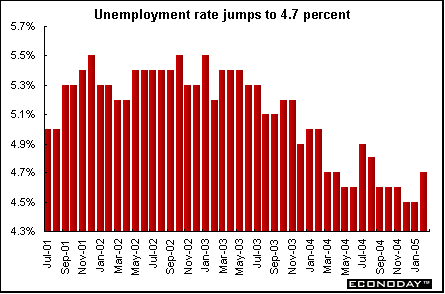
February unemployment rate rose to 4.7 percent from 4.5 percent in January. The economy lost 280,000 jobs and the workforce fell by 190,000. In January, 470,000 jobs were added, the most since 1992. Over the two-month period, the economy added 190,000 jobs.
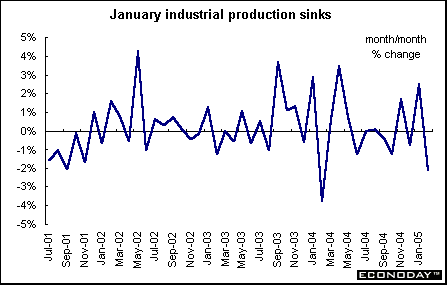
February seasonally adjusted industrial production sank 2.1 percent but was up 3.2 percent when compared with last year. The monthly decline virtually reverses January's 2.5 percent increase. Production of machinery and other capital goods fell 3.1 percent, the biggest drop since September. Shipments of capital goods plummeted 11.4 percent.
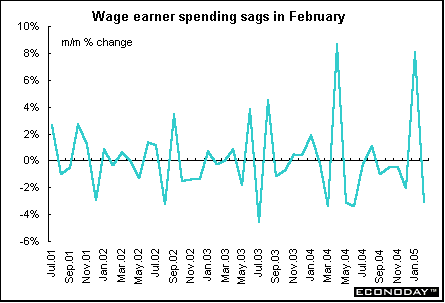
February spending by households headed by a salaried worker sank 3.1 percent and was down 0.4 percent when compared with last year. Wage-earner household spending is an important gauge of personal consumption, which accounts for roughly 55 percent of Japan's gross domestic product. Seasonally adjusted propensity for wage-earner households to consume, a ratio that measures the amount of disposable income that went to household spending, fell to 71.6 percent in February from 74.8 percent in the previous month.
First quarter Tankan business sentiment survey among large Japanese manufacturers dropped to 14 from 22 in the prior quarter. Small manufacturers dropped to zero from 5 in the previous quarter. The Tankan indexes measure the percentage of companies saying business conditions are better minus the percentage saying things are worse. Sentiment for large non-manufacturers remained unchanged at 11. Large manufacturers expect to increase their capital spending by 3.4 percent this fiscal year - significantly less than the 22.7 percent jump in their spending plans in fiscal 2004, which ended March 31st. For the fiscal year started April 1st, large manufacturers predict an average dollar-yen exchange rate of Y104.52. Companies submitted the March survey to the Bank of Japan between February 24th and March 31st. The BOJ surveyed 10,443 companies, of which 97.6 percent responded.
Americas
Canada - February industrial product price index was up 1.1 percent and 2.3 percent when compared with last year. Higher prices for petroleum products, lumber products, motor vehicles, primary metals and pulp & paper products were the main sources of the monthly increase.

February raw materials price index (RMPI) was up 3.1 percent and 11.8 percent when compared with last year. Mineral fuels were up as crude oil prices increased 6.3 percent due to continuing strong demand and colder temperatures. Prices for non-ferrous metals were up 4.2 percent, mainly due to higher prices for zinc, copper, lead, nickel and silver. Prices for vegetable products rose 2.3 percent with higher prices observed for soybeans, canola, coffee and rubber. On a 12-month basis, mineral fuels were up 26.8 percent with crude oil prices rising 35.2 percent. If mineral fuels had been excluded, the RMPI would have decreased 0.3 percent instead of rising 11.8 percent.
In February, the value of the Canadian dollar fell 1.2 percent against the U.S. dollar. As a result, if the exchange rate's impact had been excluded, the IPPI would have risen 0.8 percent compared to the actual 1.1 percent increase. On the year, the value of the Canadian dollar rose 7.2 percent against the U.S. dollar. If the impact of the exchange rate had been excluded, producer prices would have risen 4.2 percent rather than their actual 2.3 percent increase.
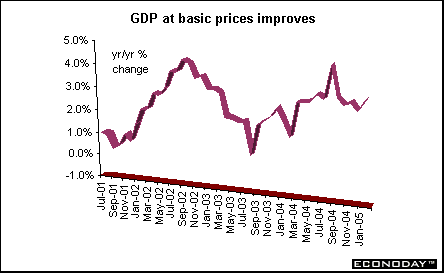
January monthly gross domestic product was up 0.2 percent and 3.4 percent when compared with last year. Manufacturing was up 0.6 percent while retailing jumped 2.3 percent. Activity was up in 15 of 21 major manufacturing groups. Construction activity declined 0.5 percent as residential construction declined in urban areas in every region of the country.
Bottom line
The customary last-week-of-the-month deluge of economic data will be followed this week by an abundance of central bank meetings and the accompanying rhetoric. The data for the most part disappointed, especially in Japan and Europe. Spending, prices and industrial production were down as was the Tankan in Japan. Unemployment was up. In Europe, manufacturing weakened and unemployment continued its climb. The euro and yen both showed the ill effects of weak data and were down on the week.
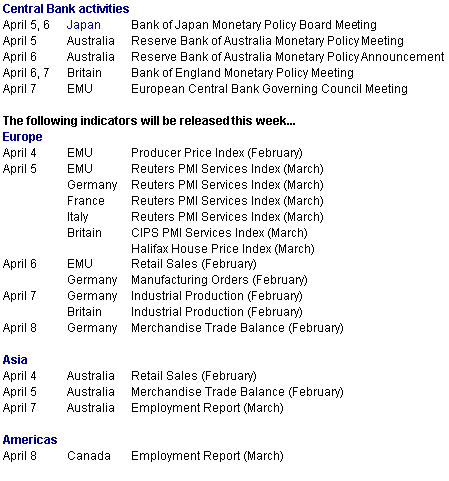
Of the four central bank meetings scheduled this week, only the Reserve Bank of Australia is expected to increase their interest rate which currently stands at 5.5 percent. The Bank of Japan has pledged not to increase their zero interest-rate policy (ZIRP) until there is solid evidence that prices are on the rise. The European Central Bank is not expected to change their current 2 percent policy interest rate nor is the Bank of England expected to change their 4.75 percent rate.
Looking Ahead: April 4 through April 8, 2005
