Monday, May 2, 2005

Global markets suffer from investor angst
Investors responded to poor economic data rather than favorable earnings reports last week, and they sold equities. Stock markets were volatile after a string of weak international data ignited fears that the global outlook is deteriorating. Investors were unsettled about sluggish first-quarter GDP growth in the United States on Thursday (GDP was up an annualized 3.1 percent, a level that many countries can only dream of), which suggested that higher energy prices and subdued consumer sentiment are eroding spending. The GDP data followed a spate of negative reports on consumer confidence, retail sales and durable manufacturing orders that have added to investor perceptions that the U.S economy has hit a soft patch. The news was no better in Europe where a series of sentiment indexes sagged in the major countries, or in Japan where household spending and industrial production drooped.
Overseas markets continue to shadow movements in U.S. markets. The Hong Kong Hang Seng in Asia along with the Dow, TSX composite and Bolsa in the Americas reported increases last week. No one will be sorry to see April end. For the four months through April, the Kospi, STI, CAC and the TSX composite were above their December 31, 2004 levels. The Nasdaq continues to be the poorest performer of the 13.
Global Stock Market Recap by the month

Europe and Britain
Even though the FTSE, CAC and DAX ended the week and month on a positive note Friday, it was too little to offset the bleeding that preceded it. Technology stocks were especially hit hard in Europe as earnings and forecasts from a variety of semiconductor, telecommunication and software companies disappointed. And Nasdaq's downward pull didn't help! These stocks were the worst performing industry group as investors fretted that an economic slowdown would impact their profits negatively. Equities were very volatile as a string of weak data highlighted fears that the global outlook is deteriorating. Investors were particularly unsettled about disappointing U.S. GDP growth. All three indexes were down for the week and month. Only the CAC remains above its end-of-year level.

Weak economic data continued unabated in Europe. This in turn led to the usual pre-meeting political pressure on the European Central Bank, which will meet on Thursday in Berlin. The latest bad news came from the EU economic sentiment indicator which declined to a 19-month low, while French unemployment increased to its highest level in more than 5 years. The ECB is expected to leave its policy interest rate at 2 percent.
In Britain, the outlook dimmed after manufacturing orders sank to their lowest level in almost two years due to sluggish consumer goods demand along with weaker exports. The FTSE sank on fears that weaker consumer spending would negatively impact retailers' profits. Slower consumer spending growth has been evident for some time, but it still has the ability to surprise.
Asia/Pacific
Asian/Pacific stock markets sagged Friday as the lower-than-expected U.S. GDP growth increased worries over global economic growth. Markets were closed in Japan on Friday as the annual Golden Week holidays began. Anything that might impact Asian sales in the U.S. affects investors here. The U.S. continues to be the world's engine of growth and any slowdown is worrisome because of the potential negative impact on demand for exports. Hong Kong shares benefited from heightened speculation about a Chinese currency revaluation. These rumors offset declines in U.S. markets and the start of a long holiday weekend. The stock market will be closed Monday for the Labour Day holiday.
South Korean shares have been negatively affected as well, as investors sold stocks on worries over the U.S. economy. The potential revaluation of the Chinese yuan, in contrast to Hong Kong, brought pressure on stocks here. Shipbuilding stocks were lower because an appreciated yuan could strengthen the Korean won, hurting shipbuilders' exports. The Hang Seng was the only index followed here that gained last week. The Kospi and STI are above their year-end levels.

Japanese stocks foundered last week on weak economic data and despite progress in resolving the crisis between China and Japan. The crisis had hit stocks hard during the previous two weeks. The crisis, which had been precipitated by the Japanese government's approval of a history textbook condemned as nationalist by many Chinese, showed signs of easing after the Chinese government managed to quell anti-Japanese protests. But gains in Japanese stocks were capped by the fact that a meeting between the two countries' leaders on Saturday (April 23) did not promise to resolve the issue. The shipping sector was among the most heavily affected by the crisis because of its strong dependence on China. Air transport has also suffered as tourists scratched their bookings to China.
The Bank of Japan held a one-day meeting on Thursday and left its zero interest rate policy unchanged. The BoJ has officially abandoned hope that inflation will return before March 2006, and it lowered its forecast for real economic growth in the current fiscal year to 1.3 percent.
Currencies
The dollar stayed resilient despite the continuing flow of disappointing U.S. economic data. Some analysts say that the currency is being supported by the growing negatives elsewhere. Economic data elsewhere indicate that interest rates will remain on hold next week in both Australia and the EMU, at 5.5 percent and 2 percent respectively.

The yen was up last week despite new data indicating that deflation remains entrenched. Rather, the yen was up because of renewed speculation of an imminent Chinese easing of the renminbi's or dollar peg. This speculation has sent the currency markets into a tizzy. A revaluation could lead to possible strengthening of other Asian currencies that have thus far benefited from being under-valued. China's basic stance has remained broadly unchanged despite pressures from the U.S. to ease the peg. An undervalued currency maintains export growth and can be tolerated domestically since inflation has been tempered by manufacturing overcapacity and the nation's massive labor pool. And at least for now, necessary central bank sterilization is affordable.

Now currency traders are taking positions on renminbi revaluation ahead of the May bank holiday this week. For some reason it is seen as a trigger point for Beijing to act. And they are using the yen and other Asian currencies as a proxy for the non-tradable Chinese currency. Partly as a result, the yen has risen about 3 percent against the dollar since April 5, when the latest bout of renminbi speculation intensified. This week is seen by some analysts - and it is purely speculation - as an opportunity for a revaluation simply because most Asian markets are closed. The Chinese central bank has denied these rumors.
Indicator scoreboard
EMU - March M3 money supply was up 0.3 percent and 6.5 percent when compared with last year. The moving average for the three months to March was up 6.7 percent when compared with the same three months a year ago. The European Central Bank uses the moving average as its main indicator of money supply growth. Its target rate is 4.5 percent.

April EU economic sentiment index dropped to 96.5 from 97.5 in March. Industrial sentiment declined to minus 9 from minus 8 in the previous month. Consumer sentiment increased to minus 13 from minus 14 in March. Sentiment also declined in services and construction while retail confidence managed to increase. Only Spanish confidence was up in April. The decline in industrial sentiment permeated all indicator components.

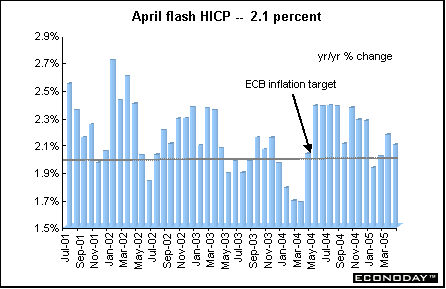
April flash harmonized index of consumer prices was up 2.1 percent when compared with last year. No details or monthly change is available with the flash report. The ECB inflation target is 2 percent, where the HICP has hovered for the last several months.
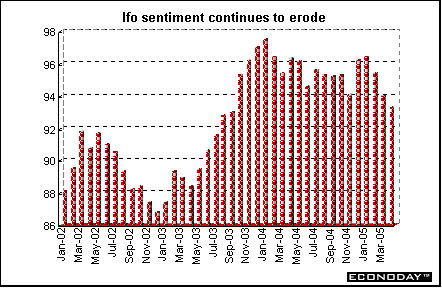
Germany - April Ifo business sentiment index edged down to 93.3 from 94 in March. Both current conditions and business expectations were down. Current conditions index was down to 93.1 from 93.3 while expectations declined to 93.6 from 94.6 in the prior month.
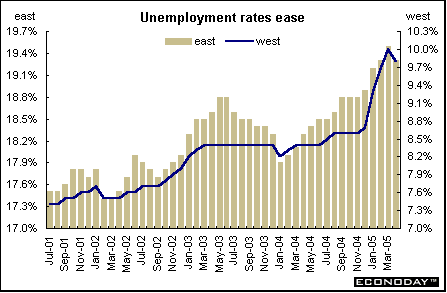
April seasonally adjusted unemployment dropped by 79,000 to 4.89 million. The unemployment rate declined to 11.8 percent from 12 percent in March. Unemployment rate eased to 9.8 percent from 10 percent in the west and was down to 19.3 percent from 19.5 percent in the east. The decline in the number of jobless this month came after the March total was 50,000 higher than expected as a result of colder weather that the Labor Agency said "delayed the normal seasonal reduction in unemployment" in farming, tourism and construction. There was also a reduction in the number of claimants classified as able to work and therefore eligible for jobless benefits. March employment was up by 4,000 primarily due to more part-time jobs and other government-promoted employment programs. The jobless register has jumped in 2005 by the addition of as many as 360,000 former welfare claimants. They were forced to register as unemployed under a new law aimed at increasing incentives to find work.
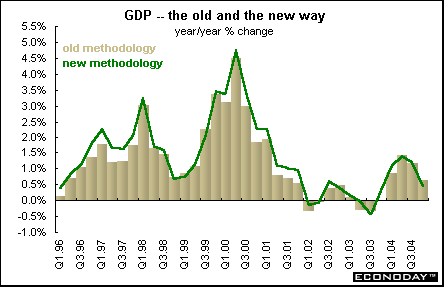
Germany has changed the way it calculates gross domestic product. It is now using the chain link method. Three basic changes were implemented in this revision. A new price adjustment method was introduced - the fixed price base has been replaced by the previous year's price base with chain linking; allocation of financial intermediation services indirectly measured (FISIM) to the users; and the integration of newly available statistical data. Now deflating national accounts data is no longer done at prices of a fixed base year (recently 1995 prices), but at prices of the previous year (that is, for example, results for 2005 at prices of 2004). This means that German national accounts will meet a deadline for implementing binding European legal provisions, contributing to the international harmonization of price and volume measurement.
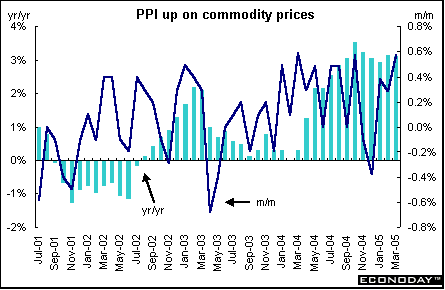
France - March producer price index was up 0.6 percent and 3.1 percent when compared with last year. Core PPI which excludes food and energy was up 0.1 percent and 2.5 percent on the year. As in February, higher commodity prices drove the index higher. Overall energy prices jumped 2.9 percent and 11.2 percent on the year. However, food and agriculture prices were down 0.1 percent and were 1.8 percent lower the year.
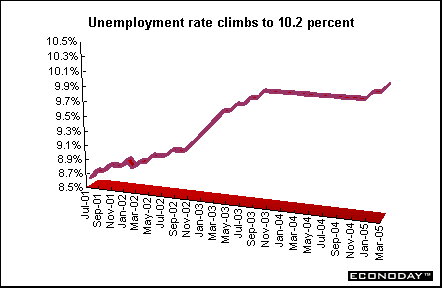
March seasonally adjusted unemployment was up by 7,000 to a total of 2.775 million. As a result, the unemployment rate edged up to 10.2 percent from 10.1 percent in the preceding month. The data are calculated using the International Labour Organization definition of jobless which excludes jobseekers who did any work during the month.
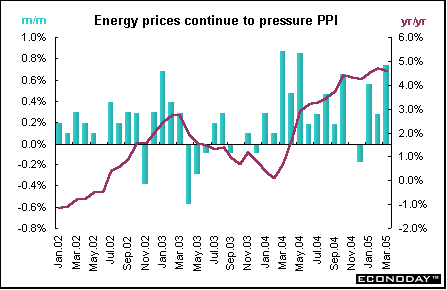
Italy - March producer price index jumped 0.7 percent and 4.6 percent when compared with last year, thanks once again to increased energy prices. Energy goods prices were up 3.8 percent and 14.2 percent on the year. Excluding energy, the PPI was up a modest 0.1 percent and 2.8 percent on the year.
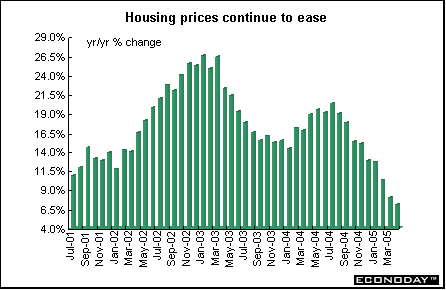
Britain - April Nationwide house price index was up 0.9 percent and 7 percent when compared with last year. The average property sold by Nationwide cost �156,100 in April, compared with �153,900 in March and �154,300 last July.
Asia
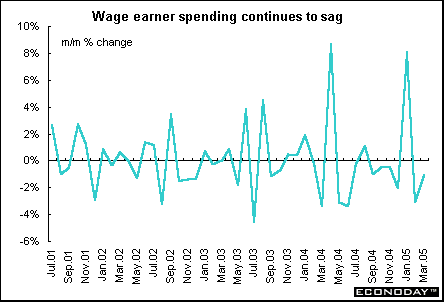
Japan - March spending by wage earner households was down 1.1 percent but up 1.7 percent when compared with last year. The data are an important gauge of personal consumption, which accounts for roughly 55 percent of Japan's gross domestic product. Seasonally adjusted propensity for wage-earner households to consume, a ratio that measures the amount of disposable income that went to household spending, rose to 73.3 percent from 71.6 percent in February.
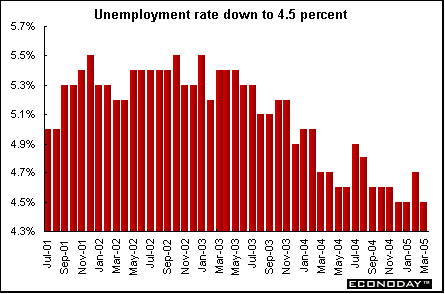
March unemployment rate dropped to 4.5 percent from 4.7 percent in the previous month. The number of unemployment was down 190,000 when compared with last year. The number of those with jobs fell by 190,000 on the year.
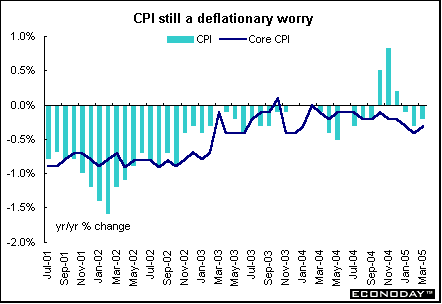
April Tokyo consumer price index was up 0.1 percent but down 0.4 percent when compared with last year. Core CPI, which excludes fresh food, was up 0.2 percent but down 0.5 percent on the year. The pace of decline in Tokyo consumer prices is considered an early indicator of price trends for the rest of Japan. March nationwide CPI was up 0.3 percent but down 0.2 percent on the year. Core CPI which the Bank of Japan uses as a benchmark for monetary policy was up 0.3 percent but down 0.3 percent on the year.
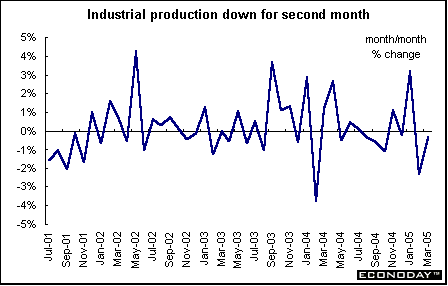
March seasonally adjusted industrial production was down 0.3 percent but was up 2.1 percent when compared with last year. Transport equipment, fabricated metals and information & communication electronics equipment declined.
Australia - First quarter producer price index was unchanged and up 3.7 percent when compared with the same quarter a year ago. The domestic component of the PPI was up 0.4 percent and 4.4 percent on the year mainly due to increases in building construction and beverage and malt manufacturing. These increases were partially offset by decreases in petroleum refining. The imports component dropped 2.2 percent and was down 0.7 percent due to exchange rate driven price drops for both consumer and capital goods (including electronic equipment, motor vehicles & parts, tobacco products and industrial machinery) which were partially offset by increases in dairy products.
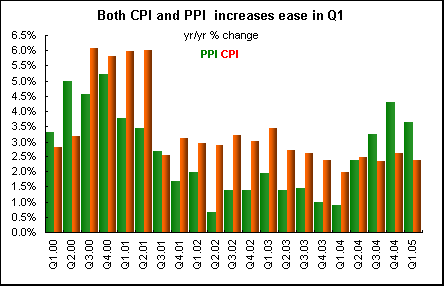
First quarter consumer price index was up 0.7 percent and 2.4 percent when compared with the same quarter a year ago. Core CPI which excludes gasoline, education costs and fruit & vegetables, increased 0.4 percent and 1.8 percent on the year. Driving inflation were higher oil prices which in turn increased the cost of airfares, gasoline and taxis. A 27 percent gain in crude oil prices in the first three months of this year saw gasoline prices jump 11 percent, according to the Australian Institute of Petroleum. The Reserve Bank of Australia maintains an inflation target range of between 2 and 3 percent.
Americas
Canada - March industrial product price index (IPPI) was up 0.3 percent and 2.1 percent when compared with last year. Higher prices for petroleum products, fruit, vegetable and feed products and rubber, leather and plastic products were the main sources of the monthly increase. Petroleum and coal products prices increased 7.1 percent as gasoline and fuel oil prices continue to rise. If petroleum and coal product prices had been excluded, the IPPI would have decreased 0.3 percent rather than increasing 0.3 percent. Petroleum and coal products continued to influence the 12-month change, soaring by 26.3 percent on the year. If petroleum and coal product prices had been excluded, the IPPI would have increased only 0.3 percent rather than 2.1 percent.
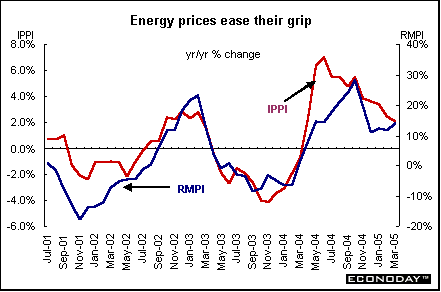
March raw materials price index (RMPI) was up 6.2 percent and jumped 14 percent when compared with last year. Price increases for mineral fuels, animals and animal products, non-ferrous metals as well as vegetable products contributed to the increase. Mineral fuels were up 10.5 percent on the month as crude oil prices increased 12.6 percent due to continuing strong demand along with supply concerns. On a 12-month basis, mineral fuels were up 31.5 percent with crude oil prices rising 39.5 percent. If mineral fuels had been excluded, the RMPI would have decreased 0.6 percent instead of rising 14.0 percent.
Between February and March, the value of the Canadian dollar rose 1.9 percent against the U.S. dollar. If the impact of the exchange rate had been excluded, the IPPI would have risen 0.8 percent compared with the actual 0.3 percent increase. On a 12-month basis, the value of the Canadian dollar rose 9.2 percent against the U.S. dollar. If the impact of the exchange rate had been excluded, producer prices would have risen 4.5 percent between March 2004 and March 2005, rather than their actual 2.1 percent increase.
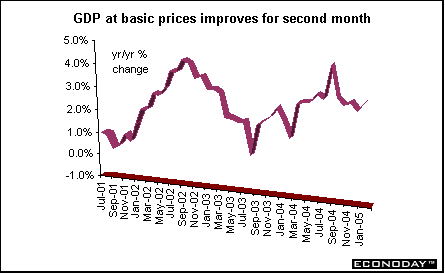
February monthly gross domestic product was up 0.3 percent and 3.9 percent when compared with last year. The increase was due to retail spending and continued strength in machinery and equipment. Both retailing and wholesaling activity were up on the month. Manufacturing output also was up thanks to durable goods production. Only nine of 21 major groups accounting for 38 percent of manufacturing value were up on the month.
Bottom line
The first week of the month brings the monthly meetings of the ECB and Reserve Bank of Australia. Also on the agenda is the British general election Thursday. Because of the election's schedule, the Bank of England Monetary Policy Committee meeting scheduled for Wednesday and Thursday has been postponed to Friday with the policy announcement scheduled for Monday, May 9th. The first week of the month generally brings a deluge of new economic data for investors to digest including the carefully watched purchasing managers indexes. Also on the agenda is the Federal Reserve Open Market Committee meeting. A 25-basis-point increase is expected. Japanese markets will be closed for most of this week on to celebrate Golden Week holidays.
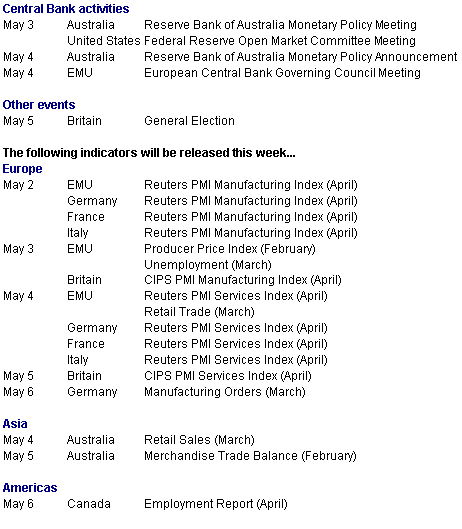
Looking Ahead: May 2 through May 6, 2005
