After a dreadful 2002, equities now have posted gains for the three year. And 2005's gains matched or far exceeded healthy gains in 2004. The South Korean Kospi was the best performing index, climbing a torrid 54 percent. The increase was driven by an improving domestic economy, a corporate earnings rebound and stronger foreign investment inflows. The table below ranks 13 international indexes by their performance in 2005.

Buoyant Asian and European markets broke through key milestones as global equity trading wrapped up for the year. Foreign investors bought Japanese stocks with abandon especially in the second half of 2005 and as a result, the Topix soared by 43.5 percent while the Nikkei soared by 40.2 percent on continued optimism about the Japanese economy. European shares also hit multi-year highs, led by gains in Germany and France. The Mexican Bolsa, 2004's big winner, gained 38 percent after vaulting 47 percent in 2004. Wall Street continued to trail well behind other big markets and hovered around its 2004 closing level. The graph below pictures the come-back of major indexes since the 2001 and 2002 declines.

Global Stock Market Recap - Quarterly Results

Europe and Britain
Despite all of the problems in Europe and the UK in 2005, equities were the investment of choice. The CAC and DAX have risen more than 24 percent and 27 percent respectively - easily outperforming U.S. indexes. The gains in Europe have been achieved in the face of sluggish economic growth in the region, soaring energy and commodities prices, the threat of inflation and damage to corporate earnings - as well as political uncertainties. The key plus factor for equities was the quality of European companies' earnings. The euro's weakness played a pivotal role too, dropping about 13 percent against the dollar this year. This boosted exporters' competitiveness while increasing overseas earnings for European companies, which are far more exposed to the international economy than their U.S. counterparts. And now there are signs that domestic economic growth is finally picking up as well.

The political uncertainties and setbacks were numerous. The French and Dutch rejected the European Union's constitutional treaty designed to make the organization work more efficiently. And EU members also engaged in a highly public and fractious debate over the EU's future financing. German voters rebelled against the prospect of radical economic reform and only half-heartedly endorsed Angela Merkel to replace Gerhard Schroeder as their new chancellor. Riots raged across 300 towns in France. The European Central Bank was accused of running a "sado-monetarist" policy by raising interest rates by 25 basis points to 2.25 percent in December just as a fragile economic expansion got under way. And Italy's central bank became mired in a controversy that led to the resignation of its governor. Suicide bombers hit London. But financial markets were unfazed for the most part.
The FTSE 100 was up 16.7 percent in 2005, its best performance in six years thanks to soaring resource sector stocks and a pick up in mergers and acquisitions. A third consecutive year of gains means the market has recouped much of the losses sustained in the period between 2000 and 2002. Investor gains this year have been driven by sharp price increases in oil, copper and other commodities, which have sent the prices of energy and mining stocks soaring.
Asia/Pacific
South Korean shares rose to a fresh record high to finish 2005 as Asia's best performing major benchmark index. In Japan, the Topix and Nikkei continued their march upward as well. The Topix gained 43.5 percent on the year while the Nikkei recorded a 40.2 percent jump. The gains are the Nikkei's biggest yearly advance since the height of the bubble in 1986 and its best second-half rally since U.S. occupation forces left in 1952. The second half gain, which represented the bulk of the year's gain, was fed by Prime Minister Junichiro Koizumi's resounding electoral victory in September on a platform of further reform. The market has been underpinned by solid macro-economic fundamentals, including signs of an end to seven years of deflation as well as a tightening labor market that in turn is feeding consumer optimism and spending. Exports have also started to pick up again, particularly to China and the U.S. - and are likely to receive a further boost in coming months as a result of continued yen weakness.

Americas
One just has to look north and south of the border to find sparkling equity gains. To the south, the Bolsa gained 38 percent in 2005 while to the north the S&P TSX Composite was up 22 percent. Both have benefited from soaring demand and prices for oil. In Canada, demand for other commodities boosted the economy and stocks. Stocks surged pushing the S&P/TSX near an all-time high. The index ended the year just below the record level of 11,388.80 reached in September 2000. Energy shares, which make up 27 percent of the S&P/TSX, have rallied 60 percent, almost twice the advance of any of the other nine industry groups. In contrast, U.S. indexes underperformed most world indexes, with the Dow slipping below its 2004 close on the last day of 2005 trading.

Currencies
Contrary to expectations, the dollar gained on the yen and euro for the first time since 2001. At the end of 2004, the dollar was trading at $1.356 to the euro and ¥102.58 against the Japanese yen and analysts were projecting that the dollar would again decline in 2005. They were wrong. The dollar gained about 13 percent against the euro and about 15 percent against the yen. Last year at this time traders were obsessed with the burgeoning U.S. current account deficit - and periodically still are - and opined about a disorderly decline in the dollar should Asian central banks stop buying U.S. Treasuries. Central banks did cut back their dollar buying, but private investors jumped in and more than covered the shortfall. The dollar was helped by the Homeland Investment Act, a year-long tax break designed to encourage U.S. multinationals to repatriate cash held overseas. But the most important reason for the dollar's strength was interest rate dynamics. The Federal Reserve continued to increase U.S. rates thereby narrowing the dollar's rate differential against most other currencies. While the U.S. policy rate now stands at 4.25 percent, Japan's interest rate remains at virtually zero and the ECB's rate edged up to 2.25 in December. Such low rates led the euro and yen to be increasingly used as funding currencies in carry trades - that is borrowing in low-yielding currencies to fund positions in higher-yielding ones.

Indicator scoreboard
EMU - October seasonally adjusted merchandise trade deficit was €1.2 billion. Exports were down 2.3 percent and imports were up 0.9 percent. Germany and France recorded surpluses while Spain and Italy were in deficit. On a non-seasonalized basis, merchandise trade was balanced with neither a surplus nor deficit.

October industrial production was down 0.8 percent and edged up 0.1 percent when compared with last year. All product categories were down on the month. Both energy and capital goods output were down 1.2 percent while durables dropped 0.6 percent and nondurables declined by 0.7 percent.

October industrial orders were down 0.5 percent but up 4.4 percent when compared with last year. Strong gains in Germany were offset elsewhere. German orders were up 2.6 percent but French orders sank 2.1 percent. Orders were down in Ireland, Belgium and Finland as well. Orders were up for machinery & equipment as well as textiles. Orders were down for transport equipment, chemicals, metals and electronics.
Germany - November producer price index edged down 0.1 percent and was up 5 percent when compared with last year. Prices for oil and oil products were down 3.4 percent but were up 35.6 percent on the year. Excluding oil and oil products, producer prices were up 0.4 percent and 4.6 percent on the year. Non-ferrous metals and semi-finished goods were up 3.6 percent on the month.

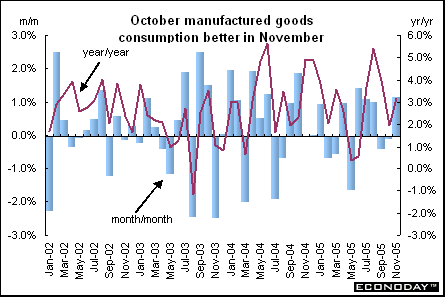
France - November consumer spending on manufactured goods was up 1.2 percent and 3.2 percent when compared with last year. Clothing outlays jumped by 9.5 percent after sinking 3.6 percent in the previous month while auto spending was up 0.6 percent after declining 1 percent in October.
November unemployment rate edged down to 9.6 percent from 9.7 percent in the previous month. The number of unemployed dropped from 2,665,000 in October to 2,634,000 in November.

Italy - Third quarter seasonally adjusted unemployment rate was unchanged at 7.7 percent. The number of new jobs was down 0.2 percent - but this was offset by a drop in the number of people seeking jobs. Third quarter seasonally adjusted number of unemployed was down 0.8 percent. The number of employed was down by 55,000 due mainly to fewer jobs in agriculture, construction and services.

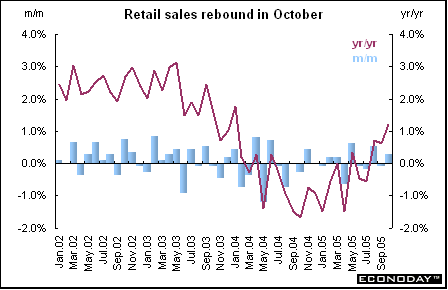
October retail sales were up 0.3 percent and 1.4 percent when compared with last year. Food sales, which account for about 40 percent of total sales, were up 0.4 percent while non-food sales were up 0.1 percent. These retail sales data are not as closely watched as in some eurozone countries, because they are often volatile and show little correlation with consumer spending data published in quarterly GDP statistics.
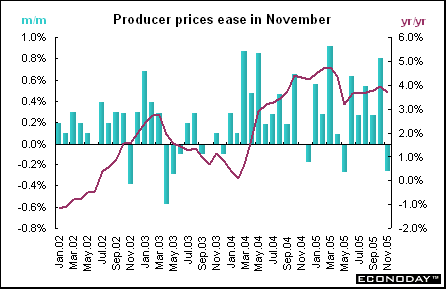
November producer price index was down 0.3 percent but up 3.7 percent when compared with last year. The monthly decline was due to a drop in energy prices of 2.5 percent. Consumer and intermediate goods prices were up on the month while capital goods prices wee unchanged. Excluding energy, the PPI was up 0.3 percent and up 0.8 percent on the year.
Britain - Third quarter gross domestic product was up 0.4 percent and 1.7 percent when compared with the same quarter a year ago. Household spending climbed 0.5 percent and 1.3 percent on the year. Growth was hit by a sharp decline in oil output due to maintenance work and other time factors in oil and gas output. Investment expenditures were up 2.2 percent and 2.9 percent on the year.

Asia
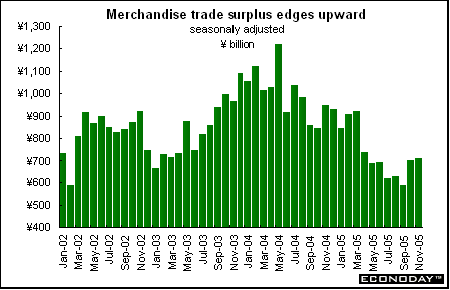
Japan - November seasonally adjusted merchandise trade surplus widened to ¥708.12 billion from ¥698.55 billion in October. On a non-adjusted basis, the surplus rose to ¥600.6 from ¥597.3 billion the same month a year earlier. Exports were up 14.7 percent on the year in value terms while imports were up 16.6 percent as high crude oil prices continued to inflate import bills. On a bi-lateral basis, Japan posted a trade deficit with China and a trade surplus with the U.S.
October seasonally adjusted tertiary index was up 1.2 percent and 3.1 percent when compared with last year. The tertiary index reflects activity in 11 service industries, among which are utilities; transport; telecommunications; wholesale and retail; finance and insurance; real estate; restaurants and hotels; medical, health care and welfare.
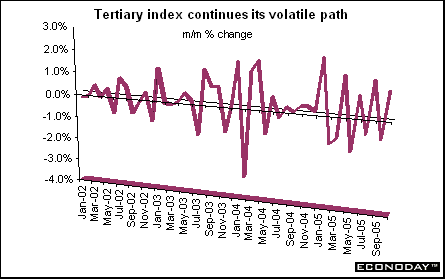
October all industry activity index was up 0.9 percent and 2.8 percent when compared with last year. The all industry index takes a reading of activity in the 11 industries that comprise the tertiary index combined with activity in the construction, agricultural and fisheries industries, the public sector and industrial output. This index is considered a close approximation for gross domestic product growth as measured by industrial and service sector output.

December Tokyo consumer price index was unchanged and down 0.6 percent when compared with last year. Tokyo core CPI which excludes only fresh food was up 0.1 percent and down 0.2 percent on the year. November national CPI was down 0.3 percent and sank 0.8 percent on the year. Core national CPI was down 0.2 percent but up 0.1 percent on the year. That was the first increase in the national core CPI since October 2003. The government also unveiled a new reference index for the CPI, which excludes all fuel and food costs. That measure, which is similar to indicators used in the U.S. and in Europe, was down 0.2 percent from a year ago. The new index is likely to be adopted by the government next summer.

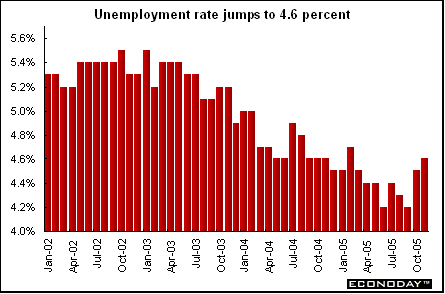
November seasonally adjusted unemployment rate climbed to 4.6 percent from 4.5 percent in the previous month. The total number of jobless rose for the first time in 31 months, increasing by 20,000 from the same month a year earlier. The total jobless figure was up because the number of people who left positions on their own volition to look for better jobs or pay or both rose by 140,000. Those who left because of company reasons, mainly by being let go, dropped by 70,000. The ratio of job offers to job seekers, an indicator of demand for labor, rose to 0.99 in November from 0.98 in the previous month. That's the highest level since October 1992, indicating the jobs situation is improving in line with economic recovery and better corporate performance.
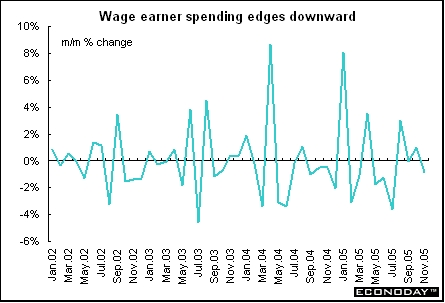
November spending by households headed by salary earners was down 0.9 percent but up 1.2 percent when compared with last year. Salary earner spending accounts for about 60 percent of total household spending.
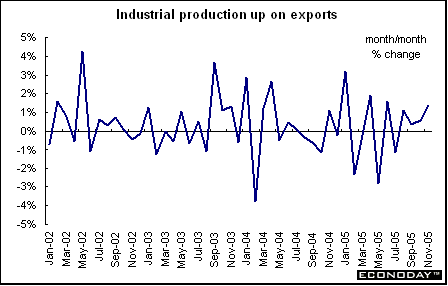
November industrial production was up 1.4 percent and 3.3 percent when compared with last year. Production was up for general machinery, transport equipment and electronic parts & devices. Shipments were up 0.3 percent and 3.8 percent on the year. Shipments were up for electronic parts & devices, information & communication electronics equipment and general machinery.
Americas
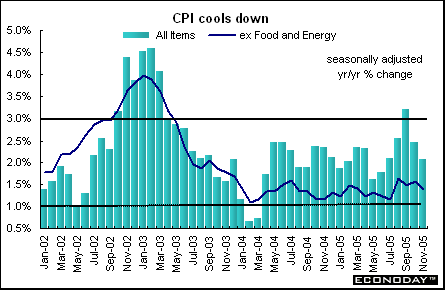
Canada - November consumer price index was down 0.2 percent and up 2 percent when compared with last year. The CPI excluding energy was up 0.4 percent and 1.4 percent on the year. Gasoline prices were down an average of 11.2 percent, the result of lower wholesale prices and lower crude oil prices on the world market. The 12-month change in the all-items index excluding eight volatile components, as defined by the Bank of Canada, was up 1.6 on the year. On a seasonally adjusted basis, the CPI was down 0.2 percent and up 2.1 percent on the year. Excluding food and energy the CPI was up 0.2 percent and 1.4 percent on the year.
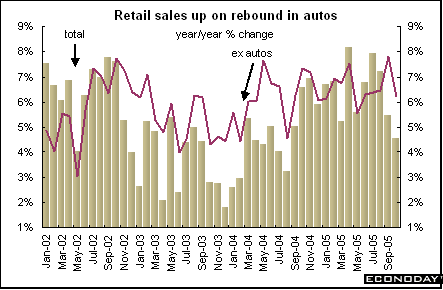
October retail sales were up 0.6 percent and 4.6 percent when compared with last year. Excluding sales by dealers of new, used and recreational vehicles and auto parts, retail sales were down 0.3 percent and up 6.2 percent on the year. Auto sales were up 2.1 percent while pharmacies & personal care stores were up 0.9 percent and furniture, home furnishings & electronics stores gained 0.5 percent.
October monthly gross domestic product was up 0.2 percent and 3.1 percent when compared with the same month a year ago. Strength in the goods producing sector was concentrated in manufacturing, notably the production of motor vehicles. Output in the mining, oil and gas extraction sector was lower after a strong showing in September. Growth in the service sector was stimulated by both retail and wholesale trade, particularly as new motor vehicle sales gained momentum. A strike by British Columbia teachers, however, hampered growth in the service sector. Manufacturing output grew 1.0 percent. Production increased in 14 of the 21 major groups, accounting for 72 percent of this sector's output. The largest increases were recorded by manufacturers of transportation equipment, machinery, chemicals and furniture & related products.

Bottom line
After two moribund weeks, investors will return with fresh insights into 2006 and will be eagerly awaiting the latest economic numbers. And they won't be disappointed. The usual plethora of purchasing manager's indexes and other data will be available during the first week of the year. They will have to wait another week though for interest rate directives from the Bank of England the European Central Bank. Most importantly, investors will have to consider whether equities - at least outside the U.S. - can duplicate 2005 gains.
A happy and healthy New Year from all of us at Econoday!

