|
Relative calm prevailed as anxious investors responded to the enactment of U.S. tariffs and China’s response to them was implemented. Some analysts explained the calm saying that the tariffs were already priced in the marketplace. But what about going forward? Will there be another round of reciprocal tariffs? Markets dislike unknowns. The reality of the trade war is expected to travel through global supply chains, lifting costs for both consumers and businesses. No official talks are scheduled between China and the U.S. to resolve the situation.
Economic data continued to be mostly positive in Europe and the U.S. In Asia, data were mixed for China but mostly positive for Australia. For the week, most equity indexes retreated while in Europe and the U.S. equities gained.
| |
|
2017 |
2018 |
% Change |
|
Index |
Dec 29 |
June 29 |
July 6 |
Week |
2018 |
| Asia/Pacific |
|
|
|
|
|
|
| Australia |
All Ordinaries |
6167.3 |
6289.7 |
6355.7 |
1.0% |
3.1% |
| Japan |
Nikkei 225 |
22764.9 |
22304.5 |
21788.1 |
-2.3% |
-4.3% |
|
Topix |
1817.56 |
1730.89 |
1691.5 |
-2.3% |
-6.9% |
| Hong Kong |
Hang Seng |
29919.2 |
28955.1 |
28315.6 |
-2.2% |
-5.4% |
| S. Korea |
Kospi |
2467.5 |
2326.1 |
2272.9 |
-2.3% |
-7.9% |
| Singapore |
STI |
3402.9 |
3268.7 |
3191.8 |
-2.4% |
-6.2% |
| China |
Shanghai Composite |
3307.2 |
2847.4 |
2747.2 |
-3.5% |
-16.9% |
|
|
|
|
|
|
|
| India |
Sensex 30 |
34056.8 |
35423.48 |
35657.9 |
0.7% |
4.7% |
| Indonesia |
Jakarta Composite |
6355.7 |
5799.2 |
5694.9 |
-1.8% |
-10.4% |
| Malaysia |
KLCI |
1796.8 |
1691.5 |
1663.9 |
-1.6% |
-7.4% |
| Philippines |
PSEi |
8558.4 |
7193.7 |
7186.7 |
-0.1% |
-16.0% |
| Taiwan |
Taiex |
10642.9 |
10836.9 |
10608.6 |
-2.1% |
-0.3% |
| Thailand |
SET |
1753.7 |
1595.6 |
1614.8 |
1.2% |
-7.9% |
|
|
|
|
|
|
|
| Europe |
|
|
|
|
|
|
| UK |
FTSE 100 |
7687.8 |
7636.9 |
7617.7 |
-0.3% |
-0.9% |
| France |
CAC |
5312.6 |
5323.5 |
5375.8 |
1.0% |
1.2% |
| Germany |
XETRA DAX |
12917.6 |
12306.0 |
12496.2 |
1.5% |
-3.3% |
| Italy |
FTSE MIB |
21853.3 |
21626.3 |
21925.5 |
1.4% |
0.3% |
| Spain |
IBEX 35 |
10043.9 |
9622.7 |
9905.0 |
2.9% |
-1.4% |
| Sweden |
OMX Stockholm 30 |
1576.9 |
1558.9 |
1524.2 |
-2.2% |
-3.3% |
| Switzerland |
SMI |
9381.9 |
8609.3 |
8697.4 |
1.0% |
-7.3% |
|
|
|
|
|
|
|
| North America |
|
|
|
|
|
|
| United States |
Dow |
24719.2 |
24271.41 |
24456.5 |
0.8% |
-1.1% |
|
NASDAQ |
6903.4 |
7510.3 |
7688.4 |
2.4% |
11.4% |
|
S&P 500 |
2673.6 |
2718.4 |
2759.8 |
1.5% |
3.2% |
| Canada |
S&P/TSX Comp. |
16209.1 |
16277.7 |
16371.8 |
0.6% |
1.0% |
| Mexico |
Bolsa |
49354.4 |
47663.2 |
48981.4 |
2.8% |
-0.8% |
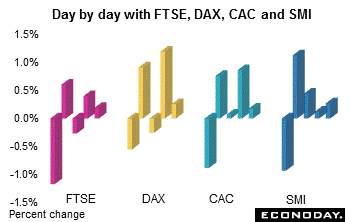 Most European indexes logged gains for the week. However, the FTSE (down 0.3 percent) and the OMX Stockholm (down 2.2 percent) did not. The CAC and DAX gained 1.0 percent and 1.5 percent respectively while the SMI was 1.0 percent higher. Traders were cautious thanks to concerns about the trade war brewing between the U.S. and China. The U.S. imposed tariffs on US$34 billion worth of Chinese imports and China quickly responded in kind Friday. President Trump then escalated matters by saying the U.S. could soon impose tariffs on more than $500 billion in Chinese imports. Most European indexes logged gains for the week. However, the FTSE (down 0.3 percent) and the OMX Stockholm (down 2.2 percent) did not. The CAC and DAX gained 1.0 percent and 1.5 percent respectively while the SMI was 1.0 percent higher. Traders were cautious thanks to concerns about the trade war brewing between the U.S. and China. The U.S. imposed tariffs on US$34 billion worth of Chinese imports and China quickly responded in kind Friday. President Trump then escalated matters by saying the U.S. could soon impose tariffs on more than $500 billion in Chinese imports.
Equities ended the week calmly as investors shrugged off worries over global trade after U.S. tariffs on Chinese goods took effect. The U.S. imposed the tariffs with Beijing saying it had no choice but to respond in kind. While the uncertainty surrounding the tariffs and their impact on growth has weighed on market sentiment, the reaction across European stocks was relatively sanguine. Some analysts suggested the tariffs had already been priced in by the market.
Earlier in the week after Washington said it would implement the tariffs on Chinese imports on July 6, Beijing promised to retaliate in kind on the same day. However, China’s finance ministry said it will “absolutely not” fire the first shot in a trade war with the United States and will not be the first to levy tariffs. Concerns about the outbreak of a global trade war have, among other factors, prevented a sustained recovery in global stock markets since a violent sell-off knocked them off records highs in February.
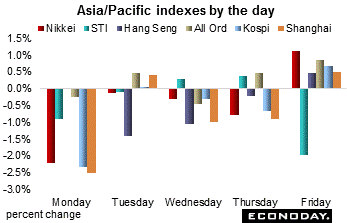 Most Asian equity indexes retreated last week with U.S. tariff implementation looming at week’s end. But on Friday investors responded with relative calm to U.S. tariffs on US$34 billion worth of Chinese imports that took effect after midnight Thursday. China said it is "forced to make a necessary counterattack" in equal measure. On the week, only the All Ordinaries (up 1.0 percent), Sensex (up 0.7 percent) and the SET (up 1.2 percent) managed to increase. Losses in the major indexes were over 2 percent with the Shanghai Composite tumbling 3.5 percent. Most Asian equity indexes retreated last week with U.S. tariff implementation looming at week’s end. But on Friday investors responded with relative calm to U.S. tariffs on US$34 billion worth of Chinese imports that took effect after midnight Thursday. China said it is "forced to make a necessary counterattack" in equal measure. On the week, only the All Ordinaries (up 1.0 percent), Sensex (up 0.7 percent) and the SET (up 1.2 percent) managed to increase. Losses in the major indexes were over 2 percent with the Shanghai Composite tumbling 3.5 percent.
On Friday, Asian stocks bounced back from 9-month lows in volatile trade after Washington put tariffs on Chinese imports, a move many investors fear could be the start of a full-scale trade war between China and the United States. Mainland Chinese shares led Asia’s recovery, partly helped by the perception that the tariff measures were already priced in.
The U.S. tariffs on more than 800 goods from China worth $34 billion took effect but its quiet start prompted short-covering by those who had feared for fresh retaliatory measures. China’s commerce ministry said in a statement shortly after the deadline passed that it was forced to retaliate, meaning $34 billion worth of imported U.S. goods including autos and agricultural products also faced 25 percent tariffs. On Thursday, China's General Administration of Customs said on its website that additional tariff measures on U.S.-made imports will take effect immediately after the U.S. tariffs on its goods become effective.
The Bank of Japan’s Tankan survey of business conditions for the second quarter conveyed some mixed but overall positive messages. Among large firms, the diffusion index of business conditions slipped from 24 to 21 for manufacturing firms but rose from 23 to 24 for non-manufacturing firms. Both moved contrary to expectations but given global trade tensions and the recent appreciation of the yen, the less upbeat reaction among manufacturers seems understandable. Forecasts for investment growth were considerably stronger than expected, with large manufacturing firms anticipating a 17.9 percent increase in overall investment (including land) in fiscal year 2018 compared with 6.3 percent in fiscal 2017). Improvement in investment expectations for large firms outweighed erosion in investment prospects for medium and small firms, leaving capex growth projections for all firms across industries at 7.9 percent in fiscal 2018 (up from 4.4 percent in FY 2017).
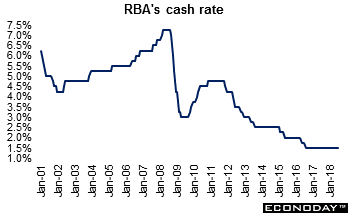 As widely expected, the Reserve Bank of Australia left its key policy interest rate at 1.5 percent where it has been since August 2016. In its statement accompanying the decision, the RBA expressed its concern about "the direction of international trade policy in the United States". Turning to the domestic outlook, the Board said that incoming data are consistent with their forecast for the economy to grow on average by just over 3.0 percent in 2018 and 2019. Stronger exports and non-mining business investment, in particular, are expected to support headline growth despite continued uncertainty about the prospects for consumer spending. The RBA's assessment of inflation was unchanged, namely that price pressures will remain subdued and strengthen only gradually as economic conditions improve. As widely expected, the Reserve Bank of Australia left its key policy interest rate at 1.5 percent where it has been since August 2016. In its statement accompanying the decision, the RBA expressed its concern about "the direction of international trade policy in the United States". Turning to the domestic outlook, the Board said that incoming data are consistent with their forecast for the economy to grow on average by just over 3.0 percent in 2018 and 2019. Stronger exports and non-mining business investment, in particular, are expected to support headline growth despite continued uncertainty about the prospects for consumer spending. The RBA's assessment of inflation was unchanged, namely that price pressures will remain subdued and strengthen only gradually as economic conditions improve.
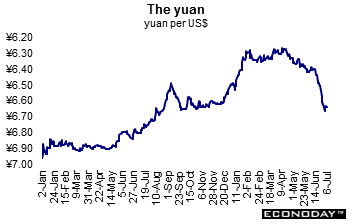 On Tuesday, the euro and Australian dollar advanced after the Chinese central bank — the People’s Bank of China — moved to calm nervous foreign exchange markets following a fall in the renminbi below a key psychological level. In a statement on the People Bank of China’s website, Governor Yi Gang said the PBoC was closely watching fluctuations in the foreign exchange market and would seek to keep the yuan at a stable and reasonable level. Protracted weakness in the Chinese currency raises the prospects of capital outflows and a slowdown in China’s economy, creating a new source of concern for currency markets grappling with rising threats to global trade. On Tuesday, the euro and Australian dollar advanced after the Chinese central bank — the People’s Bank of China — moved to calm nervous foreign exchange markets following a fall in the renminbi below a key psychological level. In a statement on the People Bank of China’s website, Governor Yi Gang said the PBoC was closely watching fluctuations in the foreign exchange market and would seek to keep the yuan at a stable and reasonable level. Protracted weakness in the Chinese currency raises the prospects of capital outflows and a slowdown in China’s economy, creating a new source of concern for currency markets grappling with rising threats to global trade.
The PBoC’s comments snapped a 10-day losing streak in the value of the renminbi which has seen it lose nearly 4 percent against a trade-weighted basket and nearly 4.5 percent against the dollar over that period. The weakness sent shock waves through global markets on concerns Beijing may be engineering another devaluation of its currency in a growing trade dispute with the United States.
The U.S. dollar retreated against all of its major counterparts including the euro, pound sterling, Swiss franc, yen and the Canadian and Australian dollars.
|
|
2017 |
2018 |
% Change |
|
|
Dec 29 |
June 29 |
July 6 |
Week |
2018 |
| U.S. $ per currency |
|
|
|
|
|
|
| Australia |
A$ |
0.779 |
0.740 |
0.743 |
0.4% |
-4.7% |
| New Zealand |
NZ$ |
0.709 |
0.677 |
0.684 |
0.9% |
-3.5% |
| Canada |
C$ |
0.796 |
0.761 |
0.763 |
0.3% |
-4.1% |
| Eurozone |
euro (€) |
1.194 |
1.168 |
1.175 |
0.6% |
-1.7% |
| UK |
pound sterling (£) |
1.344 |
1.319 |
1.327 |
0.6% |
-1.3% |
|
|
|
|
|
|
|
| Currency per U.S. $ |
|
|
|
|
|
|
| China |
yuan |
6.534 |
6.621 |
6.643 |
-0.3% |
-1.6% |
| Hong Kong |
HK$* |
7.816 |
7.846 |
7.848 |
0.0% |
-0.4% |
| India |
rupee |
64.081 |
68.470 |
68.878 |
-0.6% |
-7.0% |
| Japan |
yen |
112.850 |
110.740 |
110.420 |
0.3% |
2.2% |
| Malaysia |
ringgit |
4.067 |
4.039 |
4.040 |
0.0% |
0.7% |
| Singapore |
Singapore $ |
1.338 |
1.363 |
1.358 |
0.4% |
-1.5% |
| South Korea |
won |
1070.630 |
1114.670 |
1115.860 |
-0.1% |
-4.1% |
| Taiwan |
Taiwan $ |
29.775 |
30.475 |
30.492 |
-0.1% |
-2.4% |
| Thailand |
baht |
32.696 |
33.016 |
33.149 |
-0.4% |
-1.4% |
| Switzerland |
Swiss franc |
0.979 |
0.9918 |
0.990 |
0.2% |
-1.2% |
| *Pegged to U.S. dollar |
|
|
|
|
|
|
| Source: Bloomberg |
|
|
|
|
|
|
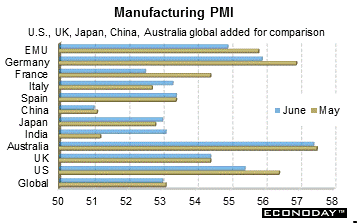 June manufacturing PMI expanded at 54.9, 0.6 points below its final mark in May. This was its weakest performance in 18 months and its sixth straight decline. Growth of output and new orders cooled further, touching their lowest rates since November 2016 and August 2016 respectively. At the same time, backlogs posted their least significant gain in 22 months. Of note, export orders have eased markedly and the survey also found exporters are becoming increasingly concerned about the potential impact of tariffs and other trade restrictions. Employment had another good month as the rate of job creation actually rose slightly, but business optimism declined to its softest level in over two-and-a-half years. Inflation developments were mixed. Regionally in terms of national PMIs, the best performer was the Netherlands (60.1) ahead of Austria (56.6) and Ireland (56.6). Germany (55.9) was not far behind but then there is clear water down to Greece (53.5), Spain (53.4), Italy (53.3) and France (52.5). Added for comparison in the graph are the US, India, Japan, China, Australia and the global PMIs. June manufacturing PMI expanded at 54.9, 0.6 points below its final mark in May. This was its weakest performance in 18 months and its sixth straight decline. Growth of output and new orders cooled further, touching their lowest rates since November 2016 and August 2016 respectively. At the same time, backlogs posted their least significant gain in 22 months. Of note, export orders have eased markedly and the survey also found exporters are becoming increasingly concerned about the potential impact of tariffs and other trade restrictions. Employment had another good month as the rate of job creation actually rose slightly, but business optimism declined to its softest level in over two-and-a-half years. Inflation developments were mixed. Regionally in terms of national PMIs, the best performer was the Netherlands (60.1) ahead of Austria (56.6) and Ireland (56.6). Germany (55.9) was not far behind but then there is clear water down to Greece (53.5), Spain (53.4), Italy (53.3) and France (52.5). Added for comparison in the graph are the US, India, Japan, China, Australia and the global PMIs.
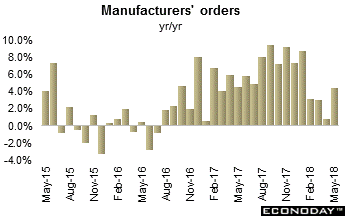 May manufacturing orders rebounded 2.6 percent following a smaller revised 1.6 percent monthly decline in April — their best performance so far in 2018 but also their first increase since December. Annual growth was 4.4 percent, up from 0.8 percent last time and a 4-month high. May's upturn was built upon a 4.9 percent monthly spurt in consumer goods and a 4.7 percent jump in capital goods. However, basics slipped 0.6 percent. Domestic demand, which expanded 4.3 percent, accounted for most of the overall monthly gain as foreign orders were up a more modest 1.6 percent. However, at 5.0 percent, down from a recent peak of 13.0 percent in December, annual overseas growth was still well above its domestic counterpart (3.5 percent). May manufacturing orders rebounded 2.6 percent following a smaller revised 1.6 percent monthly decline in April — their best performance so far in 2018 but also their first increase since December. Annual growth was 4.4 percent, up from 0.8 percent last time and a 4-month high. May's upturn was built upon a 4.9 percent monthly spurt in consumer goods and a 4.7 percent jump in capital goods. However, basics slipped 0.6 percent. Domestic demand, which expanded 4.3 percent, accounted for most of the overall monthly gain as foreign orders were up a more modest 1.6 percent. However, at 5.0 percent, down from a recent peak of 13.0 percent in December, annual overseas growth was still well above its domestic counterpart (3.5 percent).
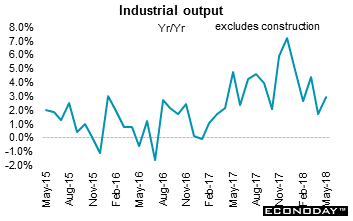 May industrial production rebounded a monthly 2.6 percent following a slightly steeper revised 1.3 percent monthly drop in April. Annual growth climbed from 1.4 percent to 3.1 percent. The mid-quarter recovery was broad-based and led by consumer goods where output was up 6.5 percent on the month after a 2.0 percent drop last time. Basics (3.0 percent) were similarly very firm and capital goods (0.9 percent) also made decent ground. Among the more volatile categories, energy was up 0.8 percent while construction jumped 3.1 percent. Excluding construction, output was up a monthly 2.5 percent and up 3.0 percent on the year. May industrial production rebounded a monthly 2.6 percent following a slightly steeper revised 1.3 percent monthly drop in April. Annual growth climbed from 1.4 percent to 3.1 percent. The mid-quarter recovery was broad-based and led by consumer goods where output was up 6.5 percent on the month after a 2.0 percent drop last time. Basics (3.0 percent) were similarly very firm and capital goods (0.9 percent) also made decent ground. Among the more volatile categories, energy was up 0.8 percent while construction jumped 3.1 percent. Excluding construction, output was up a monthly 2.5 percent and up 3.0 percent on the year.
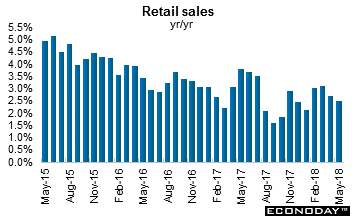 May retail sales were up 0.4 percent from a month ago and gained 2.5 percent on the year. Four of the six major spending categories advanced. Food retailing, the largest category, rose 0.3 percent on the month, while sales for household goods retailing, the second largest category, advanced 0.1 percent. Sales also increased by 2.2 percent for clothing, footwear and accessory retailing and by 3.9 percent for department stores. This was offset by monthly declines in sales for cafes, restaurants and takeaway food services and "other" retailing. Sales advanced on the month in six of the eight Australian states and territories. May retail sales were up 0.4 percent from a month ago and gained 2.5 percent on the year. Four of the six major spending categories advanced. Food retailing, the largest category, rose 0.3 percent on the month, while sales for household goods retailing, the second largest category, advanced 0.1 percent. Sales also increased by 2.2 percent for clothing, footwear and accessory retailing and by 3.9 percent for department stores. This was offset by monthly declines in sales for cafes, restaurants and takeaway food services and "other" retailing. Sales advanced on the month in six of the eight Australian states and territories.
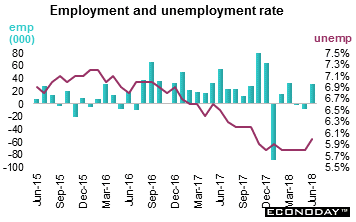 After two consecutive months of little change, June employment was up 32,000. With more people searching for work, the unemployment rate increased 0.2 percentage points to 6.0 percent. Compared with June 2017, employment increased by 215,000 or 1.2 percent, with all the growth in full-time work. Over the same period, total hours worked grew by 1.4 percent. Employment increased in Ontario, Saskatchewan, and Manitoba. There was little change in the other provinces. More people were employed in construction, natural resources and manufacturing. At the same time, employment declined in accommodation and food services and in agriculture. There was little change in the number of employees in both the private and public sectors, as well as in self-employment. After two consecutive months of little change, June employment was up 32,000. With more people searching for work, the unemployment rate increased 0.2 percentage points to 6.0 percent. Compared with June 2017, employment increased by 215,000 or 1.2 percent, with all the growth in full-time work. Over the same period, total hours worked grew by 1.4 percent. Employment increased in Ontario, Saskatchewan, and Manitoba. There was little change in the other provinces. More people were employed in construction, natural resources and manufacturing. At the same time, employment declined in accommodation and food services and in agriculture. There was little change in the number of employees in both the private and public sectors, as well as in self-employment.
Most equity indexes declined last week as investors were cautious prior to the expected tariff announcement on Friday. In addition to the minutes of the last Federal Reserve meeting, the important employment report was released. Overall, it was a relatively good week for economic data with most of the important releases gaining. As expected, the U.S. put tariffs on $34 billion of Chinese imports and the Chinese retaliated. Investors showed their cool and the markets behaved Friday. But what about going forward? Will there be another round?
Political meetings dominate the upcoming week. Investors will monitor closely the NATO meeting that will be held on July 11 and 12 in Brussels, Belgium and U.S. President Trump’s meeting with Russian President Vladimir Putin on July 16 in Helsinki, Finland. The President will be in the UK from July 12 to July 15. In economic data, May industrial production data dominate the week with releases in the United States, India, France, Italy and the UK. The Bank of Canada meets and is expected to increase its policy interest rate by 25 basis points to 1.5 percent.
| Central Bank activities |
|
| July 11 |
Canada |
Bank of Canada Monetary Policy Announcement |
| |
|
|
| The following indicators will be released this week... |
| Europe |
|
|
| July 9 |
Germany |
Merchandise Trade (May) |
| July 10 |
Germany |
ZEW Survey (July) |
|
France |
Industrial Production (May) |
|
Italy |
Industrial Production (May) |
|
UK |
Industrial Production (May) |
|
|
Merchandise Trade (May) |
| July 12 |
Eurozone |
Industrial Production (May) |
| |
|
|
| Asia Pacific |
|
|
| July 10 |
China |
Consumer Price Index (June) |
|
|
Producer Price Index (June) |
| July 11 |
Japan |
Producer Price Index (June) |
|
|
Private Machine Orders (May) |
| July 12 |
India |
Consumer Price Index (June) |
|
|
Industrial Production (May) |
| July 13 |
China |
Merchandise Trade (June) |
Anne D Picker is the author of International Economic Indicators and Central Banks.
|
