A striking feature of this past week was the decline in commodity prices, most notably gold and crude oil. The declines were attributed to an easing of risk factors that had bedeviled investors. Softening demand has increased U.S. gasoline and heating oil inventories and at the same time, lowered prices. The U.S. Energy Department reported that inventories of natural gas were also up. The Organization of Petroleum Exporting Countries (OPEC) cut its forecast for fourth quarter demand citing slower growth in the world's largest economies. OPEC members provide about 40 percent of the world's oil. The organization also reduced demand forecasts for the current quarter and for 2007.
Prices of oil have fallen about 20 percent from a record $78.40 a barrel of crude on July 14th as tensions in the Middle East eased. Prices climb at any sign of possible disruption to oil production and delivery. The cease fire in Lebanon is proceeding apace while worries that shipments from Iran might be disrupted because of the ongoing nuclear standoff appear to have eased as well.
Since July 14th gold prices are down about 14 percent and since May, when the metal hit a 26-year-high of $730 a troy ounce, they're down 20 percent. Aside from the unwinding of the risk premium, weaker jewelry demand particularly in India, Turkey and Saudi Arabia has also hurt prices. But optimists still think that gold will climb above the $700 level by year's end primarily because of U.S. economic weakness. This would reduce the appeal of U.S. assets while improving the appeal of gold.
Until recently, central banks were selling off their gold stashes at a brisk pace. But sales dropped by 60 percent in the first half of 2006 compared with first half 2005. A 500 tonnes annual limit on gold sales was agreed to by signatories to the Central Bank Gold Agreement, but the Banks had sold just 337 tonnes by the end of August and it is doubtful that the remaining permissible sales could be completed by September 26th year end.

Though most equities gained on the relaxation of price pressures, those of commodity producers were sold on lower profit expectations. On the week, stocks were down in commodity producing countries such as Australia and Canada.
Global Stock Market Recap

Europe and the UK
The CAC and DAX were up last week despite their volatile performance. The FTSE, however, barely broke even (it was down 2.3 points on the week). Aside from its quarterly restructuring the FTSE was pressured by ex-dividend trading as well as lower stock prices for energy companies such as BP and Shell. On Friday, European equities celebrated a relatively benign U.S. consumer price index report. Investors think the report will ease pressure on the FOMC Wednesday to resume interest rate increases.

Asia/Pacific
Stocks were down in Japan and Australia for the second week. Declining energy and mining stocks such as BHP Billiton and Sumitomo Metal Mining and other resources stocks were down on concerns that lower copper, gold and crude oil prices would have a negative impact on profits. In Japan, exporters such as Sony were down after U.S. import prices were up more than expected, reviving concern the Federal Reserve would raise borrowing costs. The U.S. CPI was released after markets in this part of the world were closed for the week. For the week the Nikkei was down 1.3 percent while the Topix dropped 1.6 percent. Both indexes had the biggest weekly decline since the five trading days ended July 14th due to a string of weaker-than-expected economic reports.

Currencies
The yen approached a seven-week low against the dollar as the week ended. Investors think the Group of Seven meeting September 16th in Singapore will not focus on the currency's latest weakness. After reaching a high of ¥109.75 to the dollar, it recently touched an intra-day low of ¥118.15 during trading on September 12th. Traders don't think there will be anything in the communique addressing currency issues or the strength of the Asian currencies. But they are not discounting events such as U.S. Treasury Secretary Henry Paulson's visit to Beijing after the G-7 meeting concludes. The yen has been hovering just shy of the ¥150 per euro.

Until Friday, the euro had been trading within a narrow range before it was pressured lower by comments from French Finance Minister Thierry Breton who is in Singapore for the G-7 and IMF meetings. He said simply that inflation in Europe is contained. Breton, along with other European finance ministers who want to keep EMU's exports competitive, does not want the euro to appreciate in value and thereby hurt the competitiveness of EMU exports. And although unsaid, that means the European Central Bank should not increase interest rates further. There has been something of a feud between the political side of the EU and the ECB. The political side would like more input (i.e. control) over the Bank and its policies. Thus far ECB President Jean Claude Trichet has fended off the political rhetoric.

Indicator scoreboard
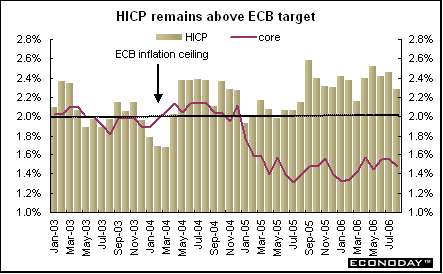
EMU - July seasonally adjusted merchandise trade deficit was €6.4 billion, considerably worse than June's deficit of €1.8 billion. Seasonally adjusted imports were up 1.8 percent while exports were down 2.2 percent. On an unadjusted basis, the trade balance showed a surplus of €1.5 billion, virtually unchanged from the previous month. Unadjusted imports and exports were down by the same 3.7 percent.

August harmonized index of consumer prices was up 0.1 percent and 2.3 percent when compared with last year. This was a slight improvement from July's reading of 2.4 percent on the year. HICP excluding energy was also up 0.1 percent on the month but 1.7 percent on the year. When food, alcohol, tobacco and energy are excluded, the HICP was up 0.1 percent and 1.3 percent on the year.
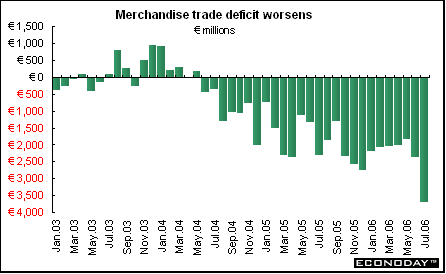
France - July seasonally adjusted merchandise trade deficit burgeoned to €3.7 billion from €2.4 billion in June. Exports were down 3 percent. Exports of cell phones and semi-finished goods such as metal products, pharmaceuticals and farm goods were down. Imports were up 1 percent. The increase came in part from the purchase of a Boeing airplane along with a luxury yacht.
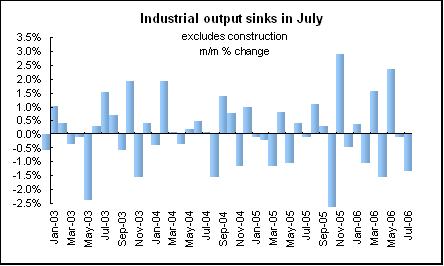
July seasonally adjusted industrial output was down 1.3 percent but up 1.3 percent when compared with last year. Both energy output and agricultural production were down. Manufacturing output was down 1.5 percent but up 1.4 percent on the year. All manufacturing sectors were down including semi-finished goods and auto. Autos were down 1.4 percent on the month and are down 8.8 percent on the year.
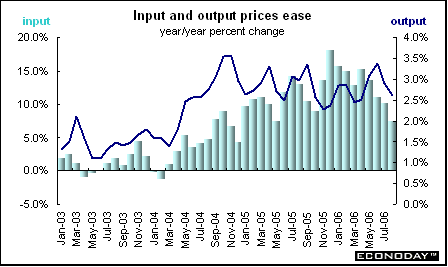
Britain - August producer output prices were down 1.2 percent but were up 2.6 percent when compared with last year. Cheaper oil and food products contributed to the decline. Excluding food, beverages, tobacco and petroleum, the output index was down 0.2 percent and up 2.1 percent on the year. Producer input prices were down 1.2 percent but up 7.6 percent on the year. Input prices excluding food, beverages, tobacco and petroleum were down 0.4 percent but up 7.4 percent on the year. Imported parts and equipment contributed to the reduction in input prices, with office machinery and computer prices falling 6.9 percent on the month and motor vehicles down 1.6 percent.
July total merchandise trade deficit was £3.9 billion, virtually unchanged from June. The deficit on goods only was virtually unchanged at £6.3 billion. The services surplus was £2.6 billion. The goods deficit with the European Union shrank from £3 billion in June to £2.1 billon in July as exports benefited from stronger European growth. However, exports to the rest of the world dropped by nearly 15 percent while imports were down by 4.2 percent. The deficit with non-EU countries was £4.3 billion, the biggest gap on record.

August consumer price index was up 0.4 percent and 2.5 percent when compared with last year. Most categories were higher including those for toys, games & hobbies as well as furniture & household goods. Core CPI which excludes food, energy, alcoholic beverages and tobacco was up 0.4 percent on the month and 1.2 percent on the year.

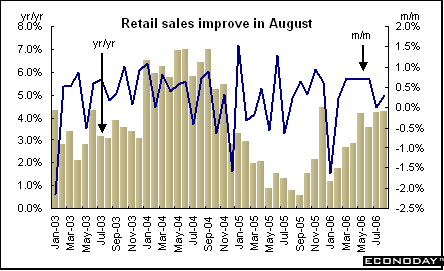
August retail sales were up 0.3 percent and 4.3 percent when compared with last year. The 1.7 percent decline in food store sales was partly offset by a 1.2 percent increase in nonfood sales. On the year, food sales were up 3.2 percent while nonfood stores were up 4.7 percent. Household goods sales were up 3.3 percent and 7.5 percent on the year. Non-store sales were up a healthy 6.3 percent on the month and 8 percent on the year.
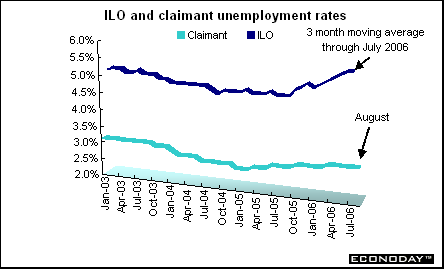
August claimant count unemployment was down by 3,900. The claimant count unemployment rate was 3 percent, unchanged for the fifth month. The International Labour Organisation unemployment rate for the three months to July was up 94,000 with an unemployment rate of 5.5 percent, unchanged from the previous three months. Overall employment was up by 38,000 jobs. Currently, 74.6 percent of the workforce is employed.
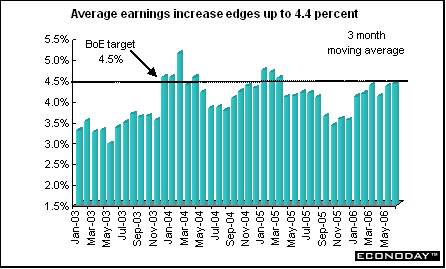
Average earnings for the three months to August were up 4.4 percent, slightly higher than the 4.3 percent gain for the previous three months. The main reason for increase was due to public sector earnings which were up 3.8 percent from 3.4 percent in the previous month. Private average earnings were up 4.6 percent.
Asia
Japan - Second quarter revised gross domestic product was up 0.2 percent, virtually unchanged from the preliminary release. When compared with the same quarter a year ago, GDP was up 2.5 percent. On an annualized rate GDP was up 1 percent. Domestic demand contributed to growth with a 0.5 percent increase in private consumption on the quarter. Private non-residential investment was up 3.7 percent on the quarter. However public sector investment dropped 6.3 percent. The GDP deflator dropped 0.8 percent on the year. Beginning in the third quarter, breakdowns of consumer spending will include purchases of services, durables and non-durables.

August corporate goods price index was up 0.2 percent and 3.4 percent when compared with last year. This was the fastest pace in 25 years.

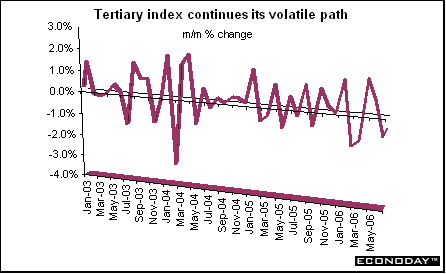
July tertiary industry index of service activity was down 0.2 percent but was up 2.1 percent when compared with July a year earlier. Information and communication services, wholesale and retail trade, financial and insurance, utility, supplemental education, comprehensive services, transportation, restaurants and hotels sectors were all down on the month. Only general services, medical & health care and real estate scored gains.
Americas
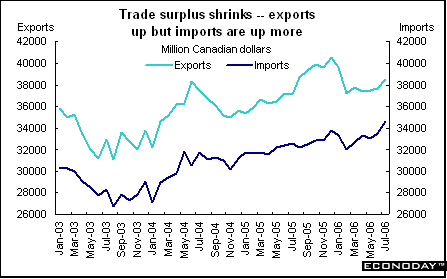
Canada - July merchandise trade surplus was down to C$3.9 billion from C$4.1 billion in June. Imports were up 3.1 percent while exports were up 2.1 percent. Automotive imports climbed to 1 percent while auto exports were down 7.2 percent. The decline is attributed to a significant drop in U.S. sales. Canada's trade surplus with the U.S. narrowed to C$7.9 billion from C$8.0 billion in the previous month.
July factory shipments were up 0.8 percent and 3.1 percent when compared with last year. However, if price increases were taken into account, the overall volume of shipments actually declined 0.6 percent. Shipments increased in 11 of 21 manufacturing industries in July. Durable goods shipments fell only slightly, as decreases in the aerospace and auto parts industries were not completely offset by increases in the automotive, machinery and computer & electronics industries. July's gain was almost entirely attributed to the strong performance in the petroleum sector where shipments rose to their highest level on record. Excluding petroleum and coal products, manufacturing shipments would have fallen 0.2 percent. Unfilled orders were up 2.1 percent and 4.2 percent on the year. New orders were up 2.2 percent and 3.6 percent on the year. Factory shipments make up about 40 percent of Canada's gross domestic product.

Bottom line
Last week, U.S. and British indicators dominated the news. Both countries released inflation, retail sales and international trade data. And in Britain, key monthly labor force data were also made available. And in the currency markets, traders positioned themselves prior to the Group of Seven meeting.
The G-7 finance ministers and central bankers meet Saturday in Singapore (It is Friday as I write). After the G-7's last meeting, which was held in Washington, the yen jumped by 1.7 percent, the biggest one-day rally so far this year. The group which comprises the U.S., Japan, Germany, France, the UK, Italy and Canada called for Asian currencies to appreciate. The G-7 gathering is followed by the annual meeting of the International Monetary Fund (also being held in Singapore) and by U.S. Treasury Secretary Henry Paulson's first official visit to China. Also coming up this week is the Federal Open Market Committee meeting on Wednesday. Market players have virtually discounted any further Fed rate increases for the remainder of the year.

