|
Most global equity indexes retreated on the week. Investors closely monitored the ongoing developments as the US Congress worked to put together a tax reduction bill with increasing unease. Investors were concerned about the outlook for U.S. tax reform at the end of the trading week after Senate Republicans released their version of a tax bill.
The Senate bill includes some significant differences from the House of Representative's version, including a delay in the cut in the corporate tax rate. Republican senators said they want to slash the corporate tax rate in 2019, later than the House's proposed schedule of 2018. The House was set to vote on its measure next week. But the Senate's timetable was less clear, with a formal bill yet to be drafted in that chamber, where Republicans have a much smaller majority and a narrower path to approval for any legislation, let alone one as contentious as a tax package.
A political crackdown in Saudi Arabia sent crude oil prices to the highest level in more than two years. Hundreds of princes, businessmen and government officials were detained as part of an alleged campaign to stamp out corruption. Crown Prince Mohammed bin Salman who has been consolidating power since being named heir to the throne in June has said that tackling corruption is necessary to overhaul the kingdom's oil-dependent economy.
In the antipodes — Australia and New Zealand — their respective central banks left monetary policies unchanged.
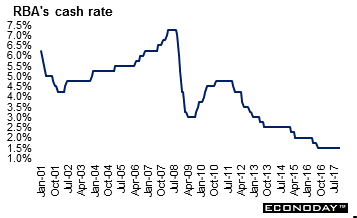 As expected, the Reserve Bank of Australia again left its main policy rate unchanged at 1.50 percent where it has been since August 2016. The accompanying statement again pointed to improving global conditions but warned of medium-term risks to the Chinese growth outlook. Domestically, the RBA's forecasts were little changed, with economic growth expected to pick up from current levels and to average around 3 percent over the next few years. Ongoing improvements in the labour market are expected to push up wage growth eventually, though concerns remained that high household debt will restrain consumer spending. As expected, the Reserve Bank of Australia again left its main policy rate unchanged at 1.50 percent where it has been since August 2016. The accompanying statement again pointed to improving global conditions but warned of medium-term risks to the Chinese growth outlook. Domestically, the RBA's forecasts were little changed, with economic growth expected to pick up from current levels and to average around 3 percent over the next few years. Ongoing improvements in the labour market are expected to push up wage growth eventually, though concerns remained that high household debt will restrain consumer spending.
The statement also notes that underlying inflation is likely to remain low "for some time" despite recent increases in tobacco and electricity prices. The RBA continues to forecast that inflation will pick up only gradually. It again warned that recent appreciation in the domestic currency (Australian dollar) could further dampen price pressures. Although underlying inflation is expected to remain below the Banks inflation target range of 2.0 percent to 3.0 percent, the reserve bank board appeared relatively confident that economic growth is set to strengthen. This suggests that there is little urgency to adjust policy rates in either direction. Policy stability seen over the last year is expected to extend for at least a few more months.
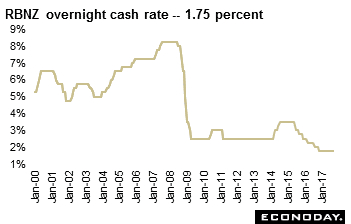 The Reserve Bank of New Zealand left its policy rate — the overnight cash rate (OCR) — unchanged at 1.75 percent as anticipated. The OCR has been at this rate since November 2016. In his statement, Acting Reserve Bank Governor Grant Spencer repeated the Bank's assurance that policy will remain accommodative "for a considerable period", suggesting that the stability in the OCR seen over the last twelve months is set to continue in the months ahead. The Reserve Bank of New Zealand left its policy rate — the overnight cash rate (OCR) — unchanged at 1.75 percent as anticipated. The OCR has been at this rate since November 2016. In his statement, Acting Reserve Bank Governor Grant Spencer repeated the Bank's assurance that policy will remain accommodative "for a considerable period", suggesting that the stability in the OCR seen over the last twelve months is set to continue in the months ahead.
The statement accompanying the decision pointed to continued improvement in global economic conditions. It also said that the domestic currency (New Zealand dollar) has depreciated in the last few months. If sustained, the RBNZ expects that it will put upward pressure on inflation and help promote better balanced growth in the domestic economy. Spencer expects growth to strengthen over the forecast period, reflecting the accommodative monetary policy and the prospect of increased fiscal stimulus after the establishment last month of a new government led by the Labour Party. Bank officials discussed the impact of various policies proposed by the new government but noted that their impact for now remains very uncertain.
In the medium-term, however, there remains some uncertainty about the framework for monetary policy. The new government agreed to renew the existing policy targets agreement with the RBNZ, directing officials to continue targeting inflation within the 1.0 percent to 3.0 percent range. This agreement, however, expires in March 2018 when the Acting Governor of the RBNZ, Grant Spencer, steps down. Ahead of the recent election, the Labour Party proposed adding an employment objective to the RBNZ's mandate, while its coalition partner, the New Zealand First Party, advocated an exchange rate target. The new Finance Minister, Grant Robertson, has announced a review of the RBNZ's mandate but also indicated that an exchange rate target is not being considered.
| |
|
2016 |
2017 |
% Change |
|
Index |
Dec 31 |
Nov 3 |
Nov 10 |
Week |
2017 |
| Asia/Pacific |
|
|
|
|
|
|
| Australia |
All Ordinaries |
5719.1 |
6030.3 |
6104.27 |
1.2% |
6.7% |
| Japan |
Nikkei 225 |
19114.4 |
22539.1 |
22681.42 |
0.6% |
18.7% |
|
Topix |
1518.61 |
1794.08 |
1800.44 |
0.4% |
18.6% |
| Hong Kong |
Hang Seng |
22000.6 |
28603.6 |
29120.92 |
1.8% |
32.4% |
| S. Korea |
Kospi |
2026.5 |
2558.0 |
2542.95 |
-0.6% |
25.5% |
| Singapore |
STI |
2880.8 |
3382.3 |
3420.10 |
1.1% |
18.7% |
| China |
Shanghai Composite |
3103.6 |
3371.7 |
3432.67 |
1.8% |
10.6% |
|
|
|
|
|
|
|
| India |
Sensex 30 |
26626.5 |
33685.56 |
33314.56 |
-1.1% |
25.1% |
| Indonesia |
Jakarta Composite |
5296.7 |
6039.5 |
6021.83 |
-0.3% |
13.7% |
| Malaysia |
KLCI |
1641.7 |
1740.9 |
1742.28 |
0.1% |
6.1% |
| Philippines |
PSEi |
6840.6 |
8376.1 |
8433.48 |
0.7% |
23.3% |
| Taiwan |
Taiex |
9253.5 |
10800.8 |
10732.67 |
-0.6% |
16.0% |
| Thailand |
SET |
1542.9 |
1701.5 |
1689.28 |
-0.7% |
9.5% |
|
|
|
|
|
|
|
| Europe |
|
|
|
|
|
|
| UK |
FTSE 100 |
7142.8 |
7560.4 |
7433.0 |
-1.7% |
4.1% |
| France |
CAC |
4862.3 |
5518.0 |
5380.7 |
-2.5% |
10.7% |
| Germany |
XETRA DAX |
11481.1 |
13478.9 |
13127.5 |
-2.6% |
14.3% |
| Italy |
FTSE MIB |
19234.6 |
23014.1 |
22560.8 |
-2.0% |
17.3% |
| Spain |
IBEX 35 |
9352.1 |
10357.8 |
10092.7 |
-2.6% |
7.9% |
| Sweden |
OMX Stockholm 30 |
1517.2 |
1677.7 |
1634.7 |
-2.6% |
7.7% |
| Switzerland |
SMI |
8219.9 |
9322.1 |
9134.2 |
-2.0% |
11.1% |
|
|
|
|
|
|
|
| North America |
|
|
|
|
|
|
| United States |
Dow |
19762.6 |
23539.19 |
23422.2 |
-0.5% |
18.5% |
|
NASDAQ |
5383.1 |
6764.4 |
6750.9 |
-0.2% |
25.4% |
|
S&P 500 |
2238.8 |
2587.8 |
2582.3 |
-0.2% |
15.3% |
| Canada |
S&P/TSX Comp. |
15287.6 |
16020.2 |
16039.3 |
0.1% |
4.9% |
| Mexico |
Bolsa |
45642.9 |
48534.8 |
48028.3 |
-1.0% |
5.2% |
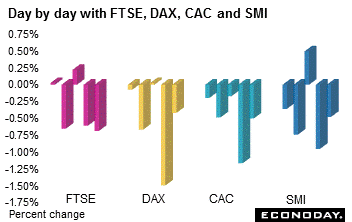 Equities tumbled last week as investors continued to monitor the tensions in the Middle East, but were more concerned about the outlook for U.S. tax reform after the Senate released their version of a tax bill. On the week, the FTSE lost 1.7 percent, the CAC dropped 2.5 percent, the DAX lost 2.6 percent and the SMI retreated 2.0 percent. The FTSE declined three of five days while the DAX and SMI were down two days and the CAC dropped five days. Equities tumbled last week as investors continued to monitor the tensions in the Middle East, but were more concerned about the outlook for U.S. tax reform after the Senate released their version of a tax bill. On the week, the FTSE lost 1.7 percent, the CAC dropped 2.5 percent, the DAX lost 2.6 percent and the SMI retreated 2.0 percent. The FTSE declined three of five days while the DAX and SMI were down two days and the CAC dropped five days.
European Central Bank President Mario Draghi said in a speech at the second ECB Forum on Banking Supervision in Frankfurt that most of the financial stability issues that were linked to low interest rates did not materialize and there is hardly any evidence that negative rates are hurting Eurozone banks' profitability. "At the euro area level, we currently see no signs of credit-fueled housing bubbles, which are at the root of most serious financial crises," Draghi said.
According to the European Commission's Autumn Forecast, the Eurozone will grow the fastest in a decade this year thanks to resilient private consumption, stronger global growth and falling unemployment. The euro area growth forecast for this year has been increased to 2.2 percent from 1.7 percent while the EU growth forecast was lifted to 2.3 percent from 1.9 percent. Euro area growth surpassed expectations according to the commission. The economies of all Eurozone Member States are expanding and their labor markets improving. But challenges remain in the form of high debt levels and subdued wage increases.
In the euro area, retail sales advanced along with producer prices. Data were mixed for Germany with manufacturers' orders advancing and the merchandise trade surplus widening. However, industrial production retreated. In the UK, industrial production increased more than anticipated while the merchandise trade deficit narrowed.
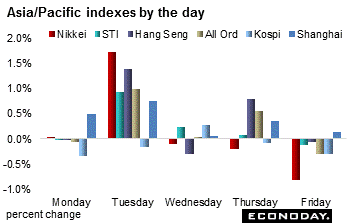 Equities ended the week on a negative note as uncertainty about U.S. tax reform plans dented investor sentiment and boosted demand for safe-haven assets such as gold and the Japanese yen. However, most indexes advanced for the week. Gains ranged from 0.1 percent ((KLCI) to 1.8 percent (Shanghai Composite and Hang Seng). Losses ranged from 0.3 percent (Jakarta Composite) to 1.1 percent (Sensex). Equities ended the week on a negative note as uncertainty about U.S. tax reform plans dented investor sentiment and boosted demand for safe-haven assets such as gold and the Japanese yen. However, most indexes advanced for the week. Gains ranged from 0.1 percent ((KLCI) to 1.8 percent (Shanghai Composite and Hang Seng). Losses ranged from 0.3 percent (Jakarta Composite) to 1.1 percent (Sensex).
The Shanghai Composite extended its rally Friday to close at a 27-month high, encouraged by Beijing's move to lift foreign ownership limits on financial firms and defying a wider global selloff in equities. The Chinese government said it will raise foreign ownership limits in domestic financial firms, a long-anticipated step that grants greater access to overseas investors in China's financial services market.
Foreign investors jumped into the Japanese stock market at the fastest rate on record in October as they looked to share a piece of a rapid rally in the run-up to and aftermath of Shinzo Abe's election victory. Ministry of Finance data indicated that foreign investors bought a net ¥3.43 trillion of Japanese equities over the month, the largest monthly inward investment since the current data series began in 2005.
The flows helped feed a rally that included 16 straight days of gains for the Nikkei — its longest winning streak on record. Investors welcomed Mr Abe's resounding election victory as a sign that monetary and fiscal stimulus is likely to continue. That should put further downward pressure on the yen, which is generally good news for corporate earnings in the export-driven economy.
For the record, the Nikkei hit its all-time high on December 29, 1989 during the peak of the Japanese asset price bubble, when it reached an intra-day high of 38,957.44, before closing at 38,915.87, having grown six fold during the decade. Subsequently, it lost nearly all these gains, closing at 7,054.98 on March 10, 2009 — 81.9 percent below its peak twenty years earlier.
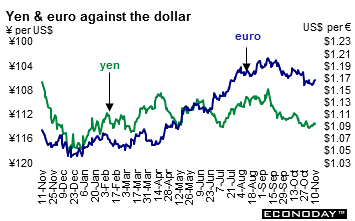 The U.S. dollar rally stalled last week. The currency was down against all of its major counterparts including the yen, euro, pound sterling, Swiss franc and the Canadian and Australian dollars. The decline was blamed on the uncertainties surrounding U.S. tax reform combined with the improving economic outlook for the Eurozone. With little to distract from economic data and earnings, traders worried that the U.S. tax legislation would be postponed for another year. Also looming on the horizon but has not yet gotten much attention is yet another debt limit increase and government funding deadline on December 15. If the current government funding expires without new spending approval, the government would partially shut down. The U.S. dollar rally stalled last week. The currency was down against all of its major counterparts including the yen, euro, pound sterling, Swiss franc and the Canadian and Australian dollars. The decline was blamed on the uncertainties surrounding U.S. tax reform combined with the improving economic outlook for the Eurozone. With little to distract from economic data and earnings, traders worried that the U.S. tax legislation would be postponed for another year. Also looming on the horizon but has not yet gotten much attention is yet another debt limit increase and government funding deadline on December 15. If the current government funding expires without new spending approval, the government would partially shut down.
Sterling closed the week on firmer ground, climbing about 0.5 percent against the dollar on Friday as better-than-expected data on industrial output and rising confidence in the progress of Brexit talks supported the currency. Brexit negotiations aimed at unravelling over four decades of union restarted this week, promising more clarity about the shape of a future divorce deal and easing some of the political uncertainty that has pressured the pound. Strong data on trade and industrial output on Friday also provided a welcome boost for the pound.
|
|
2016 |
2017 |
% Change |
|
|
Dec 30 |
Nov 3 |
Nov 10 |
Week |
2017 |
| U.S. $ per currency |
|
|
|
|
|
|
| Australia |
A$ |
0.7215 |
0.765 |
0.766 |
0.2% |
6.2% |
| New Zealand |
NZ$ |
0.6948 |
0.691 |
0.693 |
0.3% |
-0.2% |
| Canada |
C$ |
0.7443 |
0.784 |
0.789 |
0.7% |
6.0% |
| Eurozone |
euro (€) |
1.0534 |
1.161 |
1.167 |
0.5% |
10.7% |
| UK |
pound sterling (£) |
1.2333 |
1.308 |
1.320 |
0.9% |
7.0% |
|
|
|
|
|
|
|
| Currency per U.S. $ |
|
|
|
|
|
|
| China |
yuan |
6.9450 |
6.639 |
6.641 |
0.0% |
4.6% |
| Hong Kong |
HK$* |
7.7533 |
7.802 |
7.801 |
0.0% |
-0.6% |
| India |
rupee |
67.9238 |
64.548 |
65.166 |
-0.9% |
4.2% |
| Japan |
yen |
116.8100 |
114.090 |
113.540 |
0.5% |
2.9% |
| Malaysia |
ringgit |
4.4862 |
4.237 |
4.192 |
1.1% |
7.0% |
| Singapore |
Singapore $ |
1.4465 |
1.364 |
1.360 |
0.3% |
6.3% |
| South Korea |
won |
1205.8300 |
1113.790 |
1116.990 |
-0.3% |
8.0% |
| Taiwan |
Taiwan $ |
32.3260 |
30.199 |
30.172 |
0.1% |
7.1% |
| Thailand |
baht |
35.8100 |
33.168 |
33.127 |
0.1% |
8.1% |
| Switzerland |
Swiss franc |
1.0174 |
1.0009 |
0.996 |
0.5% |
2.2% |
| *Pegged to U.S. dollar |
|
|
|
|
|
|
| Source: Bloomberg |
|
|
|
|
|
|
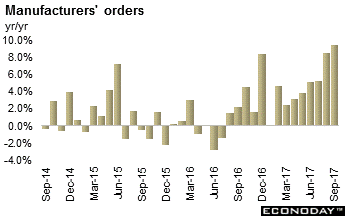 September manufacturers' orders were up 1.0 percent on the month after a sharper revised 4.1 percent jump in August. This means that new business has increased in four of the last five months and annual growth now stands at 9.5 percent. However, the domestic market was slightly softer, slipping a monthly 0.1 percent as declines in basics (5.0 percent) and consumer & durable goods (2.6 percent) just more than offset a rebound in capital goods (5.2 percent). By contrast, overseas demand expanded 1.7 percent as stronger capital goods (4.7 percent) proved enough to offset declines in basics (2.9 percent) and consumer & durables goods (3.1 percent). September manufacturers' orders were up 1.0 percent on the month after a sharper revised 4.1 percent jump in August. This means that new business has increased in four of the last five months and annual growth now stands at 9.5 percent. However, the domestic market was slightly softer, slipping a monthly 0.1 percent as declines in basics (5.0 percent) and consumer & durable goods (2.6 percent) just more than offset a rebound in capital goods (5.2 percent). By contrast, overseas demand expanded 1.7 percent as stronger capital goods (4.7 percent) proved enough to offset declines in basics (2.9 percent) and consumer & durables goods (3.1 percent).
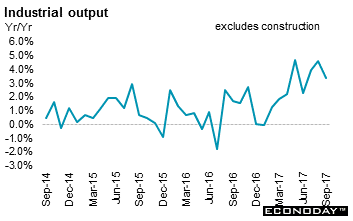 September industrial output dropped a monthly 1.6 percent following an unrevised 2.6 percent monthly surge in August. The reversal reduced annual production growth from 4.5 percent to 3.5 percent, a 3-month low. . Excluding construction, output was down a monthly 1.8 percent after a gain of 3.0 percent. On the year, excluding construction, output was up 3.4 percent after jumping 4.6 percent in August. Outside of construction (0.4 percent) all of the major subsectors posted monthly losses. The worst performer was energy (down 4.3 percent) ahead of capital goods (down 2.7 percent) and intermediates (down 0.8 percent). Consumer goods were down 0.3 percent while overall manufacturing matched the headline 1.6 percent decline. September industrial output dropped a monthly 1.6 percent following an unrevised 2.6 percent monthly surge in August. The reversal reduced annual production growth from 4.5 percent to 3.5 percent, a 3-month low. . Excluding construction, output was down a monthly 1.8 percent after a gain of 3.0 percent. On the year, excluding construction, output was up 3.4 percent after jumping 4.6 percent in August. Outside of construction (0.4 percent) all of the major subsectors posted monthly losses. The worst performer was energy (down 4.3 percent) ahead of capital goods (down 2.7 percent) and intermediates (down 0.8 percent). Consumer goods were down 0.3 percent while overall manufacturing matched the headline 1.6 percent decline.
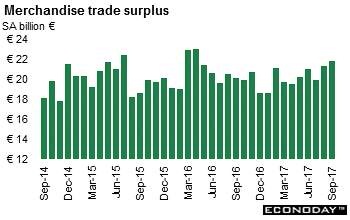 September seasonally adjusted merchandise trade surplus weighed in at €21.8 billion, up from a slightly smaller revised €21.3 billion in August and the most black ink since April last year. Unadjusted, the surplus was €24.1 billion, a small improvement on the €23.7 billion recorded in September 2016. However, the increase in the adjusted headline masked contractions in both sides of the balance sheet. Exports declined 0.4 percent on the month, their first drop since June, while imports declined a sharper 1.0 percent, also their worst performance in three months. Annual growth of the former was 4.6 percent, down from 7.3 percent in August, and of the latter, 5.5 percent after 8.2 percent. The September report makes for a third quarter surplus of €63.0 billion. This is 3.6 percent larger than in the second quarter when total net exports subtracted 0.3 percentage points off quarterly real GDP growth. September seasonally adjusted merchandise trade surplus weighed in at €21.8 billion, up from a slightly smaller revised €21.3 billion in August and the most black ink since April last year. Unadjusted, the surplus was €24.1 billion, a small improvement on the €23.7 billion recorded in September 2016. However, the increase in the adjusted headline masked contractions in both sides of the balance sheet. Exports declined 0.4 percent on the month, their first drop since June, while imports declined a sharper 1.0 percent, also their worst performance in three months. Annual growth of the former was 4.6 percent, down from 7.3 percent in August, and of the latter, 5.5 percent after 8.2 percent. The September report makes for a third quarter surplus of €63.0 billion. This is 3.6 percent larger than in the second quarter when total net exports subtracted 0.3 percentage points off quarterly real GDP growth.
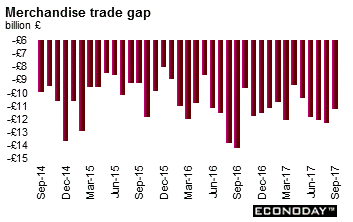 September's global shortfall on goods trade narrowed from a significantly downwardly revised Stg12.35 billion in August to a smaller than expected Stg11.25 billion, a 4-month low. The decline in the red ink reflected a monthly 4.5 percent increase in exports that easily more than offset a 0.4 percent rise in imports. Annual growth of the former now stands at 18.1 percent or more than four times the 4.0 percent posted by imports. However, over the third quarter, exports were still 0.9 percent below their level in April to June while imports advanced 2.7 percent. The underlying trade deficit, which excludes oil and other erratic items, recorded only a modest reduction, narrowing from Stg12.10 billion to Stg11.50 billion. This made for a third quarter shortfall of Stg34.42 billion, up from the second quarter's Stg32.22 billion. The underlying volume trends remained disappointing. Quarterly growth of real core exports was just 0.6 percent compared with import growth of 2.0 percent. As such, today's report still suggests that the benefits of the weaker pound are emerging only slowly. September's global shortfall on goods trade narrowed from a significantly downwardly revised Stg12.35 billion in August to a smaller than expected Stg11.25 billion, a 4-month low. The decline in the red ink reflected a monthly 4.5 percent increase in exports that easily more than offset a 0.4 percent rise in imports. Annual growth of the former now stands at 18.1 percent or more than four times the 4.0 percent posted by imports. However, over the third quarter, exports were still 0.9 percent below their level in April to June while imports advanced 2.7 percent. The underlying trade deficit, which excludes oil and other erratic items, recorded only a modest reduction, narrowing from Stg12.10 billion to Stg11.50 billion. This made for a third quarter shortfall of Stg34.42 billion, up from the second quarter's Stg32.22 billion. The underlying volume trends remained disappointing. Quarterly growth of real core exports was just 0.6 percent compared with import growth of 2.0 percent. As such, today's report still suggests that the benefits of the weaker pound are emerging only slowly.
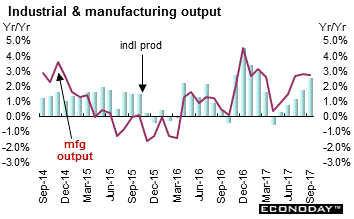 September industrial production expanded 0.7 percent on the month after a marginally larger revised 0.3 percent monthly rise in August, its best performance since last December. Annual growth climbed to 2.5 percent, a 7-month high. The manufacturing sector matched the monthly headline gain to leave output 2.7 percent stronger on the year. Monthly growth here was led by coke & petroleum products (4.7 percent) alongside machinery & equipment (3.2 percent), computer, electronic & optical products (2.9 percent) and electrical equipment (2.7 percent). Textiles & leather (down 1.5 percent) and food, drink & tobacco (down 1.1 percent) were the main losers. Elsewhere, total industrial production was boosted by a 2.2 percent monthly gain in mining & quarrying. Water supply dipped 0.1 percent while electricity and gas saw no change. September industrial production expanded 0.7 percent on the month after a marginally larger revised 0.3 percent monthly rise in August, its best performance since last December. Annual growth climbed to 2.5 percent, a 7-month high. The manufacturing sector matched the monthly headline gain to leave output 2.7 percent stronger on the year. Monthly growth here was led by coke & petroleum products (4.7 percent) alongside machinery & equipment (3.2 percent), computer, electronic & optical products (2.9 percent) and electrical equipment (2.7 percent). Textiles & leather (down 1.5 percent) and food, drink & tobacco (down 1.1 percent) were the main losers. Elsewhere, total industrial production was boosted by a 2.2 percent monthly gain in mining & quarrying. Water supply dipped 0.1 percent while electricity and gas saw no change.
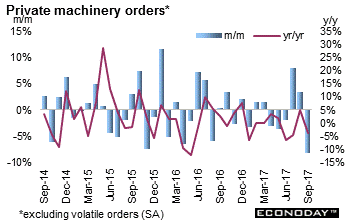 September private sector machinery orders (excluding volatile items) dropped 8.1 percent on the month (seasonally adjusted) after advancing 3.4 percent in August. This series, which excludes orders for ships and those from electric power companies, is considered a proxy for capital expenditures. On the year, orders were down 3.9 percent. The weakness in orders in September was broad-based. Manufacturing orders were down a monthly 5.1 percent after increasing 16.1 percent in August while non-manufacturing orders (excluding volatile items) declined by 11.1 percent, after advancing 3.1 percent in August. September private sector machinery orders (excluding volatile items) dropped 8.1 percent on the month (seasonally adjusted) after advancing 3.4 percent in August. This series, which excludes orders for ships and those from electric power companies, is considered a proxy for capital expenditures. On the year, orders were down 3.9 percent. The weakness in orders in September was broad-based. Manufacturing orders were down a monthly 5.1 percent after increasing 16.1 percent in August while non-manufacturing orders (excluding volatile items) declined by 11.1 percent, after advancing 3.1 percent in August.
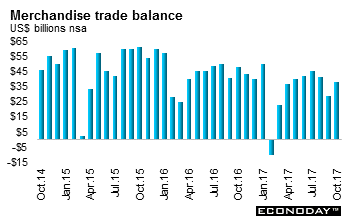 October merchandise trade surplus widened from $28.61 billion in September to $38.2 billion. Exports slowed from 8.1 percent increase in September on the year to 6.9 percent in October. Imports moderated from 18.6 percent to 17.2 percent. Weaker exports growth was mainly driven by exports to the United States, which increased 8.1 percent on the year after rising 13.8 percent in September. In contrast, exports to Japan strengthened, increasing by 5.6 percent on the year after zero growth in September. Chinese exports to the European Union picked up from 10.5 percent to 11.2 percent. In yuan terms, China's trade surplus widened from CNY193.9 billion in September to CNY254.57 billion in October. Exports grew 6.1 percent on the year, down from 9.0 percent in September, while imports slowed from 19.4 percent to 15.9 percent. October merchandise trade surplus widened from $28.61 billion in September to $38.2 billion. Exports slowed from 8.1 percent increase in September on the year to 6.9 percent in October. Imports moderated from 18.6 percent to 17.2 percent. Weaker exports growth was mainly driven by exports to the United States, which increased 8.1 percent on the year after rising 13.8 percent in September. In contrast, exports to Japan strengthened, increasing by 5.6 percent on the year after zero growth in September. Chinese exports to the European Union picked up from 10.5 percent to 11.2 percent. In yuan terms, China's trade surplus widened from CNY193.9 billion in September to CNY254.57 billion in October. Exports grew 6.1 percent on the year, down from 9.0 percent in September, while imports slowed from 19.4 percent to 15.9 percent.
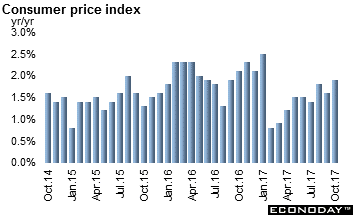 October consumer price index was up 1.9 percent on the year after increasing 1.6 percent in September. Stronger headline inflation was mainly driven by a decline in food prices, down 0.4 percent on the year after declining by 1.4 percent in September. Non-food prices were unchanged at 2.4 percent, its highest since April. Within the non-food category, prices advanced for transportation & communication and for household articles & services, were steady for housing and weaker for clothing and health care. Urban inflation climbed from 1.7 percent in September to 1.9 percent in October, while rural inflation advanced from 1.4 percent to 1.7 percent. October consumer price index was up 1.9 percent on the year after increasing 1.6 percent in September. Stronger headline inflation was mainly driven by a decline in food prices, down 0.4 percent on the year after declining by 1.4 percent in September. Non-food prices were unchanged at 2.4 percent, its highest since April. Within the non-food category, prices advanced for transportation & communication and for household articles & services, were steady for housing and weaker for clothing and health care. Urban inflation climbed from 1.7 percent in September to 1.9 percent in October, while rural inflation advanced from 1.4 percent to 1.7 percent.
Most global equity indexes retreated last week. A combination of little U.S. economic data and uncertainty regarding tax reform in the country sent investors to safe havens. Both the U.S. House of Representatives and Senate released drafts of their respective tax cut plans. As expected, both the Reserve Banks of Australia and New Zealand left their respective monetary policies unchanged.
The pace of economic releases picks up next week. Preliminary third quarter gross domestic product will be released by Japan, the Eurozone and Germany. The UK posts key consumer and producer price data along with the latest data on the labour market and retail sales. The UK isn't the only one to release labour data, Australia will report it also. Investors will closely parse the latest data from China — retail sales and industrial production — as they monitor the country's growth prospects.
| The following indicators will be released this week... |
| Europe |
|
|
| |
|
|
| Nov 14 |
Eurozone |
Gross Domestic Product (Q3. 2017 preliminary) |
|
|
Industrial Production (September) |
|
Germany |
Gross Domestic Product (Q3. 2017 preliminary) |
|
|
Zew Survey (November) |
|
Italy |
Gross Domestic Product (Q3. 2017 preliminary) |
|
UK |
Consumer Price Index (October) |
|
|
Producer Price Index (October) |
| Nov 15 |
Eurozone |
Merchandise Trade (September) |
|
UK |
Labour Market Report (October) |
| Nov 16 |
Eurozone |
Harmonized Index of Consumer Prices (October final) |
|
Italy |
Merchandise Trade (September) |
|
UK |
Retail Sales (October) |
| |
|
|
| Asia Pacific |
|
|
| Nov 13 |
Japan |
Producer Price Index (October) |
|
India |
Consumer Price Index (October) |
|
China |
Industrial Production (October) |
|
|
Retail Sales (October) |
| Nov 15 |
Japan |
Gross Domestic Product (Q3. 2017 preliminary) |
| Nov 16 |
Australia |
Labour Force Survey (October) |
| |
|
|
| Americas |
|
|
| Nov 16 |
Canada |
Manufacturing Sales |
| Nov 17 |
Canada |
Consumer Price Index (October) |
Anne D Picker is the author of International Economic Indicators and Central Banks.
|
