|
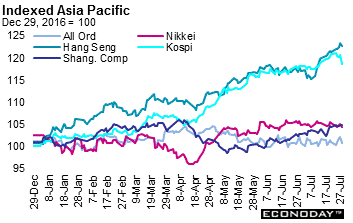
Equities were mixed last week. They reflected in part a combination of mixed earnings reports and economic data. The FOMC dovish policy announcement also weighed on investors. The Fed left its policy fed funds rate range unchanged at 1.0 percent to 1.25 percent and said that balance sheet reduction will likely begin "relatively soon". The U.S. dollar was particularly vulnerable during the week. After the Fed's announcement, the currency tumbled. With one more trading day remaining in July, most global indexes were up for the month. The exceptions are the All Ordinaries, Nikkei, DAX, OMX and S&P/TSX Composite.
Equities reacted relatively calmly to the FOMC announcement of no policy change but currencies did not. The U.S. dollar retreated against its major counterparts with the exception of the Swiss franc.
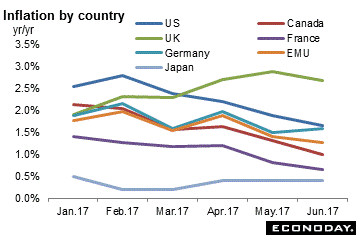 With inflation targeting a common thread among central banks, analysts monitor price changes intensively. Basically inflation targets are set using consumer prices. Since the beginning of 2017, consumer prices (measured by the annual change from the prior year in the CPI) have been weakening despite stronger global growth. The accompanying graph shows the annual change in consumer prices for several developed industrial countries — the United States, UK, Germany, France, Eurozone, Canada and Japan. Note that the Eurozone measure includes all 19 members of the monetary bloc. With inflation targeting a common thread among central banks, analysts monitor price changes intensively. Basically inflation targets are set using consumer prices. Since the beginning of 2017, consumer prices (measured by the annual change from the prior year in the CPI) have been weakening despite stronger global growth. The accompanying graph shows the annual change in consumer prices for several developed industrial countries — the United States, UK, Germany, France, Eurozone, Canada and Japan. Note that the Eurozone measure includes all 19 members of the monetary bloc.
Looking at what affects inflation, there is demand pull and cost push. The central banks are concerned with cost push which is generally caused by rising wages. That has been lacking. Demand pull inflation describes what happens when prices are driven up because of an imbalance between demand and supply — that is, the supply of goods and services cannot meet the demand.
Not that long ago, inflation was the demon that had to be avoided. But there were economists who said that a little inflation is not a bad thing. The most famous was Sumner Slichter. However, thanks to the oil crisis which sent oil prices soaring in the late 1970s and early 1980s, then Fed Chair Paul Volker sent the Fed funds rate soaring over 19 percent to quell the double digit inflation. The moral — be careful what you wish for!
| |
|
2016 |
2017 |
% Change |
|
Index |
Dec 31 |
July 21 |
July 28 |
Week |
2017 |
| Asia/Pacific |
|
|
|
|
|
|
| Australia |
All Ordinaries |
5719.1 |
5771.2 |
5755.2 |
-0.3% |
0.6% |
| Japan |
Nikkei 225 |
19114.4 |
20099.8 |
19959.8 |
-0.7% |
4.4% |
|
Topix |
1518.61 |
1629.99 |
1621.2 |
-0.5% |
6.8% |
| Hong Kong |
Hang Seng |
22000.6 |
26706.1 |
26979.4 |
1.0% |
22.6% |
| S. Korea |
Kospi |
2026.5 |
2450.1 |
2401.0 |
-2.0% |
18.5% |
| Singapore |
STI |
2880.8 |
3314.1 |
3330.8 |
0.5% |
15.6% |
| China |
Shanghai Composite |
3103.6 |
3238.0 |
3253.2 |
0.5% |
4.8% |
|
|
|
|
|
|
|
| India |
Sensex 30 |
26626.5 |
32028.89 |
32309.9 |
0.9% |
21.3% |
| Indonesia |
Jakarta Composite |
5296.7 |
5765.4 |
5831.0 |
1.1% |
10.1% |
| Malaysia |
KLCI |
1641.7 |
1759.2 |
1767.1 |
0.5% |
7.6% |
| Philippines |
PSEi |
6840.6 |
7989.7 |
8071.5 |
1.0% |
18.0% |
| Taiwan |
Taiex |
9253.5 |
10436.7 |
10423.1 |
-0.1% |
12.6% |
| Thailand |
SET |
1542.9 |
1573.5 |
1581.1 |
0.5% |
2.5% |
|
|
|
|
|
|
|
| Europe |
|
|
|
|
|
|
| UK |
FTSE 100 |
7142.8 |
7452.9 |
7368.4 |
-1.1% |
3.2% |
| France |
CAC |
4862.3 |
5117.7 |
5131.4 |
0.3% |
5.5% |
| Germany |
XETRA DAX |
11481.1 |
12240.1 |
12162.7 |
-0.6% |
5.9% |
| Italy |
FTSE MIB |
19234.6 |
21202.2 |
21430.4 |
1.1% |
11.4% |
| Spain |
IBEX 35 |
9352.1 |
10426.6 |
10536.1 |
1.1% |
12.7% |
| Sweden |
OMX Stockholm 30 |
1517.2 |
1581.4 |
1557.6 |
-1.5% |
2.7% |
| Switzerland |
SMI |
8219.9 |
8938.7 |
9019.3 |
0.9% |
9.7% |
|
|
|
|
|
|
|
| North America |
|
|
|
|
|
|
| United States |
Dow |
19762.6 |
21580.07 |
21830.3 |
1.2% |
10.5% |
|
NASDAQ |
5383.1 |
6387.8 |
6374.7 |
-0.2% |
18.4% |
|
S&P 500 |
2238.8 |
2472.5 |
2472.1 |
0.0% |
10.4% |
| Canada |
S&P/TSX Comp. |
15287.6 |
15183.1 |
15128.7 |
-0.4% |
-1.0% |
| Mexico |
Bolsa |
45642.9 |
51564.6 |
51213.6 |
-0.6% |
-0.7% |
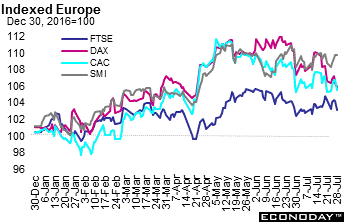 European equities ended the week on a down note, weighed on by disappointing earnings. However, for the week, shares were mixed with the FTSE (down 1.1 percent), DAX (down 0.6 percent) and OMX (down 1.5 percent) declining. The CAC was up 0.3 percent while the SMI added 0.9 percent. The Federal Reserve's dovish statement on Wednesday sent the euro and the pound sterling higher against the U.S. dollar, which in turn, pressured European markets. European equities ended the week on a down note, weighed on by disappointing earnings. However, for the week, shares were mixed with the FTSE (down 1.1 percent), DAX (down 0.6 percent) and OMX (down 1.5 percent) declining. The CAC was up 0.3 percent while the SMI added 0.9 percent. The Federal Reserve's dovish statement on Wednesday sent the euro and the pound sterling higher against the U.S. dollar, which in turn, pressured European markets.
The UK and France released their first estimates of second quarter growth. Solid UK and French GDP were welcome. On the quarter, UK GDP improved to an increase of 0.3 percent from 0.2 percent while French GDP improved to 0.5 percent from 0.3 percent. On the year, UK GDP was up 1.7 percent and France, 1.8 percent. There were a number of other data releases during the week that were positive including Germany's Ifo survey and GfK consumer confidence. However, the flash composite PMI readings eased slightly.
According to European Commission Economic and Financial Affairs Commissioner Pierre Moscovici, Greece has made much progress since 2010. Investor confidence is returning to the country as the country held a sale of its government bonds for the first time since 2014. Moscovici also expressed hope that Greece would be able to stand on its feet within a year and become a 'normal' member of the euro area again.
The International Monetary Fund cut its growth forecast for the UK economy in 2017, its first downgrade since the immediate aftermath of the Brexit vote last year. In an update to its World Economic Outlook, the IMF said annual GDP would expand 1.7 percent this year compared to a forecast of 2 percent growth made in April. The 2018 forecast was unchanged at 1.5 percent. Having warned of an immediate hit to the UK economy following last June's referendum result, the IMF was forced to change course on its outlook on the British economy, reversing almost all of its initial post-referendum downgrades from October as evidence showed consumer spending was propping up growth. But rising inflation thanks to the weaker pound sterling is pinching household spending this year as Brexit negotiations have begun.
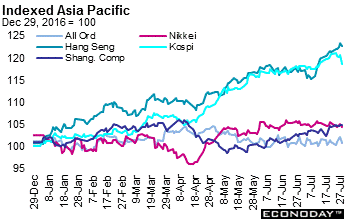 Equities ended the week on a down note as investors took profits following a selloff in U.S. technology stocks. Disappointing earnings results from Amazon.com intensified worries about corporate earnings. Investor sentiment was also hurt by the resignation of Japan's Defence Minister Tomomi Inada over a series of gaffes, missteps and a cover-up at her ministry that have contributed to a sharp plunge in public support for Prime Minister Shinzo Abe. Equities ended the week on a down note as investors took profits following a selloff in U.S. technology stocks. Disappointing earnings results from Amazon.com intensified worries about corporate earnings. Investor sentiment was also hurt by the resignation of Japan's Defence Minister Tomomi Inada over a series of gaffes, missteps and a cover-up at her ministry that have contributed to a sharp plunge in public support for Prime Minister Shinzo Abe.
The Nikkei and Topix retreated 0.7 percent and 0.5 percent for the week. Over the past few weeks, the suspicion of scandal over favoritism for a friend's business and missteps by cabinet ministers have taken a toll on Prime Minister Abe, who until recently was favored to win a third three-year term as party leader, and hence, premier when his current term expires in September 2018. Shares on Friday were down despite the release of better than expected economic data. Household spending increased at the fastest pace in nearly two years — retail sales advanced as well. However, the flash manufacturing PMI edged lower and consumer prices remained stubbornly lower.
The All Ordinaries also were lower on the week, losing 0.3 percent despite gains on three of five days. The index declined amid a broad-based selloff as investors braced for local corporate earnings results beginning next week.
However, both the Shanghai Composite (up 0.5 percent) and the Hang Seng (up 1.0 percent) advanced for the week. The former was up for a sixth consecutive week while the latter was up for the third week. The Hang Seng climbed above the 27,000 level for the first time since June 2015 on Thursday only to recede below on Friday.
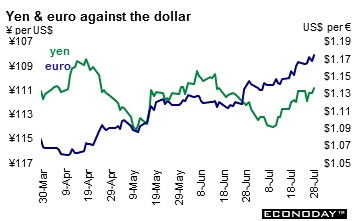 The U.S. dollar tumbled against all of its major counterparts with the exception of the Swiss franc. The Federal Reserve drove the dollar lower Wednesday with a policy statement that stuck to its promises on tightening but mentioned weakness in inflation more explicitly than before. That played into doubts among international investors over U.S. economic growth and extended a sporadic slide that dates back to early March. The U.S. dollar tumbled against all of its major counterparts with the exception of the Swiss franc. The Federal Reserve drove the dollar lower Wednesday with a policy statement that stuck to its promises on tightening but mentioned weakness in inflation more explicitly than before. That played into doubts among international investors over U.S. economic growth and extended a sporadic slide that dates back to early March.
On Friday, the International Monetary Fund said that the U.S. currency was overvalued by 10 percent to 20 percent based on U.S. near-term economic fundamentals while it viewed valuations of the euro, Japan's yen, and China's yuan as broadly in line with fundamentals. The IMF's External Sector Report — an annual assessment of currencies and external surpluses and deficits of major economies — indicated that external current account deficits were becoming more concentrated in certain advanced economies such as the United States while surpluses remained persistent in China and Germany. While the report assessed the euro's valuation as appropriate for the Eurozone as a whole, the real effective exchange rate was 10 to 20 percent too low for Germany's fundamentals. The IMF said the dollar's appreciation in recent years was based on its relatively stronger growth outlook, its monetary policy divergence from the Eurozone and Japan as well as expectations for further fiscal stimulus from the Trump administration.
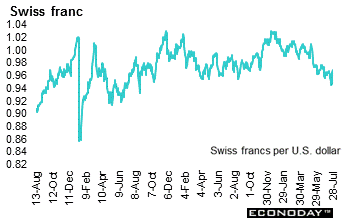 The Swiss franc declined to its weakest level since the collapse of an official cap in 2015. The franc, which had been largely steady for the past two years between capital seeking the security of Switzerland and a campaign of official intervention against the currency, fell about 2.4 percent this week. According to analysts, the safe haven trade for the Swiss franc is starting to unwind. The Swiss franc appears to be sliding all by itself, without intervention from the Swiss National Bank. One reason for the decline is the persistent strength of the euro, which has jumped higher against the wobbling dollar. Analysts said the main trigger was the change in the outlook for global monetary policy, which has seen expectations of tighter financial conditions and relatively higher market interest rates in the euro area grow. The Swiss franc declined to its weakest level since the collapse of an official cap in 2015. The franc, which had been largely steady for the past two years between capital seeking the security of Switzerland and a campaign of official intervention against the currency, fell about 2.4 percent this week. According to analysts, the safe haven trade for the Swiss franc is starting to unwind. The Swiss franc appears to be sliding all by itself, without intervention from the Swiss National Bank. One reason for the decline is the persistent strength of the euro, which has jumped higher against the wobbling dollar. Analysts said the main trigger was the change in the outlook for global monetary policy, which has seen expectations of tighter financial conditions and relatively higher market interest rates in the euro area grow.
|
|
2016 |
2017 |
% Change |
|
|
Dec 30 |
July 21 |
July 28 |
Week |
2017 |
| U.S. $ per currency |
|
|
|
|
|
|
| Australia |
A$ |
0.7215 |
0.792 |
0.799 |
0.9% |
10.7% |
| New Zealand |
NZ$ |
0.6948 |
0.746 |
0.752 |
0.8% |
8.2% |
| Canada |
C$ |
0.7443 |
0.798 |
0.804 |
0.8% |
8.0% |
| Eurozone |
euro (€) |
1.0534 |
1.167 |
1.175 |
0.7% |
11.6% |
| UK |
pound sterling (£) |
1.2333 |
1.300 |
1.314 |
1.1% |
6.6% |
|
|
|
|
|
|
|
| Currency per U.S. $ |
|
|
|
|
|
|
| China |
yuan |
6.9450 |
6.767 |
6.737 |
0.4% |
3.1% |
| Hong Kong |
HK$* |
7.7533 |
7.810 |
7.810 |
0.0% |
-0.7% |
| India |
rupee |
67.9238 |
64.319 |
64.154 |
0.3% |
5.9% |
| Japan |
yen |
116.8100 |
111.060 |
110.610 |
0.4% |
5.6% |
| Malaysia |
ringgit |
4.4862 |
4.284 |
4.281 |
0.1% |
4.8% |
| Singapore |
Singapore $ |
1.4465 |
1.362 |
1.356 |
0.4% |
6.6% |
| South Korea |
won |
1205.8300 |
1118.360 |
1122.180 |
-0.3% |
7.5% |
| Taiwan |
Taiwan $ |
32.3260 |
30.422 |
30.240 |
0.6% |
6.9% |
| Thailand |
baht |
35.8100 |
33.453 |
33.365 |
0.3% |
7.3% |
| Switzerland |
Swiss franc |
1.0174 |
0.9452 |
0.9687 |
-2.4% |
5.0% |
| *Pegged to U.S. dollar |
|
|
|
|
|
|
| Source: Bloomberg |
|
|
|
|
|
|
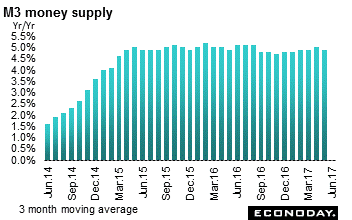 June M3 money growth was 5.0 percent from a year ago and was up a tick from a marginally weaker revised May reading. The 3-month moving average for the three months through June was 4.9 percent, down just 0.1 percentage points from last time and in line with its April mark. Private sector lending growth was up 0.2 percentage points at 2.4 percent although after adjustment for loan sales and securitization, it dipped from 2.7 percent to 2.5 percent. Within this, borrowing by households was steady at 2.6 percent with a slowdown in credit for consumption (5.8 percent after 6.2 percent) essentially offset by a rise in loans for house purchase (3.3 percent after 2.9 percent). However, at 2.1 percent, lending to non-financial companies was off 0.4 percentage points from its May rate to hit its weakest mark since February. Loans to non-monetary financial corporations (excluding insurance corporations and pension funds) accelerated to 3.5 percent from 2.1 percent. June M3 money growth was 5.0 percent from a year ago and was up a tick from a marginally weaker revised May reading. The 3-month moving average for the three months through June was 4.9 percent, down just 0.1 percentage points from last time and in line with its April mark. Private sector lending growth was up 0.2 percentage points at 2.4 percent although after adjustment for loan sales and securitization, it dipped from 2.7 percent to 2.5 percent. Within this, borrowing by households was steady at 2.6 percent with a slowdown in credit for consumption (5.8 percent after 6.2 percent) essentially offset by a rise in loans for house purchase (3.3 percent after 2.9 percent). However, at 2.1 percent, lending to non-financial companies was off 0.4 percentage points from its May rate to hit its weakest mark since February. Loans to non-monetary financial corporations (excluding insurance corporations and pension funds) accelerated to 3.5 percent from 2.1 percent.
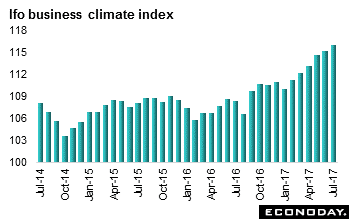 July Ifo business climate index climbed from 115.2 in June to 116.0 — the highest since the survey began in 1991. The latest increase reflected gains in both of its components. Current conditions rose for an 11th consecutive month from 124.2 to 125.4 in July. Expectations rose for a third consecutive month to 107.3 from 106.8. Strong business sentiment was broad-based with the relevant index advancing to new 12-month highs for the manufacturing, construction and wholesale sectors. The retail sector declined, reversing the sharp increase recorded in June but still leaving the index well above levels seen in the first three months of the year. July Ifo business climate index climbed from 115.2 in June to 116.0 — the highest since the survey began in 1991. The latest increase reflected gains in both of its components. Current conditions rose for an 11th consecutive month from 124.2 to 125.4 in July. Expectations rose for a third consecutive month to 107.3 from 106.8. Strong business sentiment was broad-based with the relevant index advancing to new 12-month highs for the manufacturing, construction and wholesale sectors. The retail sector declined, reversing the sharp increase recorded in June but still leaving the index well above levels seen in the first three months of the year.
 Provisional second quarter gross domestic product was up a quarterly 0.5 percent for a second quarter and 1.8 percent from the same quarter a year ago after increasing 1.1 percent in the first quarter. Final domestic demand added 0.4 percentage points to the quarterly change in real GDP despite another relatively sluggish rise in household consumption (0.3 percent after 0.1 percent). Public sector spending was up 0.4 percent but gross fixed capital formation (0.5 percent after 1.4 percent) again led the way, albeit at a much reduced pace than in January to March. Business investment (0.5 percent) increased at less than half its first quarter rate but residential spending (1.0 percent after 1.2 percent) held up well. Stock building, which boosted first quarter growth by 0.7 percentage points, subtracted 0.6 percentage points (largely in transportation) and so reduced the threat of an inventory overhang. Net foreign trade swung back into positive territory as a 3.1 percent jump in exports easily eclipsed a 0.2 percent rise in imports. As a result, net exports provided a sizeable 0.8 percentage point lift, more than reversing the previous period's 0.6 percentage point hit. Provisional second quarter gross domestic product was up a quarterly 0.5 percent for a second quarter and 1.8 percent from the same quarter a year ago after increasing 1.1 percent in the first quarter. Final domestic demand added 0.4 percentage points to the quarterly change in real GDP despite another relatively sluggish rise in household consumption (0.3 percent after 0.1 percent). Public sector spending was up 0.4 percent but gross fixed capital formation (0.5 percent after 1.4 percent) again led the way, albeit at a much reduced pace than in January to March. Business investment (0.5 percent) increased at less than half its first quarter rate but residential spending (1.0 percent after 1.2 percent) held up well. Stock building, which boosted first quarter growth by 0.7 percentage points, subtracted 0.6 percentage points (largely in transportation) and so reduced the threat of an inventory overhang. Net foreign trade swung back into positive territory as a 3.1 percent jump in exports easily eclipsed a 0.2 percent rise in imports. As a result, net exports provided a sizeable 0.8 percentage point lift, more than reversing the previous period's 0.6 percentage point hit.
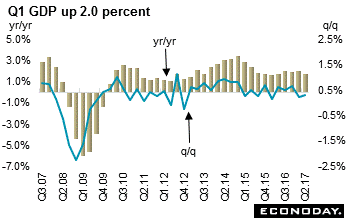 Second quarter gross domestic product expanded 0.3 percent from the January to March period when it grew an unrevised 0.2 percent, equaling the smallest rise since the fourth quarter of 2012. Annual growth was 1.7 percent, down from 2.0 percent last time. The latest quarterly advance was dominated by the services sector which posted a 0.5 percent gain, up from a meagre 0.1 percent in the first quarter. Within this, distribution, hotels & restaurants (1.1 percent) and transport, storage & communication (1.0 percent) led the way ahead of business services & finance (0.4 percent). By contrast, goods producing industries were soft with output here declining 0.4 percent on the back of a 0.5 percent decrease in manufacturing. Elsewhere, construction was off 0.9 percent, matching the drop recorded in mining & quarrying, but agriculture, forestry & fishing was up 0.6 percent. Second quarter gross domestic product expanded 0.3 percent from the January to March period when it grew an unrevised 0.2 percent, equaling the smallest rise since the fourth quarter of 2012. Annual growth was 1.7 percent, down from 2.0 percent last time. The latest quarterly advance was dominated by the services sector which posted a 0.5 percent gain, up from a meagre 0.1 percent in the first quarter. Within this, distribution, hotels & restaurants (1.1 percent) and transport, storage & communication (1.0 percent) led the way ahead of business services & finance (0.4 percent). By contrast, goods producing industries were soft with output here declining 0.4 percent on the back of a 0.5 percent decrease in manufacturing. Elsewhere, construction was off 0.9 percent, matching the drop recorded in mining & quarrying, but agriculture, forestry & fishing was up 0.6 percent.
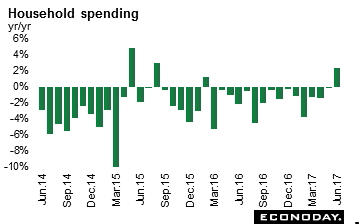 June household spending advanced 2.3 percent on the year after declining 0.1 percent in May. This was the first positive reading after fifteen consecutive months in negative territory. Spending was largely driven by housing, up 25.1 percent on the year after a drop of 8.8 percent in May. Spending on other major categories remained weak, with annual growth still negative for food, fuel, light & water charges and clothing & footwear. A measure of core household spending - which excludes housing, motor vehicles and other volatile items and tends to track more closely the consumption component of gross domestic product edged up 0.1 percent after declining 0.8 percent in May. June household spending advanced 2.3 percent on the year after declining 0.1 percent in May. This was the first positive reading after fifteen consecutive months in negative territory. Spending was largely driven by housing, up 25.1 percent on the year after a drop of 8.8 percent in May. Spending on other major categories remained weak, with annual growth still negative for food, fuel, light & water charges and clothing & footwear. A measure of core household spending - which excludes housing, motor vehicles and other volatile items and tends to track more closely the consumption component of gross domestic product edged up 0.1 percent after declining 0.8 percent in May.
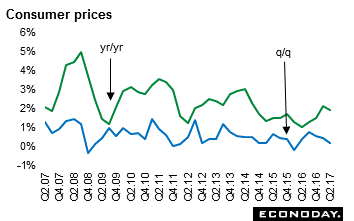 Consumer prices for the three months to June slowed to 1.9 percent from 2.1 percent in the three months to March. This is now below the Reserve Bank of Australia's target range of 2.0 percent to 3.0 percent after moving back within that target range last quarter for the first time since mid-2014. Headline CPI rose 0.2 percent on the quarter, down from 0.5 percent in the three months to March. The quarterly reading reflects weaker growth in transport costs. Prices of clothing & footwear were down 1.9 percent on the year after increasing by 0.3 percent in the previous quarter. This was partly offset by a smaller decline in communication costs on the year. Measures of core inflation, which exclude the impact of volatile price changes, were broadly steady — the trimmed mean CPI inflation measure eased from 1.9 percent in the three months to March to 1.8 percent while the weighted mean CPI inflation measure ticked higher from 1.7 percent to 1.8 percent. Both measures rose 0.5 percent on the quarter. Consumer prices for the three months to June slowed to 1.9 percent from 2.1 percent in the three months to March. This is now below the Reserve Bank of Australia's target range of 2.0 percent to 3.0 percent after moving back within that target range last quarter for the first time since mid-2014. Headline CPI rose 0.2 percent on the quarter, down from 0.5 percent in the three months to March. The quarterly reading reflects weaker growth in transport costs. Prices of clothing & footwear were down 1.9 percent on the year after increasing by 0.3 percent in the previous quarter. This was partly offset by a smaller decline in communication costs on the year. Measures of core inflation, which exclude the impact of volatile price changes, were broadly steady — the trimmed mean CPI inflation measure eased from 1.9 percent in the three months to March to 1.8 percent while the weighted mean CPI inflation measure ticked higher from 1.7 percent to 1.8 percent. Both measures rose 0.5 percent on the quarter.
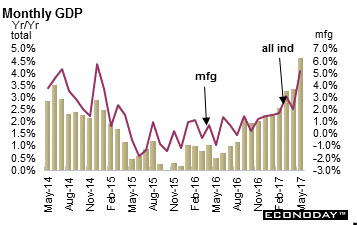 May real gross domestic product (GDP). Of the 20 industrial sectors, 14 were higher. This was the seventh consecutive monthly increase for the series, a streak that was last matched between September 2009 and March 2010. Goods producing industries were up 1.6 percent, led by mining, quarrying and oil & gas extraction. Services were up 0.2 percent after increasing 0.3 percent in April, led by finance and insurance services. Manufacturing was up 1.1 percent. Manufacturing has been alternating between increases and decreases since the beginning of 2017. Non-durable manufacturing rose 0.8 percent, offsetting the decline in April. Five of eight subsectors gained, led by manufacturers of petroleum & coal products, printing & related support activities and paper. Durable manufacturing was up 1.4 percent as 6 of 10 subsectors grew. Leading the growth was the transportation equipment manufacturing subsector on higher output by manufacturers of motor vehicles, motor vehicle parts and miscellaneous transportation equipment. The finance and insurance sector increased 0.9 percent. Construction was down 0.6 percent in May due to a strike by construction workers in Quebec in the last week of the month. Real estate and rental and leasing declined 0.2 percent in May after five consecutive months of growth. May real gross domestic product (GDP). Of the 20 industrial sectors, 14 were higher. This was the seventh consecutive monthly increase for the series, a streak that was last matched between September 2009 and March 2010. Goods producing industries were up 1.6 percent, led by mining, quarrying and oil & gas extraction. Services were up 0.2 percent after increasing 0.3 percent in April, led by finance and insurance services. Manufacturing was up 1.1 percent. Manufacturing has been alternating between increases and decreases since the beginning of 2017. Non-durable manufacturing rose 0.8 percent, offsetting the decline in April. Five of eight subsectors gained, led by manufacturers of petroleum & coal products, printing & related support activities and paper. Durable manufacturing was up 1.4 percent as 6 of 10 subsectors grew. Leading the growth was the transportation equipment manufacturing subsector on higher output by manufacturers of motor vehicles, motor vehicle parts and miscellaneous transportation equipment. The finance and insurance sector increased 0.9 percent. Construction was down 0.6 percent in May due to a strike by construction workers in Quebec in the last week of the month. Real estate and rental and leasing declined 0.2 percent in May after five consecutive months of growth.
As anticipated, the Federal Reserve left its monetary policy unchanged. UK, French and U.S. preliminary GDP estimates for the second quarter improved from the first. The U.S. dollar declined against its major counterparts except the Swiss franc.
There is a trifecta of central bank meetings next week with the Reserve Banks of Australia and India and the Bank of England all announcing their respective monetary policies. Final July PMIs will be released for a wide spectrum of countries globally. International trade data will be released for Australia, Canada and the U.S. And since it will be the first Friday of the month, both Canada and the U.S. will release employment data for July.
| Central Bank activities |
|
| August 1 |
Australia |
Reserve Bank of Australia Monetary Policy Announcement |
| August 2 |
India |
Reserve Bank of India Monetary Policy Announcement |
| August 3 |
UK |
Bank of England Monetary Policy Announcement |
|
|
BoE Quarterly Inflation Report |
| |
|
|
| The following indicators will be released this week... |
| Europe |
|
|
| July 31 |
Eurozone |
Harmonized Index of Consumer Prices (July flash) |
|
|
Unemployment Rate (June) |
| August 1 |
Eurozone |
PMI Manufacturing (July) |
|
Germany |
PMI Manufacturing (July) |
|
France |
PMI Manufacturing (July) |
| August 3 |
Eurozone |
PMI Composite (July) |
|
|
Retail Sales (June) |
|
Germany |
PMI Composite (July) |
|
France |
PMI Composite (July) |
| August 4 |
Germany |
Manufacturers Orders (June) |
| |
|
|
| Asia |
|
|
| July 31 |
Japan |
Industrial Production (June) |
|
China |
PMI Manufacturing (July) |
| August 1 |
Japan |
PMI Manufacturing (July) |
|
India |
PMI Manufacturing (July) |
| August 3 |
Australia |
Merchandise Trade (June) |
| August 4 |
Australia |
Retail Sales (June) |
| |
|
|
| Americas |
|
|
| July 31 |
Canada |
Industrial Product Price Index (June) |
| August 4 |
Canada |
Labour Force Survey (July) |
|
|
International Trade (June) |
Anne D Picker is the author of International Economic Indicators and Central Banks.
|
