|
Global equities staged a relief rally at the beginning of the week as investors celebrated the outcome of the French election. However, investors greeted U.S. President Donald Trump's tax proposal with wariness. And for the most part, equities retreated in the immediate aftermath of the plan's release. On the week, the gains ranged from 0.4 percent (Jakarta Composite) to 3.4 percent (OMX Stockholm). The S&P/TSX and SET lost 0.2 percent and the Shanghai Composite was down 0.6 percent. In April, both the FTSE MIB and Taiex added 0.6 percent while the PSEi jumped 4.8 percent.
Growth disappointed and slowed in the first quarter in France, the UK and U.S. Early releases of gross domestic product data are preliminary at best with estimates calculated on incomplete data. They subject to extensive revision going forward. All three will offer revised and updated data in May.
Both the Bank of Japan and the European Central Bank kept their respective monetary policies unchanged but lifted their economic assessments.
| |
|
2016 |
2017 |
% Change |
|
Index |
Dec 31 |
April 21 |
April 28 |
Week |
April |
2017 |
| Asia/Pacific |
|
|
|
|
|
|
|
| Australia |
All Ordinaries |
5719.1 |
5885.7 |
5947.59 |
1.1% |
0.7% |
4.0% |
| Japan |
Nikkei 225 |
19114.4 |
18620.8 |
19196.74 |
3.1% |
1.5% |
0.4% |
|
Topix |
1518.61 |
1488.58 |
1531.80 |
2.9% |
1.3% |
0.9% |
| Hong Kong |
Hang Seng |
22000.6 |
24042.0 |
24615.13 |
2.4% |
2.1% |
11.9% |
| S. Korea |
Kospi |
2026.5 |
2165.0 |
2205.44 |
1.9% |
2.1% |
8.8% |
| Singapore |
STI |
2880.8 |
3139.8 |
3175.44 |
1.1% |
0.0% |
10.2% |
| China |
Shanghai Composite |
3103.6 |
3173.2 |
3154.66 |
-0.6% |
-2.1% |
1.6% |
|
|
|
|
|
|
|
|
| India |
Sensex 30 |
26626.5 |
29365.3 |
29918.40 |
1.9% |
1.0% |
12.4% |
| Indonesia |
Jakarta Composite |
5296.7 |
5664.5 |
5685.30 |
0.4% |
2.1% |
7.3% |
| Malaysia |
KLCI |
1641.7 |
1756.1 |
1768.06 |
0.7% |
1.6% |
7.7% |
| Philippines |
PSEi |
6840.6 |
7578.2 |
7661.01 |
1.1% |
4.8% |
12.0% |
| Taiwan |
Taiex |
9253.5 |
9717.4 |
9872.00 |
1.6% |
0.6% |
6.7% |
| Thailand |
SET |
1542.9 |
1570.0 |
1566.32 |
-0.2% |
-0.6% |
1.5% |
|
|
|
|
|
|
|
|
| Europe |
|
|
|
|
|
|
|
| UK |
FTSE 100 |
7142.8 |
7114.6 |
7203.94 |
1.3% |
-1.6% |
0.9% |
| France |
CAC |
4862.3 |
5059.2 |
5267.33 |
4.1% |
2.8% |
8.3% |
| Germany |
XETRA DAX |
11481.1 |
12048.6 |
12438.01 |
3.2% |
1.0% |
8.3% |
| Italy |
FTSE MIB |
19234.6 |
19741.8 |
20609.16 |
4.4% |
0.6% |
7.1% |
| Spain |
IBEX 35 |
9352.1 |
10377.0 |
10715.80 |
3.3% |
2.4% |
14.6% |
| Sweden |
OMX Stockholm 30 |
1517.2 |
1573.3 |
1626.99 |
3.4% |
2.5% |
7.2% |
| Switzerland |
SMI |
8219.9 |
8554.0 |
8812.67 |
3.0% |
1.8% |
7.2% |
|
|
|
|
|
|
|
|
| North America |
|
|
|
|
|
|
|
| United States |
Dow |
19762.6 |
20547.76 |
20940.51 |
1.9% |
1.3% |
6.0% |
|
NASDAQ |
5383.1 |
5910.5 |
6047.61 |
2.3% |
2.3% |
12.3% |
|
S&P 500 |
2238.8 |
2348.7 |
2384.20 |
1.5% |
0.9% |
6.5% |
| Canada |
S&P/TSX Comp. |
15287.6 |
15614.5 |
15586.13 |
-0.2% |
0.2% |
2.0% |
| Mexico |
Bolsa |
45642.9 |
48967.8 |
49261.330 |
0.6% |
1.5% |
7.9% |
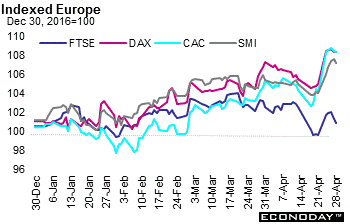 Equity indexes advanced on the week primarily on rallies at the beginning of the week in the immediate aftermath of the French election results. A runoff will be held on May 7 between Marine Le Pen and Emmanuel Macron. Gains tapered after Monday and turned negative Thursday and Friday. On the week, the FTSE was up 1.3 percent, the CAC gained 4.1 percent, the DAX advanced 3.2 percent and the SMI was 3.0 percent higher. However, the FTSE declined in April by 1.8 percent while the CAC, DAX and SMI were up 2.8 percent, 1.0 percent and 1.8 percent respectively. Equity indexes advanced on the week primarily on rallies at the beginning of the week in the immediate aftermath of the French election results. A runoff will be held on May 7 between Marine Le Pen and Emmanuel Macron. Gains tapered after Monday and turned negative Thursday and Friday. On the week, the FTSE was up 1.3 percent, the CAC gained 4.1 percent, the DAX advanced 3.2 percent and the SMI was 3.0 percent higher. However, the FTSE declined in April by 1.8 percent while the CAC, DAX and SMI were up 2.8 percent, 1.0 percent and 1.8 percent respectively.
After rallying on the French election results investors turned their focus to the slew of earnings and economic reports that were released primarily at the end of the week and the European Central Bank announcement Thursday. With an upcoming holiday, investors seemed reluctant to make any major moves ahead of Monday's holiday. Eurozone inflation accelerated more-than-expected in April, returning within the European Central Bank's target of 'below, but close to 2 percent.' However, the UK economy expanded at the slowest pace in a year increasing only 0.3 percent when compared with the previous quarter. French first quarter GDP also increased a quarterly 0.3 percent. German March retail sales were up 2.3 percent from a year ago, offsetting February's revised drop of 2.3 percent.
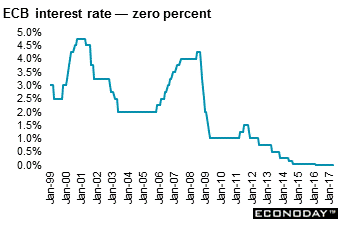 The European Central Bank kept its monetary policy unchanged as anticipated prior to the French presidential run-off between Emmanuel Macron and Marine Le Pen. The ECB's governing council left its benchmark main refinancing rate at zero and the deposit rate at minus 0.4 percent. The Bank will continue to buy €60 billion in mostly government bonds under its quantitative easing program that will run until at least until the end of this year. The central bank also signaled no move on its forward guidance implying that interest rates are still expected to remain at present or lower levels for an extended period of time, and well past the horizon of the net asset purchases. The European Central Bank kept its monetary policy unchanged as anticipated prior to the French presidential run-off between Emmanuel Macron and Marine Le Pen. The ECB's governing council left its benchmark main refinancing rate at zero and the deposit rate at minus 0.4 percent. The Bank will continue to buy €60 billion in mostly government bonds under its quantitative easing program that will run until at least until the end of this year. The central bank also signaled no move on its forward guidance implying that interest rates are still expected to remain at present or lower levels for an extended period of time, and well past the horizon of the net asset purchases.
ECB President Mario Draghi's press conference contained no surprises. He acknowledged that there was some difference of opinion over the strength of the Eurozone's economic recovery within the governing council, but he said there was "unanimity" over the ECB's belief that risks are "still tilted to the downside". Mr Draghi said "some members had a more sanguine view on the economic situation", while "others believed that such improvements would not warrant any change in communication as far as the balance of risks is concerned".
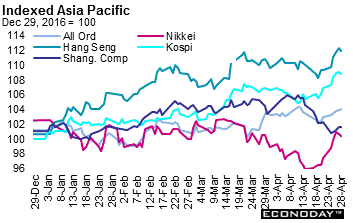 Equities ended the week and month on a cautious note thanks to the geopolitical worries on the Korean peninsula. Earnings continued to remain in focus. Most indexes advanced on the week with the exception of the Shanghai Composite (down 0.6 percent) and the SET (down 0.2 percent). The Shanghai Composite and SET were also down for the month of April (2.1 percent and 0.6 percent respectively). Equities ended the week and month on a cautious note thanks to the geopolitical worries on the Korean peninsula. Earnings continued to remain in focus. Most indexes advanced on the week with the exception of the Shanghai Composite (down 0.6 percent) and the SET (down 0.2 percent). The Shanghai Composite and SET were also down for the month of April (2.1 percent and 0.6 percent respectively).
Gains for the week ranged from 0.4 percent (Jakarta Composite) to 3.1 percent (Nikkei). Japanese shares benefited from a sliding yen against the U.S. dollar. On Friday, the indexes lost ground — investors were disappointed with the slew of Japanese March economic data. Industrial output dropped 2.1 percent from the previous month after posting a 3.2 percent gain in February. Household spending fell more than expected and consumer price inflation remained stagnant at 0.2 percent. Retail sales however, rose more than expected.
After tumbling on Monday, the Shanghai Composite — even though it was positive for the rest of the week — was never able to recoup Monday's losses. Investors remained concerned over tightening regulation and cooling economic growth. However, equities were lifted after March profits earned by Chinese industrial firms climbed but at a slower pace than in the first two months of the year. Industrial profits jumped an annual 23.8 percent, well below the 31.5 percent surge in the January to February period. However, it was much faster than the 8.5 percent growth in the whole year 2016.
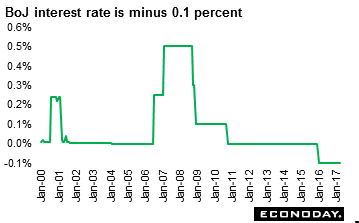 As widely anticipated the Bank of Japan kept its interest rate target at minus 0.1 percent where it has been since January 2016. It also said that it will continue to keep 10-year government bond yields around zero percent. The BoJ offered its most optimistic assessment of the economy in nine years and described recent weakness in inflation as temporary. The monetary policy board signaled confidence that a sustained recovery will help achieve its 2 percent inflation target. It also kept a loose pledge to buy government bonds so its holdings increase at an annual pace of ¥80 trillion, defying market speculation the guidance could be removed to pave the way for an eventual withdrawal of stimulus. As widely anticipated the Bank of Japan kept its interest rate target at minus 0.1 percent where it has been since January 2016. It also said that it will continue to keep 10-year government bond yields around zero percent. The BoJ offered its most optimistic assessment of the economy in nine years and described recent weakness in inflation as temporary. The monetary policy board signaled confidence that a sustained recovery will help achieve its 2 percent inflation target. It also kept a loose pledge to buy government bonds so its holdings increase at an annual pace of ¥80 trillion, defying market speculation the guidance could be removed to pave the way for an eventual withdrawal of stimulus.
It was the first time since March 2008 the BoJ used the word "expansion" to describe the state of the economy, signaling its conviction that the recovery was gaining momentum and that it saw no need for additional stimulus. Despite the rosy economic view, BoJ Governor Kuroda reminded markets the Bank is nowhere near an exit from its massive stimulus. Kuroda added that the BOJ had no automatic trigger for starting debate on exiting its ultra-loose monetary policy.
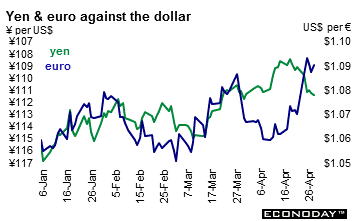 The yen and euro were going in opposite directions against the U.S. dollar this past week. The yen slid lower much to the glee of Japanese exporters while the euro is gaining strength since last week's French election results. The U.S. dollar advanced against the yen and the Canadian and Australian dollars but retreated against the pound, euro and Swiss franc. The euro jumped in the immediate aftermath of the French election to its highest level against the dollar since November. The yen and euro were going in opposite directions against the U.S. dollar this past week. The yen slid lower much to the glee of Japanese exporters while the euro is gaining strength since last week's French election results. The U.S. dollar advanced against the yen and the Canadian and Australian dollars but retreated against the pound, euro and Swiss franc. The euro jumped in the immediate aftermath of the French election to its highest level against the dollar since November.
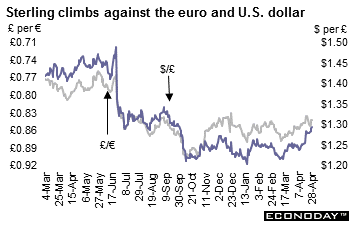 The pound sterling ignored the less than anticipated first quarter GDP growth and continued to rise against both the U.S. dollar and euro. First quarter gross domestic product expanded a less than forecast 0.3 percent in the first quarter from the prior three months. It was the slowest growth since the first quarter of 2016. The currency rose after Prime Minister Theresa May announced a snap election for June 8 on April 18. The pound sterling ignored the less than anticipated first quarter GDP growth and continued to rise against both the U.S. dollar and euro. First quarter gross domestic product expanded a less than forecast 0.3 percent in the first quarter from the prior three months. It was the slowest growth since the first quarter of 2016. The currency rose after Prime Minister Theresa May announced a snap election for June 8 on April 18.
|
|
2016 |
2017 |
% Change |
|
|
Dec 30 |
April 21 |
April 28 |
Week |
2016 |
| U.S. $ per currency |
|
|
|
|
|
|
| Australia |
A$ |
0.7215 |
0.754 |
0.750 |
-0.5% |
3.9% |
| New Zealand |
NZ$ |
0.6948 |
0.703 |
0.687 |
-2.3% |
-1.2% |
| Canada |
C$ |
0.7443 |
0.741 |
0.732 |
-1.1% |
-1.6% |
| Eurozone |
euro (€) |
1.0534 |
1.070 |
1.089 |
1.8% |
3.4% |
| UK |
pound sterling (£) |
1.2333 |
1.280 |
1.295 |
1.2% |
5.0% |
|
|
|
|
|
|
|
| Currency per U.S. $ |
|
|
|
|
|
|
| China |
yuan |
6.9450 |
6.886 |
6.894 |
-0.1% |
0.7% |
| Hong Kong |
HK$* |
7.7533 |
7.776 |
7.778 |
0.0% |
-0.3% |
| India |
rupee |
67.9238 |
64.613 |
64.246 |
0.6% |
5.7% |
| Japan |
yen |
116.8100 |
109.130 |
111.450 |
-2.1% |
4.8% |
| Malaysia |
ringgit |
4.4862 |
4.399 |
4.341 |
1.3% |
3.3% |
| Singapore |
Singapore $ |
1.4465 |
1.396 |
1.397 |
-0.1% |
3.5% |
| South Korea |
won |
1205.8300 |
1134.300 |
1137.650 |
-0.3% |
6.0% |
| Taiwan |
Taiwan $ |
32.3260 |
30.342 |
30.210 |
0.4% |
7.0% |
| Thailand |
baht |
35.8100 |
34.372 |
34.590 |
-0.6% |
3.5% |
| Switzerland |
Swiss franc |
1.0174 |
0.9975 |
0.9946 |
0.3% |
2.3% |
| *Pegged to U.S. dollar |
|
|
|
|
|
|
| Source: Bloomberg |
|
|
|
|
|
|
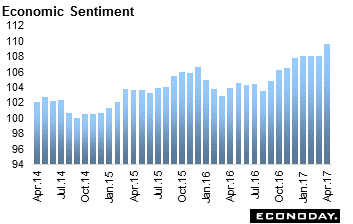 April's EU Commission's gauge of economic sentiment (ESI) was 109.6, 1.6 points above its marginally stronger revised March reading and at a post-Great Recession high. The ESI has not fallen since last August. The headline improvement reflected gains in confidence in both the consumer sector (minus 3.6 after minus 5.0) and industry (2.6 after 1.3). Elsewhere, services (14.2 after 12.8) also improved as did retail trade (3.2 after 1.8) and construction (minus 6.2 after minus 9.9). Regionally among the larger countries there were gains in all the national ESIs. France was up 0.8 points at 106.3, Germany 0.8 points at 110.0, Italy 1.4 points at 107.0 and Spain 1.0 point at 107.9. However, the inflation update was mixed. Expected selling prices in manufacturing slipped from 9.6 to 8.2 but services recorded a 0.4 point increase to 6.5 (although this was still 0.2 points short of their January mark). Household inflation expectations also dropped 1.4 points to 13.9, a 4-month low. April's EU Commission's gauge of economic sentiment (ESI) was 109.6, 1.6 points above its marginally stronger revised March reading and at a post-Great Recession high. The ESI has not fallen since last August. The headline improvement reflected gains in confidence in both the consumer sector (minus 3.6 after minus 5.0) and industry (2.6 after 1.3). Elsewhere, services (14.2 after 12.8) also improved as did retail trade (3.2 after 1.8) and construction (minus 6.2 after minus 9.9). Regionally among the larger countries there were gains in all the national ESIs. France was up 0.8 points at 106.3, Germany 0.8 points at 110.0, Italy 1.4 points at 107.0 and Spain 1.0 point at 107.9. However, the inflation update was mixed. Expected selling prices in manufacturing slipped from 9.6 to 8.2 but services recorded a 0.4 point increase to 6.5 (although this was still 0.2 points short of their January mark). Household inflation expectations also dropped 1.4 points to 13.9, a 4-month low.
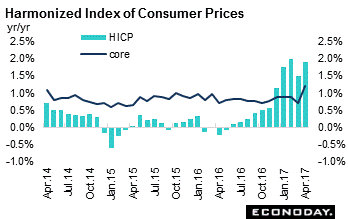 April flash harmonized index of consumer prices was up 1.9 percent from the same month a year ago, up 0.4 percentage points from its final March. The acceleration in the headline rate was at least fully matched by the two cores. Excluding energy, food, alcohol & tobacco the HICP climbed 0.5 percentage points to 1.2 percent, its highest reading in four years. Omitting just energy & unprocessed food, the rate gained 0.4 percentage points to 1.2 percent, its strongest mark since August 2013. Service sector inflation jumped from 1.0 percent to 1.8 percent while non-energy industrial goods were unchanged at 0.3 percent. Energy (7.5 percent after 7.4 percent) was similarly broadly flat but food, alcohol & tobacco dropped from 1.8 percent to 1.5 percent. April flash harmonized index of consumer prices was up 1.9 percent from the same month a year ago, up 0.4 percentage points from its final March. The acceleration in the headline rate was at least fully matched by the two cores. Excluding energy, food, alcohol & tobacco the HICP climbed 0.5 percentage points to 1.2 percent, its highest reading in four years. Omitting just energy & unprocessed food, the rate gained 0.4 percentage points to 1.2 percent, its strongest mark since August 2013. Service sector inflation jumped from 1.0 percent to 1.8 percent while non-energy industrial goods were unchanged at 0.3 percent. Energy (7.5 percent after 7.4 percent) was similarly broadly flat but food, alcohol & tobacco dropped from 1.8 percent to 1.5 percent.
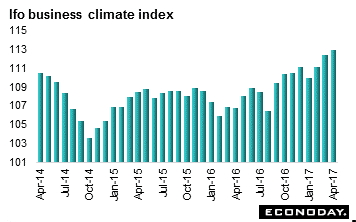 April Ifo business sentiment improved to 112.9 — its highest level in six years. However, the headline rise was wholly attributable to the current conditions component and buoyancy here masked a modest deterioration in expectations. Current conditions climbed 1.6 points to 121.1. This was its eighth consecutive increase and its strongest print since the middle of 2011. Expectations slipped 0.5 points to 105.2, their third drop in the last six months albeit still in line with a fairly flat trend since late 2016. April Ifo business sentiment improved to 112.9 — its highest level in six years. However, the headline rise was wholly attributable to the current conditions component and buoyancy here masked a modest deterioration in expectations. Current conditions climbed 1.6 points to 121.1. This was its eighth consecutive increase and its strongest print since the middle of 2011. Expectations slipped 0.5 points to 105.2, their third drop in the last six months albeit still in line with a fairly flat trend since late 2016.
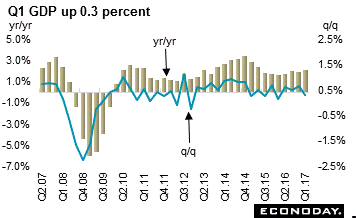
 First quarter flash gross domestic product was up 0.3 percent from the fourth quarter of 2016 when it expanded a slightly stronger revised 0.5 percent. As a result, the annual increase in total output slipped to 0.8 percent. Domestic demand accounted for 0.4 percentage points of the quarterly increase in total output despite a disappointing minimal 0.1 percent increase in household consumption. Gross fixed capital formation improved from a 0.6 percent rate to 0.9 percent within which business investment was up a solid 1.3 percent while residential investment advanced 0.9 percent. Government consumption rose 0.4 percent. Inventory accumulation added fully 0.6 percentage points to quarterly growth but this impact was more than offset by a sizeable 0.7 percentage point hit from net foreign trade as exports dropped 0.7 percent and imports jumped 1.5 percent. First quarter flash gross domestic product was up 0.3 percent from the fourth quarter of 2016 when it expanded a slightly stronger revised 0.5 percent. As a result, the annual increase in total output slipped to 0.8 percent. Domestic demand accounted for 0.4 percentage points of the quarterly increase in total output despite a disappointing minimal 0.1 percent increase in household consumption. Gross fixed capital formation improved from a 0.6 percent rate to 0.9 percent within which business investment was up a solid 1.3 percent while residential investment advanced 0.9 percent. Government consumption rose 0.4 percent. Inventory accumulation added fully 0.6 percentage points to quarterly growth but this impact was more than offset by a sizeable 0.7 percentage point hit from net foreign trade as exports dropped 0.7 percent and imports jumped 1.5 percent.
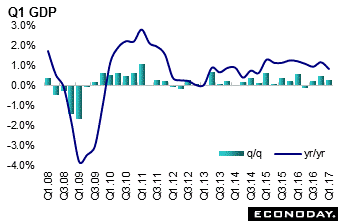
 First quarter gross domestic product was up a quarterly 0.3 percent — less than half the 0.7 percent rate recorded at the end of 2016 and the weakest since the first quarter of last year. Positive base effects saw annual growth improve from 1.9 percent to 2.1 percent. With industrial production slowing by just a tick to a 0.3 percent quarterly rate (manufacturing 0.5 percent from 1.2 percent), the headline deceleration was essentially attributable services where growth dropped from to 0.8 percent to just 0.3 percent. Within this, transport, storage & communication (down 0.2 percent after 0.8 percent) and distribution, hotels & restaurants (down 0.5 percent after 2.0 percent) applied the downward pressure and masked improvements in business services & finance (0.7 percent after 0.5 percent) and government & other services (0.5 percent after 0.3 percent). Agriculture, forestry & fishing (0.3 percent after 1.0 percent) and construction (0.2 percent after 1.0 percent) also weighed. First quarter gross domestic product was up a quarterly 0.3 percent — less than half the 0.7 percent rate recorded at the end of 2016 and the weakest since the first quarter of last year. Positive base effects saw annual growth improve from 1.9 percent to 2.1 percent. With industrial production slowing by just a tick to a 0.3 percent quarterly rate (manufacturing 0.5 percent from 1.2 percent), the headline deceleration was essentially attributable services where growth dropped from to 0.8 percent to just 0.3 percent. Within this, transport, storage & communication (down 0.2 percent after 0.8 percent) and distribution, hotels & restaurants (down 0.5 percent after 2.0 percent) applied the downward pressure and masked improvements in business services & finance (0.7 percent after 0.5 percent) and government & other services (0.5 percent after 0.3 percent). Agriculture, forestry & fishing (0.3 percent after 1.0 percent) and construction (0.2 percent after 1.0 percent) also weighed.
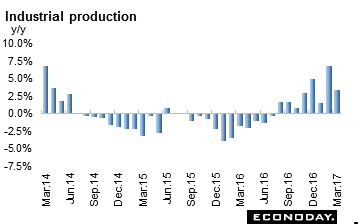 March industrial production dropped 2.1 on the month compared with an increase of 3.2 percent in February. On the year output was up 3.3 percent. The monthly increase reflected stronger output of general-purpose, production & business oriented machinery, electronic parts & devices, and transport equipment. This was offset by weaker output of pulp, paper & paper products, information & communication electronics equipment and non-ferrous metals. March industrial production dropped 2.1 on the month compared with an increase of 3.2 percent in February. On the year output was up 3.3 percent. The monthly increase reflected stronger output of general-purpose, production & business oriented machinery, electronic parts & devices, and transport equipment. This was offset by weaker output of pulp, paper & paper products, information & communication electronics equipment and non-ferrous metals.
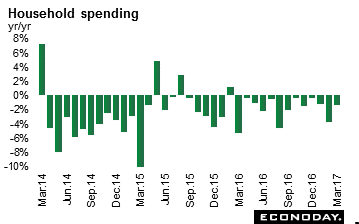 March household spending contracted 1.3 percent on the year after sinking 3.8 percent in February. Spending was 2.0 percent lower on the month after increasing 2.5 percent in February. Spending on fuel, light & water charges fell 2.0 percent on the year after contracting by 4.2 percent in February, while spending on food fell by 1.3 percent after a drop of 5.8 percent the previous month. Spending on clothing & footwear and transportation & communication also strengthened. March household spending contracted 1.3 percent on the year after sinking 3.8 percent in February. Spending was 2.0 percent lower on the month after increasing 2.5 percent in February. Spending on fuel, light & water charges fell 2.0 percent on the year after contracting by 4.2 percent in February, while spending on food fell by 1.3 percent after a drop of 5.8 percent the previous month. Spending on clothing & footwear and transportation & communication also strengthened.
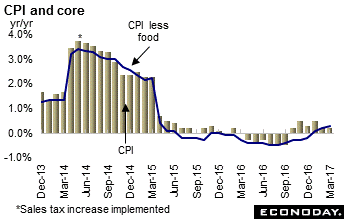 March consumer price index increased 0.2 percent on the year, down from 0.3 percent in February. Annual changes in the headline CPI have now been in positive territory for six consecutive months but remain well below the Bank of Japan's 2.0 percent inflation target. Seasonally adjusted headline CPI fell 0.1 percent on the month in March. The CPI excluding fresh food prices was up 0.2 percent on the year for a second month. March consumer price index increased 0.2 percent on the year, down from 0.3 percent in February. Annual changes in the headline CPI have now been in positive territory for six consecutive months but remain well below the Bank of Japan's 2.0 percent inflation target. Seasonally adjusted headline CPI fell 0.1 percent on the month in March. The CPI excluding fresh food prices was up 0.2 percent on the year for a second month.
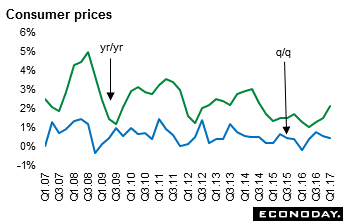 First quarter consumer price index was up 0.5 percent on the quarter and 2.1 percent from a year ago after increasing 1.5 percent in the fourth quarter of 2016. The trimmed mean measure of the CPI increased from 1.6 percent in the three months to December to 1.9 percent in the three months to March on the year while the weighted mean CPI inflation measure rose from 1.5 percent to 1.7 percent. The trimmed measure rose 0.5 percent on the quarter while the weighted measure rose 0.4 percent. Stronger headline inflation in the three months to March was largely driven by transport costs. Housing costs also rose at a stronger pace, up 2.5 percent year-on-year from 1.9 percent previously. Prices for other categories of consumer spending were relatively steady. First quarter consumer price index was up 0.5 percent on the quarter and 2.1 percent from a year ago after increasing 1.5 percent in the fourth quarter of 2016. The trimmed mean measure of the CPI increased from 1.6 percent in the three months to December to 1.9 percent in the three months to March on the year while the weighted mean CPI inflation measure rose from 1.5 percent to 1.7 percent. The trimmed measure rose 0.5 percent on the quarter while the weighted measure rose 0.4 percent. Stronger headline inflation in the three months to March was largely driven by transport costs. Housing costs also rose at a stronger pace, up 2.5 percent year-on-year from 1.9 percent previously. Prices for other categories of consumer spending were relatively steady.
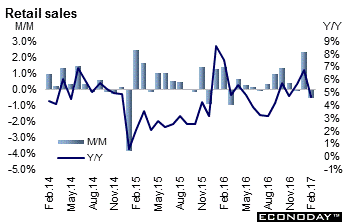 February retail sales declined a monthly 0.6 percent after increasing 2.3 percent in January. On the year, sales were up 4.7 percent after jumping 6.7 percent in February. Sales were down in five of 11 subsectors, representing 67 percent of total retail sales. Lower sales at motor vehicle & parts dealers and gasoline stations were the main contributors to the decline. Excluding these two subsectors, retail sales were up 0.5 percent. In volume terms, sales slipped 0.1 percent. Sales at motor vehicle & parts dealers were down 1.8 percent — their first decline in seven months. Gasoline stations (down 3.6 percent) posted their first sales decline in three months, largely reflecting lower prices at the pump. Food & beverage stores also declined as did building material & garden equipment & supplies dealers. Electronics & appliance stores' sales also were lower. However, health & personal care stores rose for the second month in a row. Clothing & clothing accessories stores reported a sales gain in February. E-commerce represented 2.4 percent of total sales in February, down from 2.8 percent in January but up from 2.0 percent in February 2016. February retail sales declined a monthly 0.6 percent after increasing 2.3 percent in January. On the year, sales were up 4.7 percent after jumping 6.7 percent in February. Sales were down in five of 11 subsectors, representing 67 percent of total retail sales. Lower sales at motor vehicle & parts dealers and gasoline stations were the main contributors to the decline. Excluding these two subsectors, retail sales were up 0.5 percent. In volume terms, sales slipped 0.1 percent. Sales at motor vehicle & parts dealers were down 1.8 percent — their first decline in seven months. Gasoline stations (down 3.6 percent) posted their first sales decline in three months, largely reflecting lower prices at the pump. Food & beverage stores also declined as did building material & garden equipment & supplies dealers. Electronics & appliance stores' sales also were lower. However, health & personal care stores rose for the second month in a row. Clothing & clothing accessories stores reported a sales gain in February. E-commerce represented 2.4 percent of total sales in February, down from 2.8 percent in January but up from 2.0 percent in February 2016.
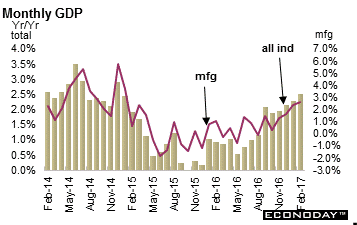 Monthly gross domestic product was unchanged in February following three months of growth. Gains in service-producing industries were offset by declines in goods-producing industries. When compared with a year ago, monthly GDP was up 2.5 percent. Services were up a monthly 0.2 percent following a 0.5 percent gain in January, the highest monthly growth rate since January 2013. Goods producing industries however were down for the first time since October, declining 0.3 percent. Excluding manufacturing, GDP edged up 0.1 percent on the month. The real estate & rental & leasing advanced mainly as a result of notable gains in activity in and around the Greater Toronto Area. The finance & insurance sector was up for the fourth month in a row. Construction was the only major goods category to post an increase with a 0.5 percent gain on the month. The manufacturing sector declined 0.6 percent after growing in seven of the previous eight months. The majority of subsectors declined across both durable and non-durable manufacturing. Oil and gas extraction was unchanged on the month. The retail sector was unchanged in February after expanding 1.5 percent in January. Monthly gross domestic product was unchanged in February following three months of growth. Gains in service-producing industries were offset by declines in goods-producing industries. When compared with a year ago, monthly GDP was up 2.5 percent. Services were up a monthly 0.2 percent following a 0.5 percent gain in January, the highest monthly growth rate since January 2013. Goods producing industries however were down for the first time since October, declining 0.3 percent. Excluding manufacturing, GDP edged up 0.1 percent on the month. The real estate & rental & leasing advanced mainly as a result of notable gains in activity in and around the Greater Toronto Area. The finance & insurance sector was up for the fourth month in a row. Construction was the only major goods category to post an increase with a 0.5 percent gain on the month. The manufacturing sector declined 0.6 percent after growing in seven of the previous eight months. The majority of subsectors declined across both durable and non-durable manufacturing. Oil and gas extraction was unchanged on the month. The retail sector was unchanged in February after expanding 1.5 percent in January.
Most equity indexes were higher for the week and in April. Both the Bank of Japan and the European Central Bank refrained from changing their respective monetary policies. First quarter growth disappointed in France, the UK and U.S. Consumer confidence remains high globally.
The Reserve Bank of Australia announces its monetary policy Tuesday while the Federal Reserve announces on Wednesday. No policy changes are expected. The outpouring of manufacturing and composite PMIs begins Tuesday. Canada posts March merchandise trade data — given comments regarding Nafta, investors will be looking closely at the trade balance between the U.S. and Canada. On Friday, both the U.S. and Canada will update their employment data for April.
| Central Bank activities |
|
| May 2 |
Australia |
Reserve Bank of Australia Monetary Policy Announcement |
| May 2 & 3 |
United States |
FOMC Meeting and Monetary Policy Announcement |
| |
|
|
| The following indicators will be released this week... |
| Europe |
|
|
| May 2 |
Eurozone |
Manufacturing PMI (April) |
|
|
Unemployment Rate (March) |
|
Germany |
Manufacturing PMI (April) |
|
France |
Manufacturing PMI (April) |
|
UK |
Manufacturing PMI (April) |
| May 3 |
Eurozone |
Gross Domestic Product (Q1.2017 flash) |
|
|
Producer Price Index (March) |
| May 4 |
Eurozone |
Retail Sales (February) |
|
Eurozone |
Composite & Services PMI (April) |
|
Germany |
Composite & Services PMI (April) |
|
France |
Composite & Services PMI (April) |
|
UK |
Services PMI (April) |
| |
|
|
| Asia Pacific |
|
|
| May 1 |
Japan |
Manufacturing PMI (April) |
| May 2 |
China |
Manufacturing PMI (April) |
| May 3 |
Japan |
Services PMI (April) |
| May 4 |
Australia |
Merchandise Trade Balance (March) |
| |
|
|
| Americas |
|
|
| May 4 |
Canada |
Merchandise Trade Balance (March) |
| May 5 |
Canada |
Labour Force Survey (April) |
Anne D Picker is the author of International Economic Indicators and Central Banks.
|
