|
Investors focused on China and its falling equity market and currency last week. Little attention was given to what is usually the major event of a month's first week, namely the U.S. employment situation report. For a while Friday morning, investors did pay attention to the much better than anticipated report. However, that did not last and equities in Europe ended the week on a dour note while U.S. investors could not decide which way to go — To buy? To sell? In any event, all indexes tracked here globally retreated for the week. It reminded many of last summer when the yuan fixing dropped and the Shanghai Composite plunged.
| |
|
2015 |
2015-2016 |
% Change |
|
Index |
Dec 31 |
Dec 31 |
Jan 8 |
Week |
2016 |
| Asia/Pacific |
|
|
|
|
|
|
| Australia |
All Ordinaries |
5344.6 |
5344.6 |
5049.41 |
-5.5% |
-5.5% |
| Japan |
Nikkei 225 |
19033.7 |
19033.7 |
17697.96 |
-7.0% |
-7.0% |
| Hong Kong |
Hang Seng |
21914.4 |
21914.4 |
20453.71 |
-6.7% |
-6.7% |
| S. Korea |
Kospi |
1961.3 |
1961.3 |
1917.62 |
-2.2% |
-2.2% |
| Singapore |
STI |
2882.7 |
2882.7 |
2751.23 |
-4.6% |
-4.6% |
| China |
Shanghai Composite |
3539.2 |
3539.2 |
3186.41 |
-10.0% |
-10.0% |
|
|
|
|
|
|
|
| India |
Sensex 30 |
26117.5 |
26117.5 |
24934.33 |
-4.5% |
-4.5% |
| Indonesia |
Jakarta Composite |
4593.0 |
4593.0 |
4546.29 |
-1.0% |
-1.0% |
| Malaysia |
KLCI |
1692.5 |
1692.5 |
1657.61 |
-2.1% |
-2.1% |
| Philippines |
PSEi |
6952.1 |
6952.1 |
6575.43 |
-5.4% |
-5.4% |
| Taiwan |
Taiex |
8338.1 |
8338.1 |
7893.97 |
-5.3% |
-5.3% |
| Thailand |
SET |
1288.0 |
1288.0 |
1244.18 |
-3.4% |
-3.4% |
|
|
|
|
|
|
|
| Europe |
|
|
|
|
|
|
| UK |
FTSE 100 |
6242.3 |
6242.3 |
5912.44 |
-5.3% |
-5.3% |
| France |
CAC |
4637.1 |
4637.1 |
4333.76 |
-6.5% |
-6.5% |
| Germany |
XETRA DAX |
10743.0 |
10743.0 |
9849.34 |
-8.3% |
-8.3% |
| Italy |
FTSE MIB |
21418.4 |
21418.4 |
19869.49 |
-7.2% |
-7.2% |
| Spain |
IBEX 35 |
9544.2 |
9544.2 |
8909.20 |
-6.7% |
-6.7% |
| Sweden |
OMX Stockholm 30 |
1446.8 |
1446.8 |
1348.76 |
-6.8% |
-6.8% |
| Switzerland |
SMI |
8818.1 |
8818.1 |
8257.28 |
-6.4% |
-6.4% |
|
|
|
|
|
|
|
| North America |
|
|
|
|
|
|
| United States |
Dow |
17425.0 |
17425.0 |
16346.45 |
-6.2% |
-6.2% |
|
NASDAQ |
5007.4 |
5007.4 |
4643.63 |
-7.3% |
-7.3% |
|
S&P 500 |
2043.9 |
2043.9 |
1922.03 |
-6.0% |
-6.0% |
| Canada |
S&P/TSX Comp. |
13010.0 |
13010.0 |
12445.45 |
-4.3% |
-4.3% |
| Mexico |
Bolsa |
42977.5 |
42977.5 |
40265.370 |
-6.3% |
-6.3% |
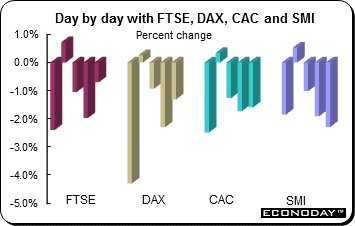 Equities dropped last week despite positive economic news. Unemployment is improving, economic sentiment is rising and the purchasing managers' indexes suggest growth is accelerating. However, anxiety over global growth more than offset the improved data. The FTSE dropped 5.3 percent, the CAC declined 6.5 percent, the DAX lost 8.3 percent and the SMI was 6.4 percent lower. The DAX slid under the 10,000 level for the first time since the beginning of October 2015. Some compared this past week to the summer of 2015 when a meltdown in Chinese stocks and fears over depreciation of the yuan took a heavy toll on European shares. Equities dropped last week despite positive economic news. Unemployment is improving, economic sentiment is rising and the purchasing managers' indexes suggest growth is accelerating. However, anxiety over global growth more than offset the improved data. The FTSE dropped 5.3 percent, the CAC declined 6.5 percent, the DAX lost 8.3 percent and the SMI was 6.4 percent lower. The DAX slid under the 10,000 level for the first time since the beginning of October 2015. Some compared this past week to the summer of 2015 when a meltdown in Chinese stocks and fears over depreciation of the yuan took a heavy toll on European shares.
At week's end, European markets were up solidly in early trading after the Chinese stock market bounced back from Thursday's steep decline and early trading halt. The stronger than expected U.S. employment report for December also contributed to the positive mood among investors. However, those early gains quickly eroded and the European markets ended the session in the red. Crude oil prices, which had been up in early trade Friday, reversed as the session wore on and slipped back near 12-year lows. Investors also cashed in profits after a tumultuous week of trading.
On Thursday, more than £30 billion were wiped off British blue chips after China allowed its currency to weaken faster than before, rocking global markets and sending commodity shares to their lowest levels for about a decade. However, the index ended off of its lows after China suspended a circuit breaker on its stock market that traders said was causing — rather than preventing — volatility. According to some analysts, this week was similar to August and September of 2015. They said that most of the damage is not the fact that the Chinese economy is continuing to struggle to turn things around, but rather the uncertainty going forward in regards to how much the yuan will be devalued.
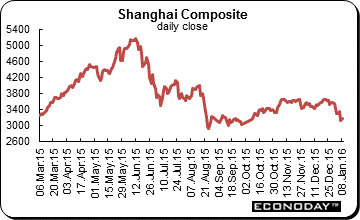
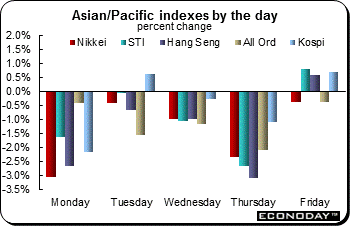 Equities tumbled last week, initially thanks to disappointing data from China that indicated the economy has continued to weaken. The yuan retreated in value against the U.S. dollar adding to investors' misery. China's problems were internally generated as officials attempted to prop up plunging share prices. Equity trading was forced to close down on two separate days when a new automatic circuit breaker designed to put a floor under equities shut markets down. All equity indexes declined on the week. The Shanghai Composite sank 10.0 percent, the Nikkei tumbled 7.0 percent and the Hang Seng lost 6.7 percent. Equities tumbled last week, initially thanks to disappointing data from China that indicated the economy has continued to weaken. The yuan retreated in value against the U.S. dollar adding to investors' misery. China's problems were internally generated as officials attempted to prop up plunging share prices. Equity trading was forced to close down on two separate days when a new automatic circuit breaker designed to put a floor under equities shut markets down. All equity indexes declined on the week. The Shanghai Composite sank 10.0 percent, the Nikkei tumbled 7.0 percent and the Hang Seng lost 6.7 percent.
A downbeat Chinese manufacturing report first sent stocks spiraling on Monday, prompting the country's market to close early. It also set off a global rout with stocks in Europe and the United States getting hit. Since then, investors have remained been unnerved. A new rule instituted during the summer's collapse in stocks was due to expire Friday. However, state media said the ban on short sales would remain in place until the China Securities Regulatory Commission (CSRC) implements a new policy to manage the pace of stakeholder sales. This provided momentary relief to investors. Then China's securities regulator suspended the market's new circuit breaker mechanism and the People's Bank of China guided the yuan a shade higher for the first time in nine days, helping to prop up shares. Still, on the week the Shanghai Composite was down 10.0 percent and the Hang Seng retreated 6.7 percent. It should be noted that Friday's gain was supported by buying from state controlled funds and the steadying yuan.
 Still investors face plenty of restrictions in how they trade. Rules limit daily moves by individual stocks to 10 percent, while investors aren't allowed to buy and sell the same shares in a day. Curbs on trading in what was the world's most active index futures market have cut volumes by 99 percent from the peak, making it harder to implement hedging strategies. Daily and aggregate quotas limit trading by foreign investors. Some analysts say that investors should expect more volatility in Chinese markets as the government attempts to shift away from a planned economy to one driven by market forces. Still investors face plenty of restrictions in how they trade. Rules limit daily moves by individual stocks to 10 percent, while investors aren't allowed to buy and sell the same shares in a day. Curbs on trading in what was the world's most active index futures market have cut volumes by 99 percent from the peak, making it harder to implement hedging strategies. Daily and aggregate quotas limit trading by foreign investors. Some analysts say that investors should expect more volatility in Chinese markets as the government attempts to shift away from a planned economy to one driven by market forces.
On Thursday, Chinese stocks by more than 7 percent, forcing officials for the second time in the week to halt trading for the day — this time after just 29 minutes. The big question now is how much of the continuing turmoil might eventually prove to have more to do with the internal dynamics of the Chinese market, where the first wave of sell-offs began last summer, or how much is based on broader economic fundamentals that will have a further impact on global growth. China's economy has also been steadily slowing, making it a less attractive place to invest. Fourth quarter growth, which will be reported later this month, is expected to be 6.9 percent, although some economists have expressed skepticism about the reliability of such figures.
The U.S. dollar was mixed in the first week of January. The currency advanced against the pound and the commodity currencies — the Canadian and Australian dollars. However, the U.S. dollar retreated against the euro, Swiss franc and the yen.
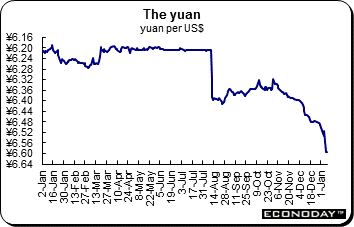 China ended an eight day run of lower values to the yuan's reference rate on Friday. The declines sent shockwaves through financial markets and escalated fears of a global currency war. The People's Bank of China set the daily fixing, which restricts onshore moves to a maximum 2 percent on either side, 0.02 percent stronger than the previous day's reference rate. The offshore yuan fell 0.03 percent to 6.6843 a dollar as of 4.03 p.m. Friday in London, according to data compiled by Bloomberg. The currency started trading in Hong Kong in the third quarter of 2010. The onshore rate was little changed at 6.5938 in Shanghai on Friday. The PBoC has weakened its daily fixing by 2.6 percent since winning entry into the International Monetary Fund's reserves basket on November 30. China ended an eight day run of lower values to the yuan's reference rate on Friday. The declines sent shockwaves through financial markets and escalated fears of a global currency war. The People's Bank of China set the daily fixing, which restricts onshore moves to a maximum 2 percent on either side, 0.02 percent stronger than the previous day's reference rate. The offshore yuan fell 0.03 percent to 6.6843 a dollar as of 4.03 p.m. Friday in London, according to data compiled by Bloomberg. The currency started trading in Hong Kong in the third quarter of 2010. The onshore rate was little changed at 6.5938 in Shanghai on Friday. The PBoC has weakened its daily fixing by 2.6 percent since winning entry into the International Monetary Fund's reserves basket on November 30.
Data on Thursday showed China's foreign exchange reserves fell by the most on record last month, down $108 billion in December alone and by $513 billion overall last year. That suggests an accelerating outflow of money from China which may largely be the result of the opening up of its financial markets over the past year, but also a sign that China may be in deepening trouble.
|
|
2015 |
2015-2016 |
% Change |
|
|
Dec 31 |
Dec 31 |
Jan 8 |
Week |
2016 |
| U.S. $ per currency |
|
|
|
|
|
|
| Australia |
A$ |
0.7288 |
0.7288 |
0.698 |
-4.3% |
-4.3% |
| New Zealand |
NZ$ |
0.6833 |
0.6833 |
0.655 |
-4.1% |
-4.1% |
| Canada |
C$ |
0.7231 |
0.7231 |
0.707 |
-2.2% |
-2.2% |
| Eurozone |
euro (€) |
1.0871 |
1.0871 |
1.092 |
0.5% |
0.5% |
| UK |
pound sterling (£) |
1.4742 |
1.4742 |
1.452 |
-1.5% |
-1.5% |
|
|
|
|
|
|
|
| Currency per U.S. $ |
|
|
|
|
|
|
| China |
yuan |
6.4937 |
6.4937 |
6.595 |
-1.5% |
-1.5% |
| Hong Kong |
HK$* |
7.7501 |
7.7501 |
7.765 |
-0.2% |
-0.2% |
| India |
rupee |
66.1537 |
66.1537 |
66.635 |
-0.7% |
-0.7% |
| Japan |
yen |
120.2068 |
120.2068 |
117.510 |
2.3% |
2.3% |
| Malaysia |
ringgit |
4.2943 |
4.2943 |
4.392 |
-2.2% |
-2.2% |
| Singapore |
Singapore $ |
1.4179 |
1.4179 |
1.443 |
-1.7% |
-1.7% |
| South Korea |
won |
1175.0600 |
1175.06 |
1197.840 |
-1.9% |
-1.9% |
| Taiwan |
Taiwan $ |
32.8620 |
32.862 |
33.344 |
-1.4% |
-1.4% |
| Thailand |
baht |
36.0100 |
36.01 |
36.378 |
-1.0% |
-1.0% |
| Switzerland |
Swiss franc |
1.0014 |
1.0014 |
0.9946 |
0.7% |
0.7% |
| *Pegged to U.S. dollar |
|
|
|
|
|
|
| Source: Bloomberg |
|
|
|
|
|
|
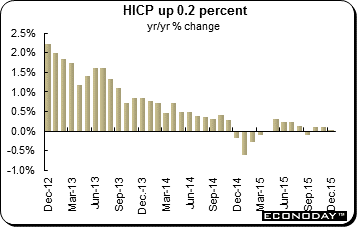 December flash harmonized index of consumer prices was up 0.2 percent on the year. A rise in the annual inflation rate in energy from minus 7.3 percent to minus 5.9 percent contrasted with a drop in food, alcohol & tobacco from 1.5 percent to 1.2 percent. Non-energy industrial goods saw no change at 0.5 percent while overall services dipped a tick to 1.1 percent. Excluding food, alcohol, tobacco & energy, inflation was flat at 0.9 percent and omitting just unprocessed food & energy it was 0.1 percentage points lower at 0.8 percent. December flash harmonized index of consumer prices was up 0.2 percent on the year. A rise in the annual inflation rate in energy from minus 7.3 percent to minus 5.9 percent contrasted with a drop in food, alcohol & tobacco from 1.5 percent to 1.2 percent. Non-energy industrial goods saw no change at 0.5 percent while overall services dipped a tick to 1.1 percent. Excluding food, alcohol, tobacco & energy, inflation was flat at 0.9 percent and omitting just unprocessed food & energy it was 0.1 percentage points lower at 0.8 percent.
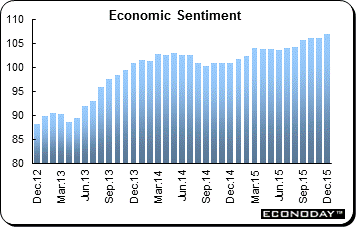 December EU Commission's measure of economic sentiment (ESI) climbed 0.7 points from an unrevised November to 106.8, its highest reading since April 2011. This was the fifth increase in the last six months. The latest advance was led by improving morale in industry where the sub-index climbed from minus 3.2 to minus 2.0. Consumer sentiment edged 0.2 points firmer to minus 5.7 and service sector confidence was also up 0.2 points at 13.1. Sentiment in construction similarly gained 0.2 points to minus 17.6 but retail registered an ominous decline from 5.6 to 2.8, its lowest value since July. Among the larger member states, the ESI in Spain climbed more than 3 points to 112.4 while Italy posted a 0.4 point rise to 109.8. However, Germany was only flat at 106.9 and France recorded a 0.1 point slip to 102.5, its second consecutive decline. Selling price expectations in manufacturing fell from minus 0.7 to a 3-month low of minus 3.0 while services saw a 1.5 point drop to 2.8, their softest reading since August. Consumer sector inflation expectations at least held up rather better although even here the sub-index dipped 0.1 points to 3.6. December EU Commission's measure of economic sentiment (ESI) climbed 0.7 points from an unrevised November to 106.8, its highest reading since April 2011. This was the fifth increase in the last six months. The latest advance was led by improving morale in industry where the sub-index climbed from minus 3.2 to minus 2.0. Consumer sentiment edged 0.2 points firmer to minus 5.7 and service sector confidence was also up 0.2 points at 13.1. Sentiment in construction similarly gained 0.2 points to minus 17.6 but retail registered an ominous decline from 5.6 to 2.8, its lowest value since July. Among the larger member states, the ESI in Spain climbed more than 3 points to 112.4 while Italy posted a 0.4 point rise to 109.8. However, Germany was only flat at 106.9 and France recorded a 0.1 point slip to 102.5, its second consecutive decline. Selling price expectations in manufacturing fell from minus 0.7 to a 3-month low of minus 3.0 while services saw a 1.5 point drop to 2.8, their softest reading since August. Consumer sector inflation expectations at least held up rather better although even here the sub-index dipped 0.1 points to 3.6.
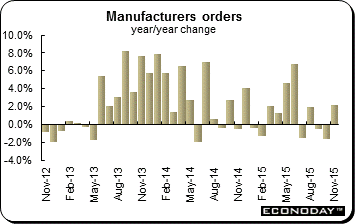 November manufacturing orders were up 1.5 percent on the month. The increase, which followed a marginally smaller 1.7 percent gain in October, saw the first back-to-back rise since March/April and boosted annual growth from minus 1.6 percent to 2.2 percent, their best performance since June. The monthly headline bounce wholly reflected a 4.8 percent rebound in basics and would have been stronger still but for declines in both capital goods (0.1 percent) and consumer & durable goods (2.4 percent). The latest advance was led by the domestic market where a 6.0 percent spurt in basics was enough to ensure a 2.6 percent overall increase following a 1.4 percent rise last time. Overseas demand expanded a more modest 0.6 percent after a 1.9 percent advance. November manufacturing orders were up 1.5 percent on the month. The increase, which followed a marginally smaller 1.7 percent gain in October, saw the first back-to-back rise since March/April and boosted annual growth from minus 1.6 percent to 2.2 percent, their best performance since June. The monthly headline bounce wholly reflected a 4.8 percent rebound in basics and would have been stronger still but for declines in both capital goods (0.1 percent) and consumer & durable goods (2.4 percent). The latest advance was led by the domestic market where a 6.0 percent spurt in basics was enough to ensure a 2.6 percent overall increase following a 1.4 percent rise last time. Overseas demand expanded a more modest 0.6 percent after a 1.9 percent advance.
 November industrial production was down 0.3 percent after an upwardly revised 0.5 percent October gain. However, this was the third contraction in the last four months and enough to see annual growth slip to zero from 0.5 percent last time. The monthly headline decline was dominated by a 3.3 percent plunge in capital goods which masked gains elsewhere. Intermediates posted a 1.1 percent increase, consumer goods were up 1.9 percent and energy 2.5 percent. Construction registered a second consecutive 1.6 percent increase. November industrial production was down 0.3 percent after an upwardly revised 0.5 percent October gain. However, this was the third contraction in the last four months and enough to see annual growth slip to zero from 0.5 percent last time. The monthly headline decline was dominated by a 3.3 percent plunge in capital goods which masked gains elsewhere. Intermediates posted a 1.1 percent increase, consumer goods were up 1.9 percent and energy 2.5 percent. Construction registered a second consecutive 1.6 percent increase.
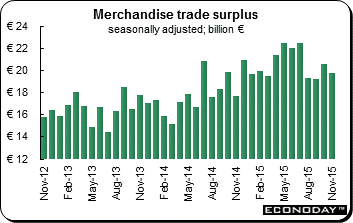 November seasonally adjusted trade surplus was €19.7 billion after a slightly smaller revised €20.5 billion excess in October. The limited headline deterioration reflected a 0.4 percent monthly rise in exports that was more than offset by a 1.6 percent bounce in imports. Compared with a year ago, the former expanded 7.7 percent and the latter 5.3 percent. November seasonally adjusted trade surplus was €19.7 billion after a slightly smaller revised €20.5 billion excess in October. The limited headline deterioration reflected a 0.4 percent monthly rise in exports that was more than offset by a 1.6 percent bounce in imports. Compared with a year ago, the former expanded 7.7 percent and the latter 5.3 percent.
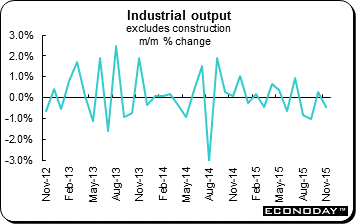
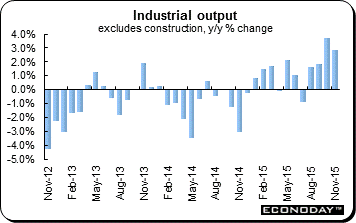 November industrial production excluding construction contracted 0.9 percent on the month. October's increase was revised up to a very respectable 0.7 percent but the mid-quarter decline was still enough to cut annual growth from 3.7 percent to 2.8 percent. The terrorist attacks in Paris around the middle of the month may have had a limited impact. However, what was the first fall in production since July largely reflected weakness in the volatile refining subsector where output slumped a monthly 7.7 percent. Outside of electronics (down 0.5 percent), the news was a good deal brighter with gains in transport equipment (0.3 percent), food and agriculture (0.1 percent) and, in particular, the other manufactured goods category (1.0 percent). Indeed, manufacturing output was up 0.4 percent which essentially reversed October's decline. Elsewhere, the erratic energy and extracted goods subsector decreased 6.7 percent but construction was up 0.2 percent. November industrial production excluding construction contracted 0.9 percent on the month. October's increase was revised up to a very respectable 0.7 percent but the mid-quarter decline was still enough to cut annual growth from 3.7 percent to 2.8 percent. The terrorist attacks in Paris around the middle of the month may have had a limited impact. However, what was the first fall in production since July largely reflected weakness in the volatile refining subsector where output slumped a monthly 7.7 percent. Outside of electronics (down 0.5 percent), the news was a good deal brighter with gains in transport equipment (0.3 percent), food and agriculture (0.1 percent) and, in particular, the other manufactured goods category (1.0 percent). Indeed, manufacturing output was up 0.4 percent which essentially reversed October's decline. Elsewhere, the erratic energy and extracted goods subsector decreased 6.7 percent but construction was up 0.2 percent.
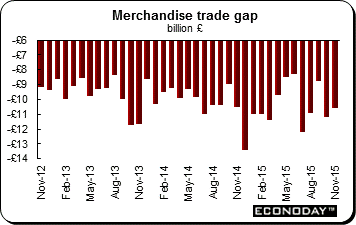 November deficit on global trade in goods was Stg10.64 billion, down from a smaller revised Stg11.20 billion in October. November's shrinkage was mainly due to weaker imports which declined a monthly 2.5 percent, largely because of a near-18 percent drop in purchases of oil. Exports were down a smaller 1.3 percent but this followed a 2.9 percent decline last time. As a result, the deficit excluding oil and other erratic items narrowed only marginally, from Stg10.47 billion to Stg10.26 billion which was still the third worst reading of the year to date. Despite the stubbornly high nominal shortfall, underlying trends in real net exports were positive. Hence, core export volumes over the last three months were up 0.4 percent while imports were off 1.6 percent. November deficit on global trade in goods was Stg10.64 billion, down from a smaller revised Stg11.20 billion in October. November's shrinkage was mainly due to weaker imports which declined a monthly 2.5 percent, largely because of a near-18 percent drop in purchases of oil. Exports were down a smaller 1.3 percent but this followed a 2.9 percent decline last time. As a result, the deficit excluding oil and other erratic items narrowed only marginally, from Stg10.47 billion to Stg10.26 billion which was still the third worst reading of the year to date. Despite the stubbornly high nominal shortfall, underlying trends in real net exports were positive. Hence, core export volumes over the last three months were up 0.4 percent while imports were off 1.6 percent.
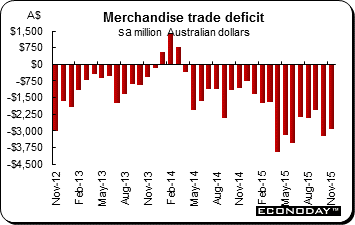 November trade deficit narrowed to A$2.906 billion from a revised A$3.247 billion. It was the 20th monthly trade deficit in a row as the resource-dependent nation suffers from a steep decline in key commodity prices, while a weaker Australian dollar pushes up the costs of some imports. Exports declined 1.1 percent on the year while imports were up 5.4 percent from a year ago. Intermediate and other merchandise goods imports were down 2 percent while capital goods imports were up 1 percent and consumption goods were up 1 percent. November trade deficit narrowed to A$2.906 billion from a revised A$3.247 billion. It was the 20th monthly trade deficit in a row as the resource-dependent nation suffers from a steep decline in key commodity prices, while a weaker Australian dollar pushes up the costs of some imports. Exports declined 1.1 percent on the year while imports were up 5.4 percent from a year ago. Intermediate and other merchandise goods imports were down 2 percent while capital goods imports were up 1 percent and consumption goods were up 1 percent.
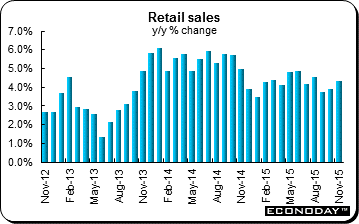 November retail sales were up 0.4 percent on the month as expected and 4.3 percent from the same month a year ago. Seasonally adjusted food sales were up 0.2 percent, household goods were up 0.9 percent, and both cafes, restaurants & takeaway food services were up 1.0 percent and clothing, footwear & personal accessories were up 0.8 percent. Retail sales were up in Queensland (0.8 percent), Victoria (0.5 percent), New South Wales (0.2 percent), Western Australia (0.3 percent), South Australia (0.4 percent), the Australian Capital Territory (0.9 percent), Tasmania (0.3 percent) and the Northern Territory (0.4 percent). November retail sales were up 0.4 percent on the month as expected and 4.3 percent from the same month a year ago. Seasonally adjusted food sales were up 0.2 percent, household goods were up 0.9 percent, and both cafes, restaurants & takeaway food services were up 1.0 percent and clothing, footwear & personal accessories were up 0.8 percent. Retail sales were up in Queensland (0.8 percent), Victoria (0.5 percent), New South Wales (0.2 percent), Western Australia (0.3 percent), South Australia (0.4 percent), the Australian Capital Territory (0.9 percent), Tasmania (0.3 percent) and the Northern Territory (0.4 percent).
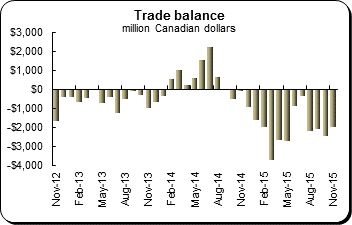 November merchandise trade deficit was C$1.99 billion following a downwardly revised C$2.49 billion shortfall in October. This was the 14th consecutive month that the balance has been in the red but the first sub-C$2 billion deficit since July. November's improvement reflected a 0.4 percent monthly gain in exports, compounded by a 0.7 percent decline in imports. Exports to the U.S. were up 1.3 percent which, with imports from across the border 0.1 percent lower, put the bilateral surplus at C$2.11 billion after a C$1.68 billion excess last time. The overall monthly rise in exports was led by motor vehicles & parts (5.9 percent) and metal ores & non-metallic minerals (20.4 percent) and basic & industrial chemical, plastic & rubber products (2.4 percent). Forestry products & building & packaging materials (5.5 percent) also had a good month but energy products dropped again (6.6 percent). Imports were held in check by a sharp drop in metal ores & non-metallic minerals (11.0 percent) together with smaller declines in energy (6.4 percent) and electronic & electrical equipment & parts (2.9 percent). The real trade balance also strengthened as export volumes expanded 0.7 percent from October and constant price imports declined a sizeable1.6 percent. November merchandise trade deficit was C$1.99 billion following a downwardly revised C$2.49 billion shortfall in October. This was the 14th consecutive month that the balance has been in the red but the first sub-C$2 billion deficit since July. November's improvement reflected a 0.4 percent monthly gain in exports, compounded by a 0.7 percent decline in imports. Exports to the U.S. were up 1.3 percent which, with imports from across the border 0.1 percent lower, put the bilateral surplus at C$2.11 billion after a C$1.68 billion excess last time. The overall monthly rise in exports was led by motor vehicles & parts (5.9 percent) and metal ores & non-metallic minerals (20.4 percent) and basic & industrial chemical, plastic & rubber products (2.4 percent). Forestry products & building & packaging materials (5.5 percent) also had a good month but energy products dropped again (6.6 percent). Imports were held in check by a sharp drop in metal ores & non-metallic minerals (11.0 percent) together with smaller declines in energy (6.4 percent) and electronic & electrical equipment & parts (2.9 percent). The real trade balance also strengthened as export volumes expanded 0.7 percent from October and constant price imports declined a sizeable1.6 percent.
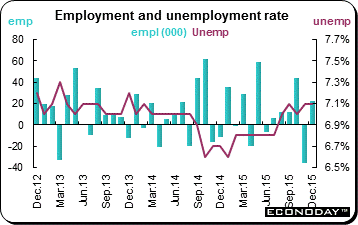 December employment jumped 22,800 after a surprisingly sharp contraction in November. Unemployment remained at 7.1 percent while the participation rate edged up to 65.9. The increase in jobs was wholly attributable to part-time positions which gained 29,200. By contrast, full-time headcount was down 6,400. Moreover, private sector payrolls shrank 9,000 and the public sector shed 8,400 leaving a 40,300 jump in the number of self-employed as the sole source of support. At a sector level, services added 22,800 but goods producing industries posted a 300 decline despite a 6,100 rise in manufacturing. Agriculture (down 7,900) and construction (down 2,800) were the main areas of weakness here. Services were buoyed by education (15,400), heath care & social assistance (16,500) and finance, insurance, real estate & leasing (10,300). Professional, scientific & technical services (9,000) also had a good month. Partial offsets came via accommodation and food (down 14,400) and trade (down 8,600). December employment jumped 22,800 after a surprisingly sharp contraction in November. Unemployment remained at 7.1 percent while the participation rate edged up to 65.9. The increase in jobs was wholly attributable to part-time positions which gained 29,200. By contrast, full-time headcount was down 6,400. Moreover, private sector payrolls shrank 9,000 and the public sector shed 8,400 leaving a 40,300 jump in the number of self-employed as the sole source of support. At a sector level, services added 22,800 but goods producing industries posted a 300 decline despite a 6,100 rise in manufacturing. Agriculture (down 7,900) and construction (down 2,800) were the main areas of weakness here. Services were buoyed by education (15,400), heath care & social assistance (16,500) and finance, insurance, real estate & leasing (10,300). Professional, scientific & technical services (9,000) also had a good month. Partial offsets came via accommodation and food (down 14,400) and trade (down 8,600).
Equities got off to a poor start in 2016. However, there was a surprising number of positive economic surprises during the week which were largely ignored as investors obsessed about China.
The Bank of England will make its monetary policy announcement Thursday. No policy changes are expected. The Federal Reserve will publish its Beige Book in preparation for its FOMC meeting later this month. Industrial production for November will be released by the UK, Eurozone, Italy and India. Australia posts December employment and unemployment. Investors will likely keep an eye on the continuing festering political situation in the Middle East and the price of crude.
| Central Bank activities |
|
| January 13 |
United States |
Federal Reserve Beige Book Published |
| January 14 |
UK |
Bank of England Monetary Policy Announcement |
| |
|
|
| The following indicators will be released this week... |
| Europe |
|
|
| January 12 |
UK |
Industrial Production (November) |
| January 13 |
Eurozone |
Industrial Production (November) |
| January 14 |
Italy |
Industrial Production (November) |
| January 15 |
Eurozone |
Merchandise Trade (November) |
| |
|
|
| Asia/Pacific |
|
|
| January 12 |
India |
Industrial Production (November) |
|
|
Consumer Price Index (December) |
| January 14 |
Japan |
Producer Price Index (December) |
|
|
Machine Orders (November) |
|
Australia |
Labour Force Survey (December) |
| |
|
|
| Americas |
|
|
| January 11 |
Canada |
Housing Starts (December) |
Anne D Picker is the author of International Economic Indicators and Central Banks.
|
