|
Most equity indexes declined last week as they struggled to regain traction at week's end. Concerns about the recent run-up in equity prices were exacerbated by a renewed uncertainty about Eurozone banks. Additional uncertainties emanated from U.S. markets as earnings season began and valuation worries once again surfaced. Minutes of the most recent FOMC meeting soothed concerns on signs that the Fed is in no hurry to alter its monetary policy. On Thursday, concerns about Portugal's Banco Espírito once again raised concerns about systemic risks to peripheral Eurozone lenders. However, Thursday's unease was replaced Friday by a relative calm.
|
|
2013 |
2014 |
% Change |
|
Index |
31-Dec |
July 4 |
July 11 |
Week |
2014 |
| Asia/Pacific |
|
|
|
|
|
|
| Australia |
All Ordinaries |
5353.1 |
5511.8 |
5474.6 |
-0.7% |
2.3% |
| Japan |
Nikkei 225 |
16291.3 |
15437.1 |
15164.0 |
-1.8% |
-6.9% |
| Hong Kong |
Hang Seng |
23306.4 |
23546.4 |
23233.5 |
-1.3% |
-0.3% |
| S. Korea |
Kospi |
2011.3 |
2009.7 |
1988.7 |
-1.0% |
-1.1% |
| Singapore |
STI |
3167.4 |
3272.3 |
3293.7 |
0.7% |
4.0% |
| China |
Shanghai Composite |
2116.0 |
2059.4 |
2047.0 |
-0.6% |
-3.3% |
|
|
|
|
|
|
|
| India |
Sensex 30 |
21170.7 |
25962.1 |
25024.4 |
-3.6% |
18.2% |
| Indonesia |
Jakarta Composite |
4274.2 |
4905.8 |
5032.6 |
2.6% |
17.7% |
| Malaysia |
KLCI |
1867.0 |
1884.9 |
1883.2 |
-0.1% |
0.9% |
| Philippines |
PSEi |
5889.8 |
6962.3 |
6901.09 |
-0.9% |
17.2% |
| Taiwan |
Taiex |
8611.5 |
9510.1 |
9495.8 |
-0.1% |
10.3% |
| Thailand |
SET |
1298.7 |
1495.8 |
1518.0 |
1.5% |
16.9% |
|
|
|
|
|
|
|
| Europe |
|
|
|
|
|
|
| UK |
FTSE 100 |
6749.1 |
6866.1 |
6690.2 |
-2.6% |
-0.9% |
| France |
CAC |
4296.0 |
4469.0 |
4316.5 |
-3.4% |
0.5% |
| Germany |
XETRA DAX |
9552.2 |
10009.1 |
9666.3 |
-3.4% |
1.2% |
| Italy |
FTSE MIB |
18967.7 |
21559.2 |
20614.9 |
-4.4% |
8.7% |
| Spain |
IBEX 35 |
9916.7 |
11009.4 |
10538.8 |
-4.3% |
6.3% |
| Sweden |
OMX Stockholm 30 |
1333.0 |
1399.9 |
1362.4 |
-2.7% |
2.2% |
| Switzerland |
SMI |
8203.0 |
8678.2 |
8468.5 |
-2.4% |
3.2% |
|
|
|
|
|
|
|
| North America |
|
|
|
|
|
|
| United States |
Dow |
16576.7 |
17068.3 |
16943.8 |
-0.7% |
2.2% |
|
NASDAQ |
4176.6 |
4485.9 |
4415.5 |
-1.6% |
5.7% |
|
S&P 500 |
1848.4 |
1985.4 |
1967.6 |
-0.9% |
6.4% |
| Canada |
S&P/TSX Comp. |
13621.6 |
15215.0 |
15125.5 |
-0.6% |
11.0% |
| Mexico |
Bolsa |
42727.1 |
43518.1 |
43481.8 |
-0.1% |
1.8% |
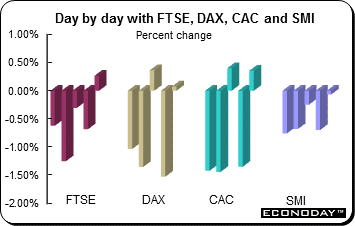 Equities were down on the week after rising the week before. The indexes were already lower for the week prior to Thursday's retreat on disappointing economic data from Germany and the UK. Concerns about earnings season also played a role in the downdraft. The major markets steadied Friday after tumbling to their lowest levels in two months on Thursday amid Portugal's banking woes. Despite some modest gains Friday, European stocks turned in their worst weekly performance since March. Markets are worried that Europe's banking system is susceptible to contagion from Portugal, where Portugal's regulator suspended trading of Banco Espírito Santo Thursday after its share price crashed. The FTSE was down 2.6 percent, both the DAX and CAC declined 3.4 percent and the SMI lost 2.4 percent. Equities were down on the week after rising the week before. The indexes were already lower for the week prior to Thursday's retreat on disappointing economic data from Germany and the UK. Concerns about earnings season also played a role in the downdraft. The major markets steadied Friday after tumbling to their lowest levels in two months on Thursday amid Portugal's banking woes. Despite some modest gains Friday, European stocks turned in their worst weekly performance since March. Markets are worried that Europe's banking system is susceptible to contagion from Portugal, where Portugal's regulator suspended trading of Banco Espírito Santo Thursday after its share price crashed. The FTSE was down 2.6 percent, both the DAX and CAC declined 3.4 percent and the SMI lost 2.4 percent.
Prior to Thursday it had been more than a year since concerns about European debt rocked global markets. The swoon was reminiscent of those in 2011 and 2012, when debt in countries such as Greece and Italy preoccupied the market. Many of those concerns have abated since then. This time it's Portugal. However, many analysts feel the Portuguese situation is not a sufficient enough catalyst to provoke a significant reassessment though it does highlight the risks inherent in the Eurozone's vulnerabilities. The International Monetary Fund Thursday said that Portugal's financial system still has trouble spots after the international bailout, warranting corrective measures in some cases and intrusive supervision in others.
Investors scooped up assets traditionally seen as safe havens including gold and U.S. and German government bonds. The 10-year German Bund traded at its strongest level in two years. Amid the market turmoil, some southern European companies postponed stock and bond offerings.
Among the week's disappointing economic data were May's industrial production data from Germany, the UK, Italy and France. Output declined in all four, sending stocks lower amid fears that the region's economic recovery is fizzling out. And weak merchandise trade data from Germany fueled speculation that Eurozone second quarter GDP will be weaker than originally forecast.
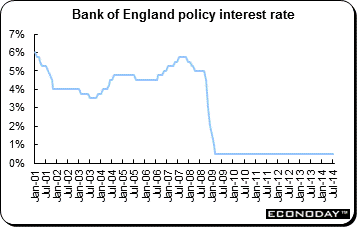 At its July meeting, the Bank of England's monetary policy committee left its Bank Rate at 0.5 percent and its asset purchase ceiling at £375 billion. However, despite the widely anticipated confirmation of steady rates, there will still be added interest in this month's minutes (due July 23rd) amid increasing signs of splits on the MPC over the economic outlook. At its July meeting, the Bank of England's monetary policy committee left its Bank Rate at 0.5 percent and its asset purchase ceiling at £375 billion. However, despite the widely anticipated confirmation of steady rates, there will still be added interest in this month's minutes (due July 23rd) amid increasing signs of splits on the MPC over the economic outlook.
For now, strong growth and a tightening labour market have had little discernible impact upon either wages or inflation but the concern is that the output gap may be closing more rapidly than expected in which case the current Goldilocks scenario might not last much longer. Earlier in the week, incoming Deputy Governor Nemat Shafik (joins on August 1st) signaled that she expects the official 1 percent to 1.5 percent estimate of the output gap to be revised down in the next forecasting round. Note that the July policy deliberations included new voting members Andrew Haldane (Chief Economist) and Kristin Forbes (external member).
The BoE is broadly expected to increase interest rates either at the end of this year or in early 2015, probably before the Federal Reserve which on Wednesday detailed how it plans to make its own exit from the era of ultra-loose monetary policy. The BoE publishes its next quarterly Inflation Report on August 13 when Governor Mark Carney and other officials will give a detailed update on their outlook for the economy.
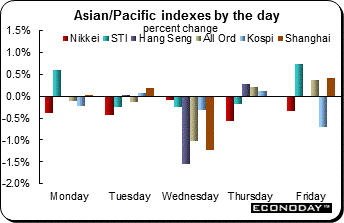 Most equity indexes retreated after increasing the week before. The indexes were dragged down at week's end on worries over the health of Portugal's biggest bank which in turn stoked concerns about the underlying health of Europe's banking system. Banco Espírito Santo plummeted 17 percent Thursday before the country's securities regulator suspended the shares. Most equity indexes retreated after increasing the week before. The indexes were dragged down at week's end on worries over the health of Portugal's biggest bank which in turn stoked concerns about the underlying health of Europe's banking system. Banco Espírito Santo plummeted 17 percent Thursday before the country's securities regulator suspended the shares.
The Nikkei declined 1.8 percent on the week. The index was down every day of the week — its longest losing streak since November 2012. A stronger yen dampened sentiment as did disappointing economic data. May core machine orders (less volatile items such as ships and electricity generating equipment) plunged 19.5 percent on the month — analysts expected a rebound of 0.6 percent.
While declines were anticipated for April data after the VAT increase on April 1st, recoveries were expected for May. Prior to April 1st, consumers and businesses alike bought in advance to avoid paying higher taxes on major purchases. May industrial output was soft — it rebounded 0.5 percent after tumbling 2.8 percent in April. While second quarter gross domestic product was anticipated to contract, it appears now that the decline will be much greater.
The Shanghai Composite was down 0.6 percent and the Hang Seng was 1.3 percent lower on the week. Both indexes were up the prior week. China's June consumer price index was up a less than expected 2.3 percent from a year earlier after increasing 2.5 percent in the previous month. The produce price index was down 1.1 percent. The PPI declined for the 28th consecutive month. June merchandise trade surplus along with both exports and imports were below analysts' expectations.
India's Sensex was down 3.6 percent on the week. The index declined four of five days as the markets awaited the first budget from the newly elected government of Prime Minister Narendra Modi. Finance Minister Arun Jaitley unveiled the government's budget, with proposals to boost growth, lower inflation and keep fiscal deficit under control. The finance minister said it would put India on the path back to 7 percent to 8 percent growth. But some analysts lamented a lack of details on cutting subsidies. Modi faces the daunting task of balancing the necessary investments with steps to put India's finances on a sounder footing.
Many analysts see the budget as a missed chance to take tough measures on subsidies. The budget retained the fiscal shortfall target at 4.1 percent of gross domestic product while leaving revenue and expenditure forecasts largely similar to an interim budget in February. At the same time, Jaitley unveiled plans to "overhaul" food and fuel subsidies to narrow the fiscal gap to 3 percent of GDP in 2017.
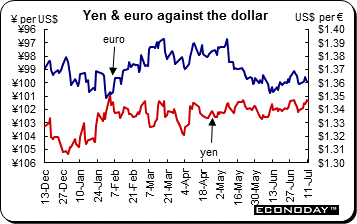 The U.S. dollar was mixed against its major counterparts. It retreated against the euro, yen, Swiss franc and Australian dollar but advanced against the pound sterling and Canadian dollar. The dollar weakened after minutes of the Federal Reserve's June meeting offered no new clues on the timing of an interest rate increase, with officials saying policy is driven by economic data — something they have said all along. The U.S. dollar was mixed against its major counterparts. It retreated against the euro, yen, Swiss franc and Australian dollar but advanced against the pound sterling and Canadian dollar. The dollar weakened after minutes of the Federal Reserve's June meeting offered no new clues on the timing of an interest rate increase, with officials saying policy is driven by economic data — something they have said all along.
The yen was up against most of its major peers. Investors stepped up demand for safer assets on concern the stress in Portugal's banking sector may spread elsewhere in the Eurozone. The yen gained after Banco Espírito Santo missed a payment on short term debt, reawakening speculation the euro region remains vulnerable to financial shocks. The nation's central bank said the lender is protected.
Elsewhere, Canadian dollar slumped after June employment unexpectedly declined and the unemployment rate inched upward.
|
|
2013 |
2014 |
% Change |
|
|
Dec 31 |
July 4 |
July 11 |
Week |
2014 |
| U.S. $ per currency |
|
|
|
|
|
|
| Australia |
A$ |
0.893 |
0.936 |
0.939 |
0.3% |
5.2% |
| New Zealand |
NZ$ |
0.823 |
0.874 |
0.881 |
0.8% |
7.1% |
| Canada |
C$ |
0.942 |
0.938 |
0.932 |
-0.7% |
-1.1% |
| Eurozone |
euro (€) |
1.376 |
1.359 |
1.361 |
0.1% |
-1.1% |
| UK |
pound sterling (£) |
1.656 |
1.716 |
1.712 |
-0.2% |
3.4% |
|
|
|
|
|
|
|
| Currency per U.S. $ |
|
|
|
|
|
|
| China |
yuan |
6.054 |
6.205 |
6.204 |
0.0% |
-2.4% |
| Hong Kong |
HK$* |
7.754 |
7.750 |
7.750 |
0.0% |
0.1% |
| India |
rupee |
61.800 |
59.735 |
59.938 |
-0.3% |
3.1% |
| Japan |
yen |
105.310 |
102.060 |
101.330 |
0.7% |
3.9% |
| Malaysia |
ringgit |
3.276 |
3.186 |
3.186 |
0.0% |
2.8% |
| Singapore |
Singapore $ |
1.262 |
1.246 |
1.241 |
0.4% |
1.7% |
| South Korea |
won |
1049.800 |
1008.880 |
1018.920 |
-1.0% |
3.0% |
| Taiwan |
Taiwan $ |
29.807 |
29.905 |
29.962 |
-0.2% |
-0.5% |
| Thailand |
baht |
32.720 |
32.392 |
32.146 |
0.8% |
1.8% |
| Switzerland |
Swiss franc |
0.892 |
0.895 |
0.892 |
0.3% |
0.0% |
| *Pegged to U.S. dollar |
|
|
|
|
|
|
| Source: Bloomberg |
|
|
|
|
|
|
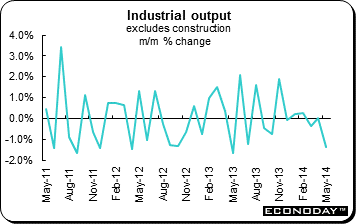 May industrial production dropped 1.8 percent on the month with the on-the-year rate at only plus 1.3 percent. The monthly decline in output was the worst performance by the sector since April 2012 and, moreover, followed a sharp downward revision to April (down 0.3 percent from up 0.2 percent). Annual workday adjusted growth was steady at 1.3 percent. Excluding construction, output was down 1.4 percent on the month and was up 1.7 percent on the year. Both intermediates (3.0 percent) and consumer goods (3.5 percent) contracted. Construction was also down a hefty 4.9 percent and the headline drop would have looked a good deal worse but for relatively modest gains in energy (1.0 percent) and capital goods (0.3 percent). Overall manufacturing was down 1.6 percent from April when it was only flat. May industrial production dropped 1.8 percent on the month with the on-the-year rate at only plus 1.3 percent. The monthly decline in output was the worst performance by the sector since April 2012 and, moreover, followed a sharp downward revision to April (down 0.3 percent from up 0.2 percent). Annual workday adjusted growth was steady at 1.3 percent. Excluding construction, output was down 1.4 percent on the month and was up 1.7 percent on the year. Both intermediates (3.0 percent) and consumer goods (3.5 percent) contracted. Construction was also down a hefty 4.9 percent and the headline drop would have looked a good deal worse but for relatively modest gains in energy (1.0 percent) and capital goods (0.3 percent). Overall manufacturing was down 1.6 percent from April when it was only flat.
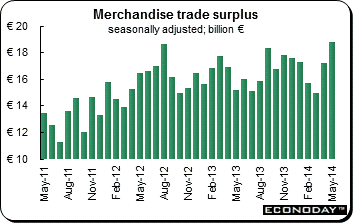 May seasonally adjusted merchandise trade surplus was €18.8 billion, up from a smaller revised €17.2 billion in April. The unadjusted surplus was €17.8 billion, up from €17.2 billion at the start of the quarter and €13.6 billion a year ago. The improvement in the adjusted headline reflected renewed weakness in both sides of the balance sheet. Exports were down 1.1 percent on the month — their third decline since January. Imports were down 3.4 percent — their steepest drop since November 2012. Compared with May 2013 exports were 4.3 percent higher but imports declined 0.4 percent. May seasonally adjusted merchandise trade surplus was €18.8 billion, up from a smaller revised €17.2 billion in April. The unadjusted surplus was €17.8 billion, up from €17.2 billion at the start of the quarter and €13.6 billion a year ago. The improvement in the adjusted headline reflected renewed weakness in both sides of the balance sheet. Exports were down 1.1 percent on the month — their third decline since January. Imports were down 3.4 percent — their steepest drop since November 2012. Compared with May 2013 exports were 4.3 percent higher but imports declined 0.4 percent.
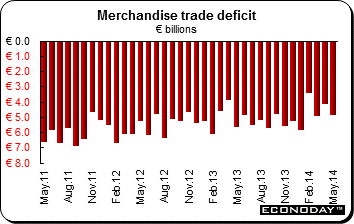 May seasonally adjusted merchandise trade deficit widened to €4.9 billion from a larger revised €4.1 billion in April. Compared with the same month in 2013 the shortfall was unchanged. The latest deterioration, which essentially wiped out all of April's improvement, puts the cumulative red ink over the year to date at a disappointingly large €23.1 billion, down just €2.4 billion when compared with the same period in 2013. However, at €4.5 billion, the average deficit for the second quarter so far was at least nearly 5 percent short of the first quarter mean when net exports subtracted 0.1 percentage points from quarterly real GDP growth. May seasonally adjusted merchandise trade deficit widened to €4.9 billion from a larger revised €4.1 billion in April. Compared with the same month in 2013 the shortfall was unchanged. The latest deterioration, which essentially wiped out all of April's improvement, puts the cumulative red ink over the year to date at a disappointingly large €23.1 billion, down just €2.4 billion when compared with the same period in 2013. However, at €4.5 billion, the average deficit for the second quarter so far was at least nearly 5 percent short of the first quarter mean when net exports subtracted 0.1 percentage points from quarterly real GDP growth.
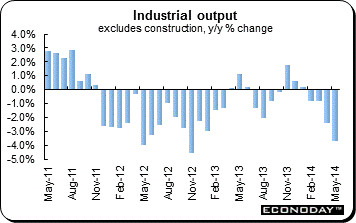 May industrial production (excluding construction) plunged 1.7 percent on the month following an unrevised 0.3 percent increase in April. Annual growth was down 3.7 percent after sliding 2.4 percent in April, its worst reading since November 2012. May's slump reflected broad based declines among the major output sectors and would have been steeper still but for a 1.3 percent monthly increase in the volatile mining & quarrying, energy & utilities category. Food & drink was down 1.0 percent, electrical & electronic equipment 2.9 percent, transport equipment 3.5 percent and other manufacturing 2.0 percent. Overall manufacturing output contracted 2.3 percent. May industrial production (excluding construction) plunged 1.7 percent on the month following an unrevised 0.3 percent increase in April. Annual growth was down 3.7 percent after sliding 2.4 percent in April, its worst reading since November 2012. May's slump reflected broad based declines among the major output sectors and would have been steeper still but for a 1.3 percent monthly increase in the volatile mining & quarrying, energy & utilities category. Food & drink was down 1.0 percent, electrical & electronic equipment 2.9 percent, transport equipment 3.5 percent and other manufacturing 2.0 percent. Overall manufacturing output contracted 2.3 percent.
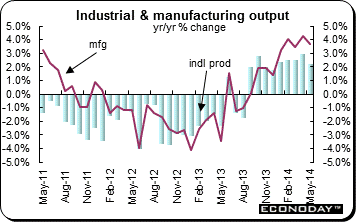 May industrial production slid 0.7 percent on the month and was up 2.3 percent on the year. Manufacturing dropped an even steeper 1.3 percent and was up 3.7 percent from a year ago. May's disappointing manufacturing performance, which accounted for almost the entire decline in headline industrial production, reflected monthly decreases in 10 of the 13 subsectors. The most significant drop was in basic metals & metal products (2.3 percent) followed by pharmaceuticals (3.6 percent) and computer, electronic & optical products (4.1 percent). By contrast there was a solid 4.7 percent monthly bounce in textiles & clothing and a 0.9 percent increase in wood, paper & printing. Elsewhere within total production, mining & quarrying was up 0.8 percent from April and electricity, gas, steam & air conditioning gained 3.8 percent. Water supply, sewerage & waste management declined 1.1 percent. May industrial production slid 0.7 percent on the month and was up 2.3 percent on the year. Manufacturing dropped an even steeper 1.3 percent and was up 3.7 percent from a year ago. May's disappointing manufacturing performance, which accounted for almost the entire decline in headline industrial production, reflected monthly decreases in 10 of the 13 subsectors. The most significant drop was in basic metals & metal products (2.3 percent) followed by pharmaceuticals (3.6 percent) and computer, electronic & optical products (4.1 percent). By contrast there was a solid 4.7 percent monthly bounce in textiles & clothing and a 0.9 percent increase in wood, paper & printing. Elsewhere within total production, mining & quarrying was up 0.8 percent from April and electricity, gas, steam & air conditioning gained 3.8 percent. Water supply, sewerage & waste management declined 1.1 percent.
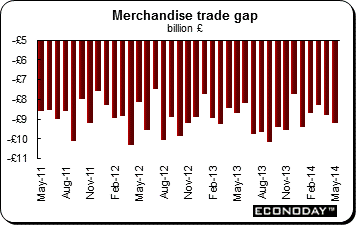 May merchandise trade global shortfall widened out from a marginally smaller revised Stg8.8 billion in April to a larger than expected Stg9.2 billion in May. Excluding oil and other erratic items the red ink stood at Stg7.9 billion after Stg7.8 billion last time. Exports were 0.6 percent higher on the month (core exports 0.2 percent), mainly courtesy of strength in semi-finished manufactures. Imports were rather more buoyant, rising 1.7 percent (0.7 percent), in part reflecting a pick-up in demand for aircraft. Regionally net exports to other EU countries deteriorated by Stg0.3 billion to yield a deficit of Stg5.2 billion and slipped Stg0.1 billion for a shortfall of Stg4.0 billion with the rest of the world. May merchandise trade global shortfall widened out from a marginally smaller revised Stg8.8 billion in April to a larger than expected Stg9.2 billion in May. Excluding oil and other erratic items the red ink stood at Stg7.9 billion after Stg7.8 billion last time. Exports were 0.6 percent higher on the month (core exports 0.2 percent), mainly courtesy of strength in semi-finished manufactures. Imports were rather more buoyant, rising 1.7 percent (0.7 percent), in part reflecting a pick-up in demand for aircraft. Regionally net exports to other EU countries deteriorated by Stg0.3 billion to yield a deficit of Stg5.2 billion and slipped Stg0.1 billion for a shortfall of Stg4.0 billion with the rest of the world.
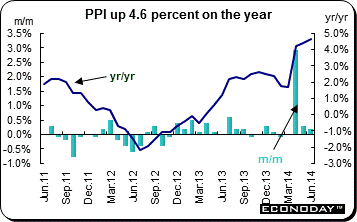 June producer price index (formerly called the corporate goods price index) was up 0.2 percent and 4.6 percent from a year ago. Excluding the consumption tax, the PPI edged up 0.1 percent and was 1.7 percent higher on the year — about the same as in March before the April 1st sales tax increase. On the month, prices for the subcategories were split between increases and declines. On the year, all subcategories except electronic components & devices saw price increases. Petroleum & coal products jumped 12.2 percent while lumber & wood products increased 9.1 percent. Iron & steel advanced 6.7 percent. June producer price index (formerly called the corporate goods price index) was up 0.2 percent and 4.6 percent from a year ago. Excluding the consumption tax, the PPI edged up 0.1 percent and was 1.7 percent higher on the year — about the same as in March before the April 1st sales tax increase. On the month, prices for the subcategories were split between increases and declines. On the year, all subcategories except electronic components & devices saw price increases. Petroleum & coal products jumped 12.2 percent while lumber & wood products increased 9.1 percent. Iron & steel advanced 6.7 percent.
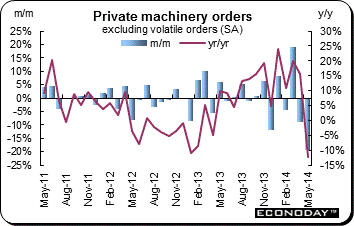 May machinery orders excluding volatile items plunged 19.5 percent on the month after sinking 9.1 percent the month before. May's drop was the largest decline in nearly three decades. On the year, orders were down 12.3 percent. Orders failed to rebound as anticipated, calling into question expectations that the economy would recover quickly after the sales tax was increased on April 1. Manufacturing orders slumped 18.6 percent on the month while nonmanufacturing orders dropped 17.8 percent. Total orders including volatile items were 30.5 percent lower. May machinery orders excluding volatile items plunged 19.5 percent on the month after sinking 9.1 percent the month before. May's drop was the largest decline in nearly three decades. On the year, orders were down 12.3 percent. Orders failed to rebound as anticipated, calling into question expectations that the economy would recover quickly after the sales tax was increased on April 1. Manufacturing orders slumped 18.6 percent on the month while nonmanufacturing orders dropped 17.8 percent. Total orders including volatile items were 30.5 percent lower.
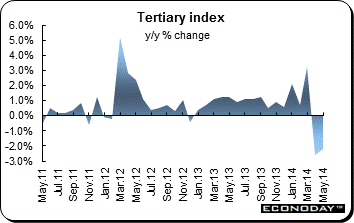 May tertiary index was up 0.9 percent on the month but down 2.2 percent from a year ago. Most industries contributed to the monthly gain including wholesale and retail trade, transport & postal activities, miscellaneous services (except government services etc.), living-related & personal services & amusement services, information & communications, real estate & goods rental & leasing, medical, health care & welfare, accommodations, eating & drinking services, electricity, gas, heat supply & water and learning support. However, scientific research, professional & technical services, finance & insurance and compound services retreated on the month. May tertiary index was up 0.9 percent on the month but down 2.2 percent from a year ago. Most industries contributed to the monthly gain including wholesale and retail trade, transport & postal activities, miscellaneous services (except government services etc.), living-related & personal services & amusement services, information & communications, real estate & goods rental & leasing, medical, health care & welfare, accommodations, eating & drinking services, electricity, gas, heat supply & water and learning support. However, scientific research, professional & technical services, finance & insurance and compound services retreated on the month.
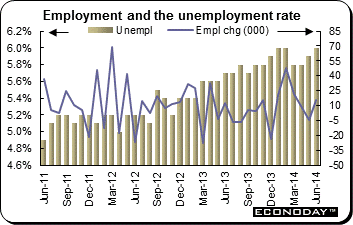 June employment was up a greater than expected 15,900 after a revised decline of 5,100. Full-time job growth declined by 3,800 jobs, however, part-time employment was up by 19,700 jobs. The unemployment rate edged up to 6.0 percent from 5.9 percent in May. The seasonally adjusted labour force participation rate increased 0.1 percentage points to 64.7 percent in June 2014, explaining why the jobless rate climbed. The number of people employed increased by 15,900 to 11,578,200. The increase in total employment was due to increased female employment (both full-time and part-time) and increased male part-time employment, offset by a decline in male full-time employment. Part-time employment increased by 19,700 people to 3,515,700 and full-time employment decreased by 3,800 people to 8,062,500. June employment was up a greater than expected 15,900 after a revised decline of 5,100. Full-time job growth declined by 3,800 jobs, however, part-time employment was up by 19,700 jobs. The unemployment rate edged up to 6.0 percent from 5.9 percent in May. The seasonally adjusted labour force participation rate increased 0.1 percentage points to 64.7 percent in June 2014, explaining why the jobless rate climbed. The number of people employed increased by 15,900 to 11,578,200. The increase in total employment was due to increased female employment (both full-time and part-time) and increased male part-time employment, offset by a decline in male full-time employment. Part-time employment increased by 19,700 people to 3,515,700 and full-time employment decreased by 3,800 people to 8,062,500.
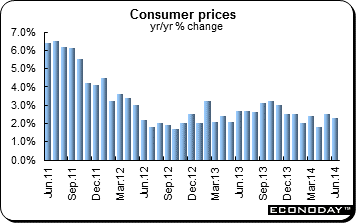 June consumer prices increased a less than expected 2.3 percent on the year, down from May's 2.5 percent increase. That is well within the government's inflation target, and signals the central bank will keep allowing money to flow easily around the economy as politicians attempt to rev up growth. The CPI declined 0.1 percent on the month. For the first six months of 2014, the CPI was up 2.3 percent when compared with the same six months a year earlier. The urban index was up 2.4 percent while the rural CPI was up 2.1 percent. Food prices eased to an annual increase of 3.7 percent from 4.1 percent in May. Non-food prices were up a benign 1.7 percent. Clothing prices advanced 2.5 percent and recreation & education was 2.1 percent higher. Transportation & communication edged up 0.6 percent while tobacco & alcohol declined 0.6 percent. Housing was up 2.2 percent. June consumer prices increased a less than expected 2.3 percent on the year, down from May's 2.5 percent increase. That is well within the government's inflation target, and signals the central bank will keep allowing money to flow easily around the economy as politicians attempt to rev up growth. The CPI declined 0.1 percent on the month. For the first six months of 2014, the CPI was up 2.3 percent when compared with the same six months a year earlier. The urban index was up 2.4 percent while the rural CPI was up 2.1 percent. Food prices eased to an annual increase of 3.7 percent from 4.1 percent in May. Non-food prices were up a benign 1.7 percent. Clothing prices advanced 2.5 percent and recreation & education was 2.1 percent higher. Transportation & communication edged up 0.6 percent while tobacco & alcohol declined 0.6 percent. Housing was up 2.2 percent.
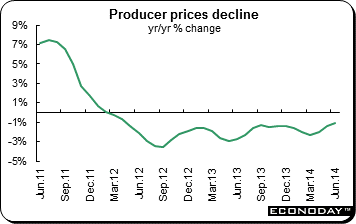 June producer prices were down 1.1 percent from a year ago. This was the 28th consecutive month producer prices had declined. On the month, the PPI slipped 0.2 percent. For the first six months of the year, the PPI dropped 1.8 percent when compared with the same months a year earlier. Raw materials procurement, fuel and power prices declined 1.5 percent as did production materials. However, consumer prices edged up 0.2 percent. Within production materials, mining & exploration prices dropped 4.0 percent while raw materials declined 1.5 percent. Within consumer prices, only durable goods prices declined 0.9 percent while daily goods, food & related products and clothing & related products were up 0.3 percent, 0.7 percent and 0.8 percent respectively. June producer prices were down 1.1 percent from a year ago. This was the 28th consecutive month producer prices had declined. On the month, the PPI slipped 0.2 percent. For the first six months of the year, the PPI dropped 1.8 percent when compared with the same months a year earlier. Raw materials procurement, fuel and power prices declined 1.5 percent as did production materials. However, consumer prices edged up 0.2 percent. Within production materials, mining & exploration prices dropped 4.0 percent while raw materials declined 1.5 percent. Within consumer prices, only durable goods prices declined 0.9 percent while daily goods, food & related products and clothing & related products were up 0.3 percent, 0.7 percent and 0.8 percent respectively.
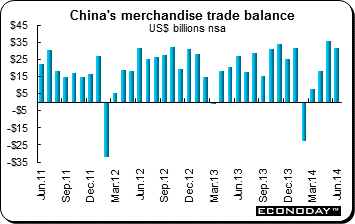 June merchandise trade balance was $31.60 billion, down from $35.92 billion in May. Exports were up 7.2 percent from a year ago after increasing 7.0 percent the month before. Imports were up 5.5 percent after slipping 1.6 percent. For the year to date, the trade surplus was $102.86 billion, down 4.7 percent from a year ago. Imports growth missed market expectations despite the boost from a stronger Chinese yuan in June, suggesting that China's demand for commodities remains weak and also reflecting falling commodities prices. Exports growth also missed forecasts slightly. However, the General Administration of Customs said in an accompanying statement that exports growth in the third quarter would be faster than the second quarter's pace. June merchandise trade balance was $31.60 billion, down from $35.92 billion in May. Exports were up 7.2 percent from a year ago after increasing 7.0 percent the month before. Imports were up 5.5 percent after slipping 1.6 percent. For the year to date, the trade surplus was $102.86 billion, down 4.7 percent from a year ago. Imports growth missed market expectations despite the boost from a stronger Chinese yuan in June, suggesting that China's demand for commodities remains weak and also reflecting falling commodities prices. Exports growth also missed forecasts slightly. However, the General Administration of Customs said in an accompanying statement that exports growth in the third quarter would be faster than the second quarter's pace.
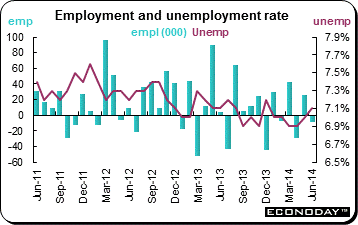 June employment dropped 9,400 after gaining 26,000 in May for the second decline in three months. With the participation rate steady at 66.1 percent, the unemployment rate crept up to 7.1 percent from 7.0 percent the month before, its second consecutive monthly gain and its highest mark since December 2013. The drop in employment was wholly attributable to part time jobs which declined some 43,000. Full time positions, however, were up 33,500. There were contractions in both the private sector payroll (21,000) and in public sector headcount (11,900) leaving just self-employment to post the sole advance (23,400). At a sector level there were declines in both goods producing industries (3,200) and services (6,100). Within the former, manufacturing was off 10,600 and agriculture down 14,500. Natural resources (down 5,900) and utilities (down 4,000) also had a poor month but construction was up 31,800. Services were hit by a 27,200 drop in business, building & other support services, compounded by a 9,100 slide in accommodation & food and an 8,100 reversal in transportation & warehousing. Information, culture & recreation was down 3,100 and educational services 3,500 lower. The cumulative decline here was almost offset by gains in other services (20,800), public administration (11,100) and finance, insurance, real estate & leasing (7,800). Trade was up just 3,000. June employment dropped 9,400 after gaining 26,000 in May for the second decline in three months. With the participation rate steady at 66.1 percent, the unemployment rate crept up to 7.1 percent from 7.0 percent the month before, its second consecutive monthly gain and its highest mark since December 2013. The drop in employment was wholly attributable to part time jobs which declined some 43,000. Full time positions, however, were up 33,500. There were contractions in both the private sector payroll (21,000) and in public sector headcount (11,900) leaving just self-employment to post the sole advance (23,400). At a sector level there were declines in both goods producing industries (3,200) and services (6,100). Within the former, manufacturing was off 10,600 and agriculture down 14,500. Natural resources (down 5,900) and utilities (down 4,000) also had a poor month but construction was up 31,800. Services were hit by a 27,200 drop in business, building & other support services, compounded by a 9,100 slide in accommodation & food and an 8,100 reversal in transportation & warehousing. Information, culture & recreation was down 3,100 and educational services 3,500 lower. The cumulative decline here was almost offset by gains in other services (20,800), public administration (11,100) and finance, insurance, real estate & leasing (7,800). Trade was up just 3,000.
Stocks slumped last week as investors nervously awaited U.S. earnings results. European and UK economic data disappointed with industrial production declining in Germany, France, Italy and the UK. Merchandise trade data were gloomy as well. China's inflation data presented few concerns while export and import data disappointed.
Both the Bank of Japan and Bank of Canada meet this week while the Federal Reserve publishes its Beige Book in preparation for the FOMC meeting that will be held in two weeks. China releases second quarter gross domestic product along with June industrial output and retail sales. Investors will also be focusing on company news as the pace of earnings picks up.
| Central Bank activities |
|
| July 14, 15 |
Japan |
Bank of Japan Monetary Policy Announcement |
| July 16 |
Canada |
Bank of Canada Monetary Policy Announcement |
|
United States |
Federal Reserve Beige Book |
| |
|
|
| The following indicators will be released this week... |
| Europe |
|
|
| July 14 |
Eurozone |
Industrial Production (May) |
| July 15 |
Germany |
ZEW Business Survey (July) |
|
UK |
Consumer Price Index (June) |
|
|
Producer Price Index (June) |
| July 16 |
Eurozone |
Merchandise Trade (May) |
|
UK |
Labour Market Report (June) |
| July 17 |
Eurozone |
Harmonized Index of Consumer Prices (June final) |
| |
|
|
| Asia/Pacific |
|
|
| July 14 |
India |
Consumer Price Index (June) |
|
|
Wholesale Price Index (June) |
| July 16 |
China |
Industrial Production (June) |
|
|
Retail Sales (June) |
|
|
Gross Domestic Product (Q2.2014) |
| |
|
|
| Americas |
|
|
| July 16 |
Canada |
Manufacturing Sales (May) |
| July 18 |
Canada |
Consumer Price Index (June) |
Anne D Picker is the author of International Economic Indicators and Central Banks.
|

