|
Equities were mixed last week with most of the losses occurring in the Asia Pacific region where the market week was shortened by a slew of holiday observances. While European markets observed a four day week however, the indexes advanced. U.S. equities advanced as well. Stocks were driven by mixed earnings and economic data.
The week was packed with key economic data. Both the U.S. and UK reported their advance estimates of first quarter GDP. The UK estimate was above expectations while the U.S. estimate was much weaker than anticipated. First data for the second quarter in the form of the April manufacturing PMI bodes well for growth in Europe. Much better than expected April U.S. employment data was met without the exuberance such a report usually brings.
Both the Bank of Japan and the Federal Reserve met and duly announced that there was no change to their current policies. There was little reaction to either announcement.
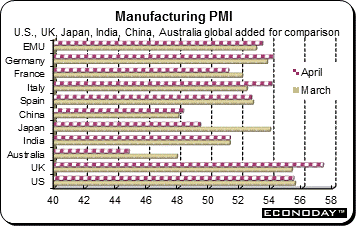 April Eurozone manufacturing activity improved to 53.4 — a three month high. The reading was far enough ahead of the 50 growth mark to suggest the sector enjoyed at least a reasonably good start to the quarter. Promisingly, Eurozone national PMIs for those countries providing data were all above 50 for the first time since November 2007 and reflected increases in both output and new orders across the board. Production saw its 10th consecutive monthly increase and at the fastest rate of expansion since January. The increase in overall new orders was down slightly from March but above the average for the current period of growth. However, within the total advance, domestic market conditions were only stabilized leaving the gains wholly attributable to exports (Germany a notable exception). April Eurozone manufacturing activity improved to 53.4 — a three month high. The reading was far enough ahead of the 50 growth mark to suggest the sector enjoyed at least a reasonably good start to the quarter. Promisingly, Eurozone national PMIs for those countries providing data were all above 50 for the first time since November 2007 and reflected increases in both output and new orders across the board. Production saw its 10th consecutive monthly increase and at the fastest rate of expansion since January. The increase in overall new orders was down slightly from March but above the average for the current period of growth. However, within the total advance, domestic market conditions were only stabilized leaving the gains wholly attributable to exports (Germany a notable exception).
Regionally, the best performer was Ireland where the PMI (56.1) was a 38 month high ahead of Germany (54.1) and potentially significantly Italy (54.0), which registered a 36 month peak. The main disappointment was France (51.2) which recorded a two month low.
In a reminder that low inflation is likely to remain a worry for the European Central Bank in the months ahead, manufacturers reported cutting their prices for the second straight month. They also reported a decline in the costs of goods and services they use to make their products.
Elsewhere, The UK manufacturing PMI jumped to 57.3, up 2 points from its March reading and at a 5 month high. The improvement reflected another strong period for output. But in Japan, output declined for the first time in 14 months. Alongside the decline in output was deterioration in new orders which also decreased for the first time in 14 months. In both cases, firms linked the reductions to the increase in the sales tax. The April manufacturing PMI posted at 49.4, down from 53.9 in March. Output fell to the greatest extent seen since December 2012. The main contributor according to anecdotal evidence was a decline in demand. Similar to output, new orders decreased, with evidence suggesting the increase in the sales tax was the main factor behind lower new orders as clients had brought forward purchases in March to avoid paying additional costs the following month.
|
|
2013 |
2014 |
% Change |
|
Index |
31-Dec |
Apr 25 |
May 2 |
Week |
April |
2014 |
| Asia/Pacific |
|
|
|
|
|
|
|
| Australia |
All Ordinaries |
5353.1 |
5515.5 |
5438.8 |
-1.4% |
1.1% |
1.6% |
| Japan |
Nikkei 225 |
16291.3 |
14429.3 |
14457.5 |
0.2% |
-3.5% |
-11.3% |
| Hong Kong |
Hang Seng |
23306.4 |
22223.5 |
22260.7 |
0.2% |
-0.1% |
-4.5% |
| S. Korea |
Kospi |
2011.3 |
1971.7 |
1959.4 |
-0.6% |
-1.2% |
-2.6% |
| Singapore |
STI |
3167.4 |
3267.6 |
3252.6 |
-0.5% |
2.4% |
2.7% |
| China |
Shanghai Composite |
2116.0 |
2036.5 |
2026.4 |
-0.5% |
-0.3% |
-4.2% |
|
|
|
|
|
|
|
|
| India |
Sensex 30 |
21170.7 |
22688.1 |
22403.9 |
-1.3% |
0.1% |
5.8% |
| Indonesia |
Jakarta Composite |
4274.2 |
4897.6 |
4838.8 |
-1.2% |
1.5% |
13.2% |
| Malaysia |
KLCI |
1867.0 |
1861.0 |
1869.1 |
0.4% |
1.2% |
0.1% |
| Philippines |
PSEi |
5889.8 |
6685.1 |
6742.97 |
0.9% |
4.3% |
14.5% |
| Taiwan |
Taiex |
8611.5 |
8774.1 |
8867.3 |
1.1% |
-0.7% |
3.0% |
| Thailand |
SET |
1298.7 |
1408.2 |
1421.5 |
0.9% |
2.8% |
9.5% |
|
|
|
|
|
|
|
|
| Europe |
|
|
|
|
|
|
|
| UK |
FTSE 100 |
6749.1 |
6685.7 |
6822.4 |
2.0% |
2.8% |
1.1% |
| France |
CAC |
4296.0 |
4443.6 |
4458.2 |
0.3% |
2.2% |
3.8% |
| Germany |
XETRA DAX |
9552.2 |
9401.6 |
9556.0 |
1.6% |
0.5% |
0.0% |
| Italy |
FTSE MIB |
18967.7 |
21441.6 |
21782.0 |
1.6% |
0.4% |
14.8% |
| Spain |
IBEX 35 |
9916.7 |
10306.2 |
10474.5 |
1.6% |
1.1% |
5.6% |
| Sweden |
OMX Stockholm 30 |
1333.0 |
1360.4 |
1360.2 |
0.0% |
0.0% |
2.0% |
| Switzerland |
SMI |
8203.0 |
8374.5 |
8442.7 |
0.8% |
0.3% |
2.9% |
|
|
|
|
|
|
|
|
| North America |
|
|
|
|
|
|
|
| United States |
Dow |
16576.7 |
16361.5 |
16512.9 |
0.9% |
0.7% |
-0.4% |
|
NASDAQ |
4176.6 |
4075.6 |
4123.9 |
1.2% |
-2.0% |
-1.3% |
|
S&P 500 |
1848.4 |
1863.4 |
1881.1 |
1.0% |
0.6% |
1.8% |
| Canada |
S&P/TSX Comp. |
13621.6 |
14533.6 |
14765.2 |
1.6% |
2.2% |
8.4% |
| Mexico |
Bolsa |
42727.1 |
40198.4 |
40968.0 |
1.9% |
0.6% |
-4.1% |
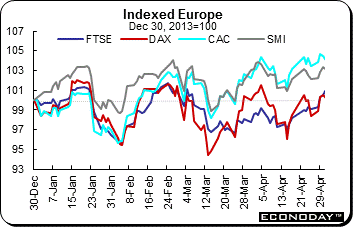 Equities advanced for the week and month of April. The FTSE was up 2.0 percent on the week while the CAC added 0.3 percent, the DAX gained 1.6 percent and the SMI was 0.8 percent. For the month of April, the indexes added 2.8 percent, 2.2 percent, 0.5 percent and 0.3 percent respectively. Equity markets have been buoyed in the last two weeks by a burst of deal making and bids largely in the healthcare sector. But deteriorating news from Ukraine rattled investors and overshadowed the much better than anticipated U.S. employment report. Equities advanced for the week and month of April. The FTSE was up 2.0 percent on the week while the CAC added 0.3 percent, the DAX gained 1.6 percent and the SMI was 0.8 percent. For the month of April, the indexes added 2.8 percent, 2.2 percent, 0.5 percent and 0.3 percent respectively. Equity markets have been buoyed in the last two weeks by a burst of deal making and bids largely in the healthcare sector. But deteriorating news from Ukraine rattled investors and overshadowed the much better than anticipated U.S. employment report.
Data from the UK continues to confirm that the economy is growing. The preliminary estimate of first quarter gross domestic product was up 0.8 percent on the quarter and 3.1 percent from the same quarter a year ago. The good news was reinforced by the April manufacturing PMI — it climbed to 57.3 from 55.8 the previous month boosted by increases in both domestic and overseas orders.
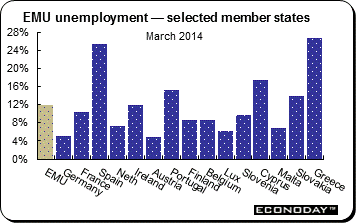 The European labour markets continue to be stagnant. The Eurozone jobless rate was 11.8 percent in March — unchanged since October 2013, after revisions to previous months’ data. For the whole European Union of 28 nations, the jobless rate was 10.5 percent, unchanged from the revised February figure. About 25.7 million people across the European Union, including 5.3 million young people, were counted as unemployed. The European labour markets continue to be stagnant. The Eurozone jobless rate was 11.8 percent in March — unchanged since October 2013, after revisions to previous months’ data. For the whole European Union of 28 nations, the jobless rate was 10.5 percent, unchanged from the revised February figure. About 25.7 million people across the European Union, including 5.3 million young people, were counted as unemployed.
The pace of job growth has been a drag on the Eurozone, where the number of unemployed declined by only 22,000 compared with February and 316,000 compared with March 2013. Employment is a lagging indicator, as employers —- especially those bound by the rigid labour market rules common in many European countries — tend to hold out until their prospects are certain before adding to their work forces. Europe’s lowest jobless rates remained those of Austria, at 4.9 percent, and Germany, at 5.1 percent (according to Eurostat methodology) — both of which use work sharing programs to hold down unemployment. Greece, at 26.7 percent in January and Spain, at 25.3 percent in March, continued to experience depression level unemployment.
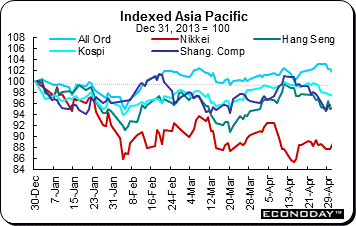 Equities were mixed with many markets closed for holidays during the week. Earlier in the week, markets here waited for the FOMC announcement. Then later, investors focused on the employment report which was released after markets here closed for the week. Concerns regarding Ukraine continued to fester in the background. The reluctance on the part of the Bank of Japan to expand its stimulus program despite tepid data and a recent sales tax increase rendered investor mood somewhat cautious. Many markets were little moved in the holiday shortened week. The region appeared to tread water as markets looked to the conclusion of the Federal Reserve's policy meeting for an update on the Fed’s stance on stimulus measures and Friday’s employment report that provides a health check on the U.S. economy. Equities were mixed with many markets closed for holidays during the week. Earlier in the week, markets here waited for the FOMC announcement. Then later, investors focused on the employment report which was released after markets here closed for the week. Concerns regarding Ukraine continued to fester in the background. The reluctance on the part of the Bank of Japan to expand its stimulus program despite tepid data and a recent sales tax increase rendered investor mood somewhat cautious. Many markets were little moved in the holiday shortened week. The region appeared to tread water as markets looked to the conclusion of the Federal Reserve's policy meeting for an update on the Fed’s stance on stimulus measures and Friday’s employment report that provides a health check on the U.S. economy.
The Nikkei edged up 0.2 percent for the week. However, it was the worst performer of all the indexes cover here in April, dropping 3.5 percent. March industrial production was up less than expected while both retail sales and household spending for the same month soared prior to the April first sales tax increase.
The Shanghai Composite slipped 0.5 percent in its three day trading week — markets here were closed Thursday and Friday. The index lost 0.3 percent on the month. At the same time, the Hang Seng edged up 0.2 percent on the week but slipped 0.1 percent on the month. Mainland Chinese shares were down on liquidity concerns after the China Securities Regulatory Commission said its Public Offering Review Committee would meet on April 30 to review the IPO applications of four companies.
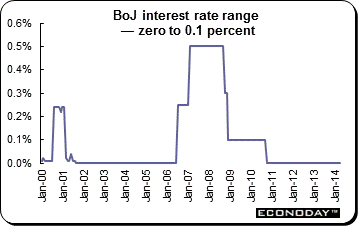 As universally expected, the Bank of Japan left its key interest rate range at zero to 0.1 percent. Financial asset purchases remained unchanged, with the goal of increasing the monetary base at an annual pace of about ¥60 to ¥70 trillion yen. The BoJ maintained its inflation target at 2 percent. As universally expected, the Bank of Japan left its key interest rate range at zero to 0.1 percent. Financial asset purchases remained unchanged, with the goal of increasing the monetary base at an annual pace of about ¥60 to ¥70 trillion yen. The BoJ maintained its inflation target at 2 percent.
Again, the monetary policy board described the economy as recovering moderately. Overseas economies — mainly advanced economies — are starting to recover, although a lackluster performance is still seen in part. While exports have leveled off, business fixed investment has picked up on improved corporate profits. Public investment has increased. With improvement in employment and income, housing investment has continued to increase. Also, private consumption was described as resilient.
Risks to the economic outlook were seen to include developments in the emerging and commodity exporting economies, the prospects for the European debt problem and the pace of recovery in the U.S. economy.
Analysts expect the BoJ to double purchases of exchange traded funds in a second round of monetary easing under Governor Haruhiko Kuroda. They anticipate it coming in the months ahead.
The U.S. dollar declined against the euro, pound sterling, Swiss franc and the Canadian dollar last week. It advanced against the yen and was unchanged against the Australian dollar.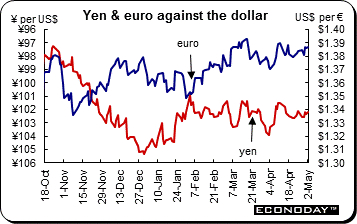 On Friday, the dollar erased gains against most major peers as tensions heightened in Ukraine as the United Nations Security Council prepared to meet on the country’s military offensive against pro-Russian separatists. However, the U.S. currency climbed earlier in the day by the most in six weeks against a basket of major peers after a government report showed employers boosted payrolls in April by the largest amount in two years and the jobless rate plunged, boosting speculation the Federal Reserve will speed the timetable to pare monthly bond buying and increase interest rates. However, the increase from the employment report quickly dissipated. On Friday, the dollar erased gains against most major peers as tensions heightened in Ukraine as the United Nations Security Council prepared to meet on the country’s military offensive against pro-Russian separatists. However, the U.S. currency climbed earlier in the day by the most in six weeks against a basket of major peers after a government report showed employers boosted payrolls in April by the largest amount in two years and the jobless rate plunged, boosting speculation the Federal Reserve will speed the timetable to pare monthly bond buying and increase interest rates. However, the increase from the employment report quickly dissipated.
Analysts said that despite the strength in headline employment (up 288,000), there were some question marks within the report. The U.S. currency dropped April 30 against most major peers after the Fed said it will keep interest rates at almost zero for a “considerable time” after its bond purchasing program ends. It cut monthly bond buying to $45 billion, its fourth straight $10 billion cut, and said further reductions in “measured steps” are likely. After thinking about it, investors decided the report would not drive the Federal Reserve to increase interest rates sooner than expected. One month is not a trend.
|
|
2013 |
2014 |
% Change |
|
|
Dec 31 |
April 25 |
May 2 |
Week |
2014 |
| U.S. $ per currency |
|
|
|
|
|
|
| Australia |
A$ |
0.893 |
0.927 |
0.927 |
0.0% |
3.9% |
| New Zealand |
NZ$ |
0.823 |
0.858 |
0.867 |
1.0% |
5.3% |
| Canada |
C$ |
0.942 |
0.906 |
0.911 |
0.5% |
-3.3% |
| Eurozone |
euro (€) |
1.376 |
1.383 |
1.387 |
0.3% |
0.8% |
| UK |
pound sterling (£) |
1.656 |
1.680 |
1.6876 |
0.5% |
1.9% |
|
|
|
|
|
|
|
| Currency per U.S. $ |
|
|
|
|
|
|
| China |
yuan |
6.054 |
6.253 |
6.259 |
-0.1% |
-3.3% |
| Hong Kong |
HK$* |
7.754 |
7.753 |
7.752 |
0.0% |
0.0% |
| India |
rupee |
61.800 |
60.625 |
60.163 |
0.8% |
2.7% |
| Japan |
yen |
105.310 |
102.160 |
102.230 |
-0.1% |
3.0% |
| Malaysia |
ringgit |
3.276 |
3.270 |
3.266 |
0.1% |
0.3% |
| Singapore |
Singapore $ |
1.262 |
1.256 |
1.252 |
0.4% |
0.8% |
| South Korea |
won |
1049.800 |
1041.380 |
1060.330 |
-1.8% |
-1.0% |
| Taiwan |
Taiwan $ |
29.807 |
30.304 |
30.180 |
0.4% |
-1.2% |
| Thailand |
baht |
32.720 |
32.250 |
32.425 |
-0.5% |
0.9% |
| Switzerland |
Swiss franc |
0.892 |
0.881 |
0.878 |
0.4% |
1.6% |
| *Pegged to U.S. dollar |
|
|
|
|
|
|
| Source: Bloomberg |
|
|
|
|
|
|
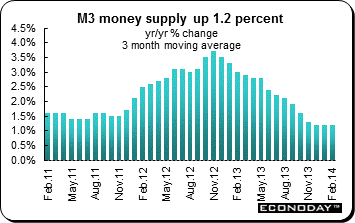 March M3 money supply was up a sluggish 1.1 percent on the year and well short of its 4.5 percent reference rate. The 3-month moving average closely monitored by the ECB was unchanged from the previous period at 1.2 percent. The key private sector lending counterpart was very sluggish. The annual growth of lending to the household sector was down 0.1 percent, unchanged from February. The annual growth of lending for house purchase, the most important component of household loans, was down 0.1 percentage points to 0.5 percent in March. Lending to non-financial corporations stood at minus 3.0 percent in March, unchanged from the previous period. Lastly, borrowing by non-monetary financial intermediaries (excluding pension funds and life insurance companies) fell 10.8 percent following a 10.5 percent drop in February. March M3 money supply was up a sluggish 1.1 percent on the year and well short of its 4.5 percent reference rate. The 3-month moving average closely monitored by the ECB was unchanged from the previous period at 1.2 percent. The key private sector lending counterpart was very sluggish. The annual growth of lending to the household sector was down 0.1 percent, unchanged from February. The annual growth of lending for house purchase, the most important component of household loans, was down 0.1 percentage points to 0.5 percent in March. Lending to non-financial corporations stood at minus 3.0 percent in March, unchanged from the previous period. Lastly, borrowing by non-monetary financial intermediaries (excluding pension funds and life insurance companies) fell 10.8 percent following a 10.5 percent drop in February.
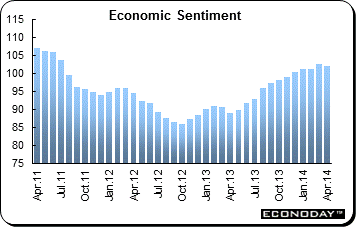 April EU Commission index of economic sentiment (ESI) was 102.0 and was down 0.5 points from March. The April setback was the first since April 2013 but was small enough to leave intact a rising trend consistent with a moderate pace of economic recovery. Industrial confidence was down 0.3 points on the month at minus 3.6 while morale in the consumer sector rose 0.7 points to minus 8.6. Elsewhere, sentiment in retail was minus 2.6, in services 3.5 and in construction minus 30.3. Regionally national ESIs declined in the Netherlands (minus 1.0 points), Spain (minus 1.0 points), Germany (minus 0.4 points) and France (minus 0.3 points) while Italy increased slightly (0.5 points). April EU Commission index of economic sentiment (ESI) was 102.0 and was down 0.5 points from March. The April setback was the first since April 2013 but was small enough to leave intact a rising trend consistent with a moderate pace of economic recovery. Industrial confidence was down 0.3 points on the month at minus 3.6 while morale in the consumer sector rose 0.7 points to minus 8.6. Elsewhere, sentiment in retail was minus 2.6, in services 3.5 and in construction minus 30.3. Regionally national ESIs declined in the Netherlands (minus 1.0 points), Spain (minus 1.0 points), Germany (minus 0.4 points) and France (minus 0.3 points) while Italy increased slightly (0.5 points).
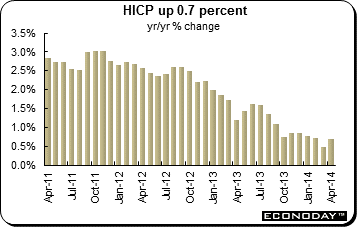 April flash harmonized index of consumer prices was up 0.7 percent from a year ago. This was an improvement from last month’s 0.5 percent increase. The rebound in the headline rate was more than matched by the core measure that excludes food, alcohol, tobacco and energy. The yearly increase here stood at 1.0 percent and 0.3 percentage points above its record equaling March low. However, inflationary pressures in the goods producing area remain extremely weak. Non-energy industrial goods prices were a minimal 0.1 percent higher on the year, a tick down on their end of quarter rate and 0.7 percentage points short of their rate in April 2013. Consequently, the strengthening in the overall core rate was wholly attributable to services where inflation hit 1.6 percent, 0.5 percentage points up on the March reading and easily the strongest performance so far in 2014. Energy inflation was minus 1.2 percent after minus 2.1 percent last time. April flash harmonized index of consumer prices was up 0.7 percent from a year ago. This was an improvement from last month’s 0.5 percent increase. The rebound in the headline rate was more than matched by the core measure that excludes food, alcohol, tobacco and energy. The yearly increase here stood at 1.0 percent and 0.3 percentage points above its record equaling March low. However, inflationary pressures in the goods producing area remain extremely weak. Non-energy industrial goods prices were a minimal 0.1 percent higher on the year, a tick down on their end of quarter rate and 0.7 percentage points short of their rate in April 2013. Consequently, the strengthening in the overall core rate was wholly attributable to services where inflation hit 1.6 percent, 0.5 percentage points up on the March reading and easily the strongest performance so far in 2014. Energy inflation was minus 1.2 percent after minus 2.1 percent last time.
 March retail sales volumes declined 0.7 percent. February's previously impressive 1.3 percent increase was revised down sharply to just 0.4 percent and unadjusted annual growth of purchases slumped by nearly 3 percentage points to minus 1.9 percent, only its second negative reading since July last year. March's decline left sales at their lowest point so far this year and contradict what has been a steadily rising trend in consumer confidence since September. Still, thanks to a strong start to 2014 (January volumes rose a monthly 2.0 percent), the first quarter still shows a respectable 1.3 percent increase from the fourth quarter. March retail sales volumes declined 0.7 percent. February's previously impressive 1.3 percent increase was revised down sharply to just 0.4 percent and unadjusted annual growth of purchases slumped by nearly 3 percentage points to minus 1.9 percent, only its second negative reading since July last year. March's decline left sales at their lowest point so far this year and contradict what has been a steadily rising trend in consumer confidence since September. Still, thanks to a strong start to 2014 (January volumes rose a monthly 2.0 percent), the first quarter still shows a respectable 1.3 percent increase from the fourth quarter.
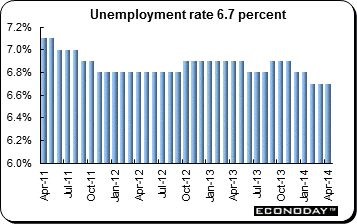 April jobless rate was unchanged at 6.7 percent. However, the number of people out of work fell 25,000 which is almost double the steeper revised 14,000 fall posted in March and the second largest drop since September 2011. Unemployment has now declined for five consecutive months and currently stands at 2.872 million. Prospects for further declines were boosted by another modest 2,000 increase in vacancies. This followed an unrevised 1,000 rise last time. April jobless rate was unchanged at 6.7 percent. However, the number of people out of work fell 25,000 which is almost double the steeper revised 14,000 fall posted in March and the second largest drop since September 2011. Unemployment has now declined for five consecutive months and currently stands at 2.872 million. Prospects for further declines were boosted by another modest 2,000 increase in vacancies. This followed an unrevised 1,000 rise last time.
 March household spending on manufactured goods posted a 0.5 percent monthly increase. However, February's gain was revised away to show a 0.1 percent slip and at just 0.6 percent, annual growth of purchases was still sluggish. Following a 2.6 percent monthly contraction in February, textiles dropped a further 2.3 percent in March and did most of the damage to the headline change. Autos (minus 0.5 percent) were also soft but household goods rose 0.8 percent and the other manufactured products category recorded a 0.5 percent increase. Total spending on goods was up 0.4 percent on the month but was a disappointingly steep 1.2 percent down from March 2013. March household spending on manufactured goods posted a 0.5 percent monthly increase. However, February's gain was revised away to show a 0.1 percent slip and at just 0.6 percent, annual growth of purchases was still sluggish. Following a 2.6 percent monthly contraction in February, textiles dropped a further 2.3 percent in March and did most of the damage to the headline change. Autos (minus 0.5 percent) were also soft but household goods rose 0.8 percent and the other manufactured products category recorded a 0.5 percent increase. Total spending on goods was up 0.4 percent on the month but was a disappointingly steep 1.2 percent down from March 2013.
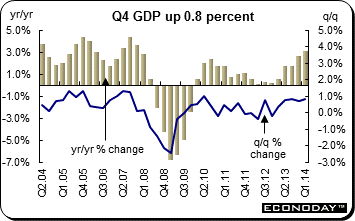 Preliminary first quarter gross domestic product was up 0.8 percent on the quarter and was up 3.1 percent from the same quarter a year ago. These data compare with an increase of 0.7 percent in the fourth quarter and an annual gain of 2.7 percent. Since it is the preliminary estimate, the ONS provided no details of the GDP expenditure components. However among the major output sectors, services were up 0.9 percent on the quarter and goods producing industries advanced 0.8 percent within which manufacturing output expanded 1.3 percent. Preliminary first quarter gross domestic product was up 0.8 percent on the quarter and was up 3.1 percent from the same quarter a year ago. These data compare with an increase of 0.7 percent in the fourth quarter and an annual gain of 2.7 percent. Since it is the preliminary estimate, the ONS provided no details of the GDP expenditure components. However among the major output sectors, services were up 0.9 percent on the quarter and goods producing industries advanced 0.8 percent within which manufacturing output expanded 1.3 percent.
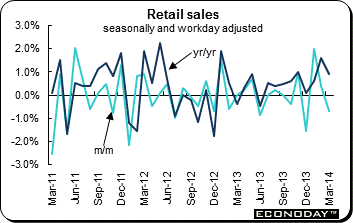
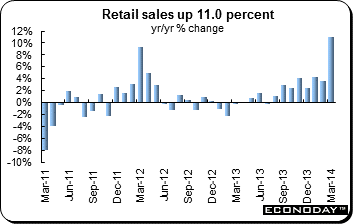 Retail sales soared 11.0 percent from a year ago in March, the last month before the increase in sales tax. Consumers hurried to snap up goods prior to the April 1 jump in the sales tax from 5 percent to 8 percent. Sales were up 3.6 percent the month before. All subcategories of sales advanced. Auto sales were up 9.4 percent after increasing 15 percent the month before. Machinery & equipment sales soared 37.5 percent after 11.1 percent in February. General merchandise sales jumped 19.6 percent after rising just 2 percent the month before. Fuel purchases were up 5.3 percent after an increase of 0.5 percent. Food & beverage sales were up 5.1 percent after increasing 1.5 percent in February. Retail sales soared 11.0 percent from a year ago in March, the last month before the increase in sales tax. Consumers hurried to snap up goods prior to the April 1 jump in the sales tax from 5 percent to 8 percent. Sales were up 3.6 percent the month before. All subcategories of sales advanced. Auto sales were up 9.4 percent after increasing 15 percent the month before. Machinery & equipment sales soared 37.5 percent after 11.1 percent in February. General merchandise sales jumped 19.6 percent after rising just 2 percent the month before. Fuel purchases were up 5.3 percent after an increase of 0.5 percent. Food & beverage sales were up 5.1 percent after increasing 1.5 percent in February.
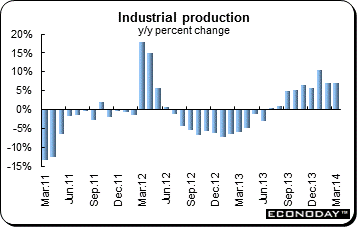 March industrial production was up a less than expected 0.3 percent on the month. Analysts expected a 0.5 percent increase. On the year, output was up 7.0 percent, also below expectations. Output in the March quarter was up 2.8 percent for the fifth consecutive quarterly increase. Among the industries that contributed to the increase were transport equipment, electronic parts and devices and ceramics, stone and clay products. Among the commodities that contributed to the increase were large passenger cars, turbine generators for general use and solar battery cells. According to METI, output is expected to contract 1.4 percent in April before edging up 0.1 percent in May. The industries that are expected to contribute to the decline in April are electronic parts and devices, fabricated metals and transport equipment. March industrial production was up a less than expected 0.3 percent on the month. Analysts expected a 0.5 percent increase. On the year, output was up 7.0 percent, also below expectations. Output in the March quarter was up 2.8 percent for the fifth consecutive quarterly increase. Among the industries that contributed to the increase were transport equipment, electronic parts and devices and ceramics, stone and clay products. Among the commodities that contributed to the increase were large passenger cars, turbine generators for general use and solar battery cells. According to METI, output is expected to contract 1.4 percent in April before edging up 0.1 percent in May. The industries that are expected to contribute to the decline in April are electronic parts and devices, fabricated metals and transport equipment.
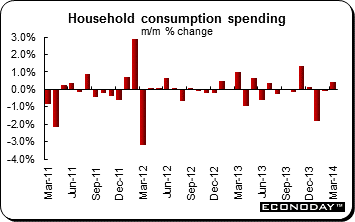
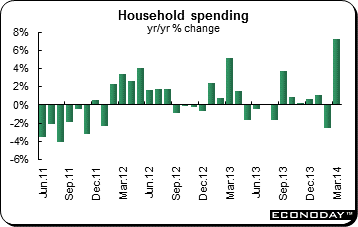 March household spending jumped 7.2 percent on the year after sinking 2.5 percent in February. Spending soared as consumers rushed to buy prior to the April first sales tax increase from 5 percent to 8 percent. All categories were up on the year. Furniture & household utensils soared 82.5 percent from a year ago. Among the other categories, clothing & footwear added 12.3 percent from last March and transportation & communication spending was 12.8 percent higher. The only category where spending declined was education which was down 12.8 percent. March household spending jumped 7.2 percent on the year after sinking 2.5 percent in February. Spending soared as consumers rushed to buy prior to the April first sales tax increase from 5 percent to 8 percent. All categories were up on the year. Furniture & household utensils soared 82.5 percent from a year ago. Among the other categories, clothing & footwear added 12.3 percent from last March and transportation & communication spending was 12.8 percent higher. The only category where spending declined was education which was down 12.8 percent.
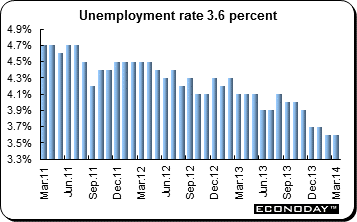 March unemployment rate was 3.6 percent for a second month. Expectations were for a decline to 3.5 percent. It is on a gradual downtrend and remains the lowest since July 2007, when it was also at 3.6 percent. In fiscal 2013, the unemployment rate slid to 3.9 percent from 4.3 percent in fiscal 2012. It was the lowest level since 3.8 percent in fiscal 2007. The pace of job creation from a year earlier accelerated to 520,000 in March from 410,000 in February, marking the 15th consecutive year-on-year increase. The number of unemployed declined 340,000 in March for the 46th straight drop from year earlier levels. The number of payroll jobs rose 140,000 from February to a seasonally adjusted 63.46 million in March. March unemployment rate was 3.6 percent for a second month. Expectations were for a decline to 3.5 percent. It is on a gradual downtrend and remains the lowest since July 2007, when it was also at 3.6 percent. In fiscal 2013, the unemployment rate slid to 3.9 percent from 4.3 percent in fiscal 2012. It was the lowest level since 3.8 percent in fiscal 2007. The pace of job creation from a year earlier accelerated to 520,000 in March from 410,000 in February, marking the 15th consecutive year-on-year increase. The number of unemployed declined 340,000 in March for the 46th straight drop from year earlier levels. The number of payroll jobs rose 140,000 from February to a seasonally adjusted 63.46 million in March.
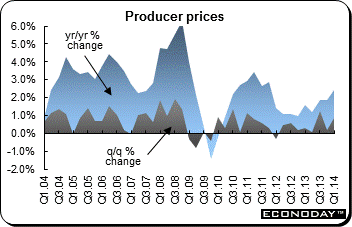 March quarter final demand producer prices were up a greater than expected 0.9 percent on the quarter and were up 2.5 percent from the same quarter a year ago. The increase was mainly due to rises in the prices received for petroleum refining and petroleum fuel manufacturing (up 7.6 percent), other agriculture (up7.8 percent) and bakery product manufacturing (up7.7 percent). The increases were partly offset by declines in the prices received for pharmaceutical and medicinal product manufacturing (down 4.6 percent). Intermediate demand prices were up 1.2 percent on the quarter and 3.3 percent on the year. Preliminary demand prices were up 1.5 percent and 3.5 percent on the year. March quarter final demand producer prices were up a greater than expected 0.9 percent on the quarter and were up 2.5 percent from the same quarter a year ago. The increase was mainly due to rises in the prices received for petroleum refining and petroleum fuel manufacturing (up 7.6 percent), other agriculture (up7.8 percent) and bakery product manufacturing (up7.7 percent). The increases were partly offset by declines in the prices received for pharmaceutical and medicinal product manufacturing (down 4.6 percent). Intermediate demand prices were up 1.2 percent on the quarter and 3.3 percent on the year. Preliminary demand prices were up 1.5 percent and 3.5 percent on the year.
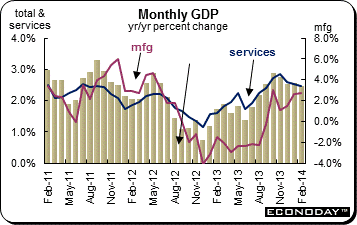 February monthly GDP was up 0.2 percent and 2.5 percent from the same month a year ago. The main area of strength was goods producing industries which saw output up a monthly 0.5 percent having already grown 0.9 percent at the start of year. Within this, manufacturing advanced 0.6 percent, construction 0.5 percent and mining, quarrying and oil and gas extraction 1.5 percent. A partial offset was seen in agriculture, forestry, fishing and hunting (down 1.5 percent). By contrast the service sector saw a meagre 0.1 percent monthly gain with only limited increases among the subsectors. The best performance was wholesale trade (0.6 percent) ahead of real estate, and rental and leasing (0.4 percent) and accommodation and food (also 0.4 percent). The only decline of any significance was in arts, entertainment and recreation (5.0 percent), although professional, scientific and technical services (down 0. 4 percent) also struggled. February monthly GDP was up 0.2 percent and 2.5 percent from the same month a year ago. The main area of strength was goods producing industries which saw output up a monthly 0.5 percent having already grown 0.9 percent at the start of year. Within this, manufacturing advanced 0.6 percent, construction 0.5 percent and mining, quarrying and oil and gas extraction 1.5 percent. A partial offset was seen in agriculture, forestry, fishing and hunting (down 1.5 percent). By contrast the service sector saw a meagre 0.1 percent monthly gain with only limited increases among the subsectors. The best performance was wholesale trade (0.6 percent) ahead of real estate, and rental and leasing (0.4 percent) and accommodation and food (also 0.4 percent). The only decline of any significance was in arts, entertainment and recreation (5.0 percent), although professional, scientific and technical services (down 0. 4 percent) also struggled.
Both the Bank of Japan and Federal Reserve announced that they left their respective policies unchanged after their meetings. April manufacturing PMIs — except in Japan — showed signs of continuing improvement. Both the UK and U.S. published first quarter GDP data with the former surpassing expectations and the latter missing expectations.
The Reserve Bank of Australia, the Bank of England and European Central Bank meet this week. They are not expected to change their respective monetary policies. April composite PMIs along with merchandise trade and industrial production data dominate the calendar.
| Central Bank activities |
|
| May 6 |
Australia |
Reserve Bank of Australia Monetary Policy Announcement |
| May 10 |
Eurozone |
European Central Bank Monetary Policy Announcement |
| May 10 |
UK |
Bank of England Monetary Policy Announcement |
| |
|
|
| The following indicators will be released this week... |
| Europe |
|
|
| May 5 |
Eurozone |
Producer Price Index (March) |
| May 6 |
Eurozone |
Retail Sales (March) |
| May 7 |
Germany |
Industrial Orders (March) |
|
France |
Merchandise Trade (March) |
|
|
Industrial Production (March) |
| May 8 |
Germany |
Industrial Production (March) |
| May 9 |
Germany |
Merchandise Trade (March) |
|
UK |
Industrial Production (March) |
|
|
Merchandise Trade (March) |
| |
|
|
| Asia/Pacific |
|
|
| May 6 |
Australia |
Merchandise Trade (March) |
| May 7 |
Australia |
Retail Sales (March) |
| May 8 |
Australia |
Labour Force Survey (April) |
|
China |
Merchandise Trade (April) |
| May 9 |
China |
Consumer Price Index (April) |
|
|
Producer Price Index (April) |
| |
|
|
| Americas |
|
|
| May 6 |
Canada |
International Trade Balance (March) |
| May 9 |
Canada |
Labour Force Survey (April) |
Anne D Picker is the author of International Economic Indicators and Central Banks.
|
