|
Equities were mixed in the first full week of trading in the New Year. Investor concerns were built around growth in China and the United States. Weak data from China — the continuing decline of producer prices and listless exports — and the U.S. — read the surprisingly weak employment report — only reinforced these concerns. Most indexes in the Asia Pacific retreated while those in Europe were up across the board for the week. U.S. equities were also mixed with the Dow declining and the S&P and Nasdaq gaining on the week.
December U.S. employment climbed a meager 74,000. The weather had been very rough and undoubtedly affected hiring in activities such as construction. However, the drop in the unemployment rate from 7.0 percent to 6.7 percent was troubling because it mainly was the result of shrinkage in the labor force. While some analysts had the knee jerk reaction that this will impact the Federal Reserve’s stimulus reduction plans, most think a single poor payroll report will not slow tapering or cause a U-turn in policy.
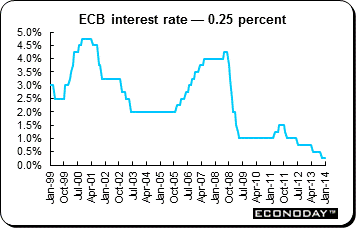 There were no surprises from the ECB's first Governing Council meeting of 2014. The key refinance rate was held at 0.25 percent and the deposit and marginal facility rates remained at zero percent and 0.75 percent respectively. The economy has shown further signs of sluggish recovery since the ECB’s last discussion and at least some of the more forward looking indicators are moving in the right direction. However, with December's flash inflation rate at only 0.8 percent, the core rate an even weaker record low of 0.7 percent and money and lending growth still soft, the threat of deflation continues to be a real concern and risks to the Eurozone economy remain firmly on the downside. There were no surprises from the ECB's first Governing Council meeting of 2014. The key refinance rate was held at 0.25 percent and the deposit and marginal facility rates remained at zero percent and 0.75 percent respectively. The economy has shown further signs of sluggish recovery since the ECB’s last discussion and at least some of the more forward looking indicators are moving in the right direction. However, with December's flash inflation rate at only 0.8 percent, the core rate an even weaker record low of 0.7 percent and money and lending growth still soft, the threat of deflation continues to be a real concern and risks to the Eurozone economy remain firmly on the downside.
As a result, ECB President Mario Draghi predictably adopted a determinedly dovish stance at his press conference and retained the now familiar language — the Governing Council strongly emphasizes that it will maintain an accommodative stance of monetary policy for as long as necessary. However, if anything the overall tone of his statement suggested an even greater willingness to loosen the monetary reins now than in December. The bottom line is that official interest rates will remain at current or even lower levels for an extended period of time and any move on policy in 2014 is much more likely to be a nod in favor of yet further monetary accommodation than tightening.
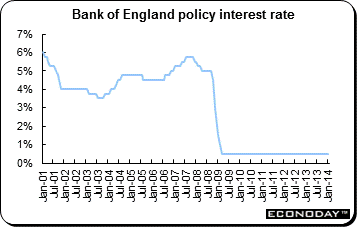 To nobody's surprise the Bank of England’s monetary policy committee once again left both the Bank Rate (0.5 percent) and asset purchase ceiling (£375 billion) unchanged at Thursday’s meeting. The MPC offered no forward guidance. It did not take the unusual step — but one which some investors had considered possible — of issuing a statement to address the speed at which Britain's unemployment rate is falling towards its threshold for considering a rate increase. To nobody's surprise the Bank of England’s monetary policy committee once again left both the Bank Rate (0.5 percent) and asset purchase ceiling (£375 billion) unchanged at Thursday’s meeting. The MPC offered no forward guidance. It did not take the unusual step — but one which some investors had considered possible — of issuing a statement to address the speed at which Britain's unemployment rate is falling towards its threshold for considering a rate increase.
Since the December meeting there have been some signs of a slight cooling in year-end growth but the fourth quarter as a whole is still shaping up very well and a solid economic recovery remains on track. The housing market in particular continues to enjoy a strong upswing. However, inflation has crept down to almost its 2 percent medium term target while non-mortgage borrowing — especially by non-financial corporations — is still soft and the unemployment rate, despite a 0.2 percentage point decline in the latest report, is 0.4 percentage points above its 7.0 percent knockout trigger. The MPC has stressed 7 percent is a "threshold" and not a "trigger" for action.
Much more interesting will be the February meeting, not so much for what looks all but certain to be another vote to maintain the status quo, but to see how the Bank revises its economic forecasts in its new Inflation Report. The speed with which the jobless rate has fallen has clearly taken the monetary authority by surprise and more of the same could see the 7 percent mark breached a good deal sooner than officially expected. However, there is a minimal chance that the BoE may raise the Bank Rate purely on the prospect of a sub-7 percent unemployment rate unless it radically alters its inflation forecast which, at this stage, is highly improbable. As such, before too long the MPC could well face the tricky task of explaining to financial markets why the Bank Rate is not being increased despite the labour market, on its own criteria, having tightened enough to be a potential threat to price stability.
|
|
2013 |
2014 |
% Change |
|
Index |
31-Dec |
Jan 3 |
Jan 10 |
Week |
2014 |
| Asia/Pacific |
|
|
|
|
|
|
| Australia |
All Ordinaries |
5353.1 |
5351.8 |
5316.3 |
-0.7% |
14.0% |
| Japan |
Nikkei 225 |
16291.3 |
16291.3 |
15912.1 |
-2.3% |
53.1% |
| Hong Kong |
Hang Seng |
23306.4 |
22817.3 |
22846.3 |
0.1% |
0.8% |
| S. Korea |
Kospi |
2011.3 |
1946.1 |
1938.5 |
-0.4% |
-2.9% |
| Singapore |
STI |
3167.4 |
3131.5 |
3143.9 |
0.4% |
-0.7% |
| China |
Shanghai Composite |
2116.0 |
2083.1 |
2013.3 |
-3.4% |
-11.3% |
|
|
|
|
|
|
|
| India |
Sensex 30 |
21170.7 |
20851.3 |
20758.5 |
-0.4% |
6.9% |
| Indonesia |
Jakarta Composite |
4274.2 |
4257.7 |
4255.0 |
-0.1% |
-1.4% |
| Malaysia |
KLCI |
1867.0 |
1834.7 |
1826.6 |
-0.4% |
8.2% |
| Philippines |
PSEi |
5889.8 |
5947.9 |
5842.88 |
-1.8% |
0.5% |
| Taiwan |
Taiex |
8611.5 |
8546.5 |
8529.0 |
-0.2% |
10.8% |
| Thailand |
SET |
1298.7 |
1224.6 |
1255.5 |
2.5% |
-9.8% |
|
|
|
|
|
|
|
| Europe |
|
|
|
|
|
|
| UK |
FTSE 100 |
6749.1 |
6730.7 |
6739.9 |
0.1% |
14.3% |
| France |
CAC |
4296.0 |
4247.7 |
4250.6 |
0.1% |
16.7% |
| Germany |
XETRA DAX |
9552.2 |
9435.2 |
9473.2 |
0.4% |
24.4% |
| Italy |
FTSE MIB |
18967.7 |
19112.7 |
19569.0 |
2.4% |
20.3% |
| Spain |
IBEX 35 |
9916.7 |
9798.0 |
10290.6 |
5.0% |
26.0% |
| Sweden |
OMX Stockholm 30 |
1333.0 |
1325.1 |
1329.8 |
0.4% |
20.4% |
| Switzerland |
SMI |
8203.0 |
8270.5 |
8365.1 |
1.1% |
22.6% |
|
|
|
|
|
|
|
| North America |
|
|
|
|
|
|
| United States |
Dow |
16576.7 |
16470.0 |
16437.1 |
-0.2% |
25.4% |
|
NASDAQ |
4176.6 |
4131.9 |
4174.7 |
1.0% |
38.3% |
|
S&P 500 |
1848.4 |
1831.4 |
1842.4 |
0.6% |
29.2% |
| Canada |
S&P/TSX Comp. |
13621.6 |
13548.9 |
13747.5 |
1.5% |
10.6% |
| Mexico |
Bolsa |
42727.1 |
42065.0 |
42458.5 |
0.9% |
-2.9% |
 In contrast to the equity markets in the Asia Pacific region, European indexes advanced for the week after being mixed in the previous holiday shortened week. Although they pared early gains on Friday after the disappointing U.S. employment report, the indexes managed to stay positive for the day and week. The FTSE and CAC edged up 0.1 percent, the DAX gained 0.4 percent and the SMI advanced 1.1 percent in choppy trading. It appears that investors here are becoming more comfortable with the gradual withdrawal of U.S. monetary stimulus as the economy improves. In contrast to the equity markets in the Asia Pacific region, European indexes advanced for the week after being mixed in the previous holiday shortened week. Although they pared early gains on Friday after the disappointing U.S. employment report, the indexes managed to stay positive for the day and week. The FTSE and CAC edged up 0.1 percent, the DAX gained 0.4 percent and the SMI advanced 1.1 percent in choppy trading. It appears that investors here are becoming more comfortable with the gradual withdrawal of U.S. monetary stimulus as the economy improves.
Standard & Poor's confirmed Germany's coveted 'AAA' rating on Friday as the economy remains highly diversified and competitive with the ability to absorb large economic and financial shocks. The 'stable' outlook reflects the assessment that public finances and a strong external balance sheet will continue to withstand potential financial and economic shocks. The rating agency expects Germany to grow above 1.5 percent in 2014 to 2016. The nation has avoided the need for significant private sector deleveraging and fiscal consolidation.
Ireland returned to debt markets with the sale of a 10-year bond after completing its international bailout last month. The nation raised €3.75 billion in the auction, exceeding its minimum target. Ireland’s success may spur Portugal, also an indebted euro-area nation, to reenter the market. Ireland’s existing 10 year bond yield declined to the lowest for any benchmark security in almost eight years. Comparable benchmark bond yields for Portugal and Italy fell to their lowest since May after the sale, while Greek borrowing costs tumbled to the lowest since May 2010. Spain’s benchmark 10-year bond yield fell to its lowest since April 2010.
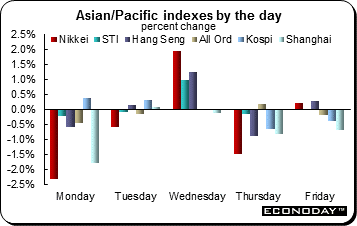 Equities were mostly lower last week as investors digested Chinese price and trade data while waiting for the U.S. employment report which was released after markets here were closed for the week. The STI was up 0.4 percent, the Hang Seng edged up 0.1 percent and the SET rebounded 2.5 percent after sinking 5.7 percent the week before. Thailand has been beset by political uncertainties and equities have been falling there. Equities were mostly lower last week as investors digested Chinese price and trade data while waiting for the U.S. employment report which was released after markets here were closed for the week. The STI was up 0.4 percent, the Hang Seng edged up 0.1 percent and the SET rebounded 2.5 percent after sinking 5.7 percent the week before. Thailand has been beset by political uncertainties and equities have been falling there.
The Nikkei dropped 2.3 percent on the week after being closed for holidays four of five days the previous week. The Nikkei experienced its worst week since mid-October, as steep gains over the past two months acted as an incentive for buyers to take profits. If the first week of 2014 trading is any indication, investors in Japanese equities had best prepare themselves for a volatile year. Prompted by a stagnant U.S. dollar, U.S., hedge funds started to unwind the positions that they held for over the past two months, when the Nikkei added over 13 percent.
The Shanghai Composite declined for a second week, this time by 3.4 percent after losing 0.9 percent the week before. The index was dragged down by concerns about slowing economic growth. Sentiment on Chinese stocks sharply improved in the final weeks of 2013 after Communist Party leaders said they would reform the country's state owned enterprises, open up its capital markets and loosen its one child policy, among other plans.
Analysts were dismayed by December’s merchandise trade report from China. Export growth weakened casting doubt on a hoped for recovery in demand from the U.S. and Europe. Exports in December were up just 4.3 percent compared with the same month a year earlier and down from a much stronger 12.7 percent increase in November. China's traditionally important export sector faces a range of challenges, from higher labor and land costs to an appreciating currency that eats into its competitiveness. As the U.S. and Europe regain economic momentum, experts expect China to benefit from better export demand. But the slow pace of improvement in December is a letdown for many.
But the poor export growth may in part be due to more than trade flows. China's State Administration of Foreign Exchange said in December it was tightening supervision of trade financing to stop speculative "hot money" flows from being disguised as trade. That likely dragged down an already weak growth number. Official trade data showed a jump in December 2012 that many economists attributed to capital flows misreported as trade. Strong imports meant that the country's trade surplus — the difference between exports and imports — narrowed to $25.6 billion from $33.8 billion the previous month. The decline relieves a source of potential tension with the U.S., where some politicians worry that China keeps its currency too cheap, benefiting its exporters but hitting China's potential as a market for U.S. goods.
 The U.S. dollar declined against the euro, yen, pound sterling, Swiss franc and Australian dollar for the week after U.S. employers added the fewest jobs in two years in December, reducing expectations that the Federal Reserve will continue to reduce the bond buying it uses to support economic growth. The U.S. currency advanced against the Canadian dollar after Canada posted an equally dismal labor force report. While the U.S. added 74,000 jobs, Canada saw employment plummet by 45,000 and its unemployment rate jump from 6.9 percent to 7.2 percent. The U.S. dollar declined against the euro, yen, pound sterling, Swiss franc and Australian dollar for the week after U.S. employers added the fewest jobs in two years in December, reducing expectations that the Federal Reserve will continue to reduce the bond buying it uses to support economic growth. The U.S. currency advanced against the Canadian dollar after Canada posted an equally dismal labor force report. While the U.S. added 74,000 jobs, Canada saw employment plummet by 45,000 and its unemployment rate jump from 6.9 percent to 7.2 percent.
Trading during the week was choppy as the crucial report was awaited. Other data released during the week was predictably mixed. Weather played a key role in the U.S. and elsewhere with frigid temperatures far below zero Fahrenheit thanks to the polar vortex.
|
|
2013 |
2014 |
% Change |
|
|
Dec 31 |
Jan 3 |
Jan 10 |
Week |
2014 |
| U.S. $ per currency |
|
|
|
|
|
|
| Australia |
A$ |
0.893 |
0.894 |
0.900 |
0.6% |
0.8% |
| New Zealand |
NZ$ |
0.823 |
0.827 |
0.830 |
0.3% |
0.9% |
| Canada |
C$ |
0.942 |
0.940 |
0.918 |
-2.4% |
-2.5% |
| Eurozone |
euro (€) |
1.376 |
1.358 |
1.367 |
0.6% |
-0.6% |
| UK |
pound sterling (£) |
1.656 |
1.641 |
1.649 |
0.5% |
-0.5% |
|
|
|
|
|
|
|
| Currency per U.S. $ |
|
|
|
|
|
|
| China |
yuan |
6.054 |
6.052 |
6.052 |
0.0% |
0.0% |
| Hong Kong |
HK$* |
7.754 |
7.754 |
7.754 |
0.0% |
0.0% |
| India |
rupee |
61.800 |
62.155 |
61.905 |
0.4% |
-0.2% |
| Japan |
yen |
105.310 |
104.780 |
104.080 |
0.7% |
1.2% |
| Malaysia |
ringgit |
3.276 |
3.289 |
3.270 |
0.6% |
0.2% |
| Singapore |
Singapore $ |
1.262 |
1.267 |
1.264 |
0.2% |
-0.2% |
| South Korea |
won |
1049.800 |
1055.230 |
1061.380 |
-0.6% |
-1.1% |
| Taiwan |
Taiwan $ |
29.807 |
29.961 |
30.082 |
-0.4% |
-0.9% |
| Thailand |
baht |
32.720 |
33.015 |
33.000 |
0.0% |
-0.8% |
| Switzerland |
Swiss franc |
0.892 |
0.905 |
0.903 |
0.3% |
-1.2% |
| *Pegged to U.S. dollar |
|
|
|
|
|
|
| Source: Bloomberg |
|
|
|
|
|
|
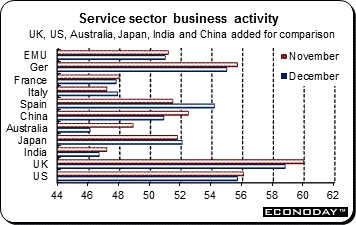 December services PMI fell to 51.0 from 51.2 in November. However, the composite output index was up 0.6 points to 52.1, its second highest mark in two and a half years. Growth in services slowed to its weakest rate in four months, mainly reflecting subdued activity in domestic markets. However, companies remained positive about the economic outlook and sentiment rose to its highest level since mid-2011 and employment stabilized after modest declines in October and November. Input cost inflation slipped to a 6-month low and output charges were down for a 25th consecutive month. Growth remains solid yet uneven as composite output indices from Germany (55.0), Ireland (58.6) and now Spain (53.9) contrast worryingly with another poor reading out of France (47.3). December services PMI fell to 51.0 from 51.2 in November. However, the composite output index was up 0.6 points to 52.1, its second highest mark in two and a half years. Growth in services slowed to its weakest rate in four months, mainly reflecting subdued activity in domestic markets. However, companies remained positive about the economic outlook and sentiment rose to its highest level since mid-2011 and employment stabilized after modest declines in October and November. Input cost inflation slipped to a 6-month low and output charges were down for a 25th consecutive month. Growth remains solid yet uneven as composite output indices from Germany (55.0), Ireland (58.6) and now Spain (53.9) contrast worryingly with another poor reading out of France (47.3).
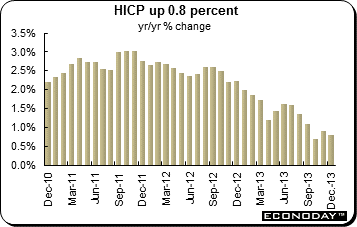 December flash harmonized index of consumer prices were up just 0.8 percent from a year ago. Core inflation (HICP less energy, food, alcohol and tobacco) declined 0.2 percentage points to a lowly 0.7 percent on the year. Energy prices were unchanged while food, alcohol and tobacco were 1.8 percent more expensive on the year after a 1.6 percent increase in November. Inflation in the non-energy industrial goods sector was unchanged at 0.2 percent but dropped 0.4 percentage points to 1.0 percent in services. December flash harmonized index of consumer prices were up just 0.8 percent from a year ago. Core inflation (HICP less energy, food, alcohol and tobacco) declined 0.2 percentage points to a lowly 0.7 percent on the year. Energy prices were unchanged while food, alcohol and tobacco were 1.8 percent more expensive on the year after a 1.6 percent increase in November. Inflation in the non-energy industrial goods sector was unchanged at 0.2 percent but dropped 0.4 percentage points to 1.0 percent in services.
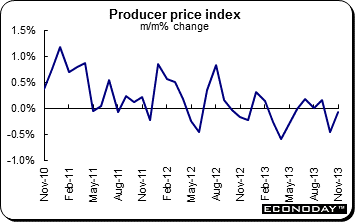 November producer prices (excluding construction) were down 0.1 percent following October's unrevised 0.5 percent drop. This left the PPI 1.2 percent lower on the year, its fifth consecutive year-on-year decline. Once again, prices were soft across the board and excluding energy (unchanged from October) the PPI also edged 0.1 percent lower on the month and was 0.3 percent softer on the year. Charges for capital goods were flat from October as were consumer durable and nondurable prices. Intermediates were rather weaker, declining 0.2 percent. Regionally, monthly declines were commonplace with the steepest registered by Estonia (1.8 percent). The only increases of any size occurred in France (0.5 percent) and the Netherlands (0.3 percent). November producer prices (excluding construction) were down 0.1 percent following October's unrevised 0.5 percent drop. This left the PPI 1.2 percent lower on the year, its fifth consecutive year-on-year decline. Once again, prices were soft across the board and excluding energy (unchanged from October) the PPI also edged 0.1 percent lower on the month and was 0.3 percent softer on the year. Charges for capital goods were flat from October as were consumer durable and nondurable prices. Intermediates were rather weaker, declining 0.2 percent. Regionally, monthly declines were commonplace with the steepest registered by Estonia (1.8 percent). The only increases of any size occurred in France (0.5 percent) and the Netherlands (0.3 percent).
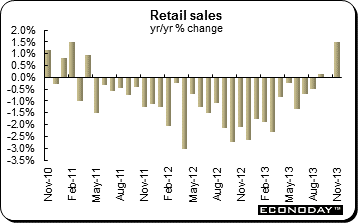 November retail sales rebounded 1.4 percent for their best performance since December 2009 after dropping in both September and October. Although October's drop was doubled to 0.4 percent, annual growth of purchases jumped from a decline of 0.3 percent to a gain of 1.6 percent, only its second positive reading of the year to date. Moreover, there was also good news in the (limited) headline breakdown. This revealed a solid 1.9 percent (excluding auto fuel) monthly bounce in non-food demand while food, drink and tobacco volumes advanced 1.1 percent. Regionally it was an unusually consistent story with Malta (down 2.1 percent) the only EMU member to see a monthly decline. Elsewhere there were especially good results in Portugal (3.1 percent), France (2.1 percent), Spain (1.9 percent), Belgium (1.7 percent) and Germany (1.5 percent). November retail sales rebounded 1.4 percent for their best performance since December 2009 after dropping in both September and October. Although October's drop was doubled to 0.4 percent, annual growth of purchases jumped from a decline of 0.3 percent to a gain of 1.6 percent, only its second positive reading of the year to date. Moreover, there was also good news in the (limited) headline breakdown. This revealed a solid 1.9 percent (excluding auto fuel) monthly bounce in non-food demand while food, drink and tobacco volumes advanced 1.1 percent. Regionally it was an unusually consistent story with Malta (down 2.1 percent) the only EMU member to see a monthly decline. Elsewhere there were especially good results in Portugal (3.1 percent), France (2.1 percent), Spain (1.9 percent), Belgium (1.7 percent) and Germany (1.5 percent).
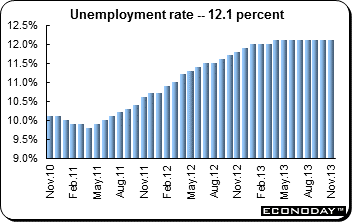 November seasonally adjusted unemployment was up just 4,000 to 19.241 million to leave the jobless rate steady at 12.1 percent, the fourth consecutive month to register this level. Among the larger members, Italy was the only country to see a rise in its rate which, at 12.7 percent and up a couple of ticks from October, saw another unwanted record high. France (10.8 percent), Germany (5.2 percent) and Spain (26.7 percent) were all unchanged although just Germany in this group could boost a fall on the year according to Eurostat’s measure of unemployment. Elsewhere, Cyprus (17.3 percent) saw no rise for the first month in a long while but the Slovenian rate climbed 0.2 percentage points to 9.9 percent. At the bottom of the pile with the lowest unemployment was again Austria (4.8 percent). The relative stability of the overall jobs market will be well received by Eurozone policymakers who will also breathe a sigh of relief at an unchanged youth unemployment rate (record equaling 24.2 percent) following a 0.2 percentage point downward revision to its October level. November seasonally adjusted unemployment was up just 4,000 to 19.241 million to leave the jobless rate steady at 12.1 percent, the fourth consecutive month to register this level. Among the larger members, Italy was the only country to see a rise in its rate which, at 12.7 percent and up a couple of ticks from October, saw another unwanted record high. France (10.8 percent), Germany (5.2 percent) and Spain (26.7 percent) were all unchanged although just Germany in this group could boost a fall on the year according to Eurostat’s measure of unemployment. Elsewhere, Cyprus (17.3 percent) saw no rise for the first month in a long while but the Slovenian rate climbed 0.2 percentage points to 9.9 percent. At the bottom of the pile with the lowest unemployment was again Austria (4.8 percent). The relative stability of the overall jobs market will be well received by Eurozone policymakers who will also breathe a sigh of relief at an unchanged youth unemployment rate (record equaling 24.2 percent) following a 0.2 percentage point downward revision to its October level.
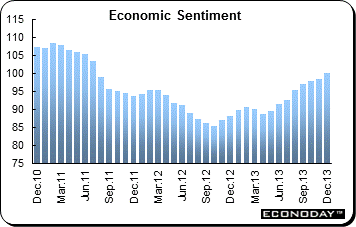 December EU economic sentiment (ESI) climbed 1.6 points to a reading of 100.0, the first time that level has been achieved since July 2011. It was the ESI’s eighth consecutive monthly increase and reflected broad based improvements in morale across the five component sectors. Confidence in industry was up 0.5 points at minus 3.4 and in the household category was 1.8 points higher at minus 13.6. Retail saw a 2.7 point bounce to minus 5.1 while services improved 1.1 points to 0.2 and construction 3.6 points to minus 27.1. Regionally, among the larger member states the advance in sentiment was led by Spain (up 4 points) and Italy (up 2.3 points) as France and Germany (both up just 0.3 points) showed little change. Within this group, France (95.3) and Italy (96.2) are still well short of their common 100 long-run historical norm. December EU economic sentiment (ESI) climbed 1.6 points to a reading of 100.0, the first time that level has been achieved since July 2011. It was the ESI’s eighth consecutive monthly increase and reflected broad based improvements in morale across the five component sectors. Confidence in industry was up 0.5 points at minus 3.4 and in the household category was 1.8 points higher at minus 13.6. Retail saw a 2.7 point bounce to minus 5.1 while services improved 1.1 points to 0.2 and construction 3.6 points to minus 27.1. Regionally, among the larger member states the advance in sentiment was led by Spain (up 4 points) and Italy (up 2.3 points) as France and Germany (both up just 0.3 points) showed little change. Within this group, France (95.3) and Italy (96.2) are still well short of their common 100 long-run historical norm.
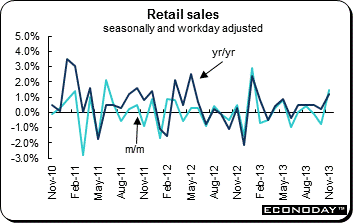 November retail sales rebounded after declining in both September and October. Sales jumped 1.5 percent — the strongest since January which boosted annual growth of purchases to 1.6 percent from a marginally firmer revised decline of 0.1 percent last time. However, despite the November bounce, average purchases in October/November were flat when compared with their third quarter mean so a good Christmas period will be needed if the sector is to make any significant positive contribution to real GDP growth last quarter. November retail sales rebounded after declining in both September and October. Sales jumped 1.5 percent — the strongest since January which boosted annual growth of purchases to 1.6 percent from a marginally firmer revised decline of 0.1 percent last time. However, despite the November bounce, average purchases in October/November were flat when compared with their third quarter mean so a good Christmas period will be needed if the sector is to make any significant positive contribution to real GDP growth last quarter.
 December unemployment dropped 15,000 to a seasonally adjusted 2.965 million. However, this was not enough to move the jobless rate which remained at 6.9 percent for its fourth consecutive month. Job vacancies were up 7,000 after a 4,000 increase in mid-quarter, although in part this probably reflected a growing shortage of skilled workers in some industries. This report leaves a fourth quarter decline in unemployment of 5,000 following an increase in excess of 20,000 in the previous period. December unemployment dropped 15,000 to a seasonally adjusted 2.965 million. However, this was not enough to move the jobless rate which remained at 6.9 percent for its fourth consecutive month. Job vacancies were up 7,000 after a 4,000 increase in mid-quarter, although in part this probably reflected a growing shortage of skilled workers in some industries. This report leaves a fourth quarter decline in unemployment of 5,000 following an increase in excess of 20,000 in the previous period.
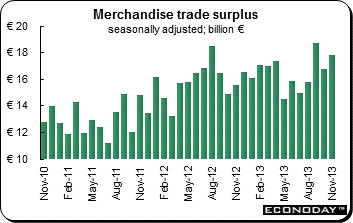 November merchandise trade surplus widened out from a marginally smaller revised €16.7 billion in October to €17.8 billion. The unadjusted surplus was €18.1 billion, up from €17.9 billion at the start of the quarter. The headline improvement was partly attributable to a 0.3 percent monthly increase in exports — their fourth straight gain — but was driven more by a 1.1 percent drop in imports, their second decline in the last three months. Annual export growth now stands at just 1.0 percent with sales to the other EMU states up an even weaker 0.1 percent. Imports now show a 0.4 percent yearly decline with purchases from both the rest of the EMU bloc and non-EU countries down 1.0 percent. November merchandise trade surplus widened out from a marginally smaller revised €16.7 billion in October to €17.8 billion. The unadjusted surplus was €18.1 billion, up from €17.9 billion at the start of the quarter. The headline improvement was partly attributable to a 0.3 percent monthly increase in exports — their fourth straight gain — but was driven more by a 1.1 percent drop in imports, their second decline in the last three months. Annual export growth now stands at just 1.0 percent with sales to the other EMU states up an even weaker 0.1 percent. Imports now show a 0.4 percent yearly decline with purchases from both the rest of the EMU bloc and non-EU countries down 1.0 percent.
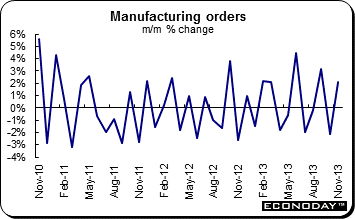 November manufacturing orders jumped 2.1 percent on the month to just offset a slightly smaller revised October decline and left orders 6.8 percent higher on the year, up from a 2.0 percent annual increase last time. The recovery was roughly evenly split between the domestic and overseas markets with the former up 1.9 percent from October and the latter 2.2 percent to the good despite a flat performance by the rest of the Eurozone. Within the total advance, capital goods followed a 4.9 percent monthly slump with a 3.2 percent increase while consumer goods gained 2.1 percent. Basics lagged behind with a 0.4 percent increase but this came after a 2.1 percent increase in October. November manufacturing orders jumped 2.1 percent on the month to just offset a slightly smaller revised October decline and left orders 6.8 percent higher on the year, up from a 2.0 percent annual increase last time. The recovery was roughly evenly split between the domestic and overseas markets with the former up 1.9 percent from October and the latter 2.2 percent to the good despite a flat performance by the rest of the Eurozone. Within the total advance, capital goods followed a 4.9 percent monthly slump with a 3.2 percent increase while consumer goods gained 2.1 percent. Basics lagged behind with a 0.4 percent increase but this came after a 2.1 percent increase in October.
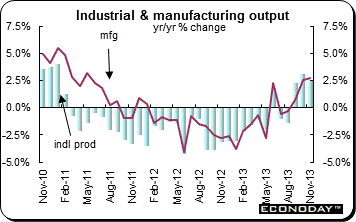
 November industrial production rebounded 1.9 percent on the month and was the sharpest since June. It followed an unrevised 1.2 percent drop in October and boosted annual workday adjusted growth from 1.1 percent to 3.5 percent. Excluding construction, output was up 2.4 percent and 3.9 percent on the year. Overall manufacturing output climbed a very solid monthly 3.1 percent with especially hefty gains seen in capital goods (5.1 percent) and consumer durables (3.7 percent). However, outside of the erratic sectors of energy (down 3.3 percent) and construction (down 1.7 percent), it was positive news across the board and there were gains also in intermediates (1.2 percent) as well as consumer nondurables (1.5 percent). November industrial production rebounded 1.9 percent on the month and was the sharpest since June. It followed an unrevised 1.2 percent drop in October and boosted annual workday adjusted growth from 1.1 percent to 3.5 percent. Excluding construction, output was up 2.4 percent and 3.9 percent on the year. Overall manufacturing output climbed a very solid monthly 3.1 percent with especially hefty gains seen in capital goods (5.1 percent) and consumer durables (3.7 percent). However, outside of the erratic sectors of energy (down 3.3 percent) and construction (down 1.7 percent), it was positive news across the board and there were gains also in intermediates (1.2 percent) as well as consumer nondurables (1.5 percent).
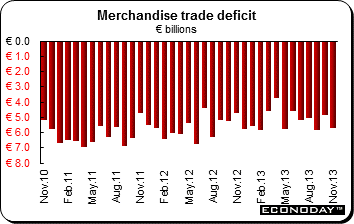 November seasonally adjusted merchandise trade deficit widened from a marginally revised €4.8 billion in October to a much larger €5.7 billion in November. The mid-quarter deterioration was largely attributable to a 2.1 percent monthly drop in exports, itself reflecting reversals in the transportation equipment and industrial machinery sectors. The setbacks here were compounded to a small extent by a 0.2 percent increase in imports generated by higher purchases of energy. November seasonally adjusted merchandise trade deficit widened from a marginally revised €4.8 billion in October to a much larger €5.7 billion in November. The mid-quarter deterioration was largely attributable to a 2.1 percent monthly drop in exports, itself reflecting reversals in the transportation equipment and industrial machinery sectors. The setbacks here were compounded to a small extent by a 0.2 percent increase in imports generated by higher purchases of energy.
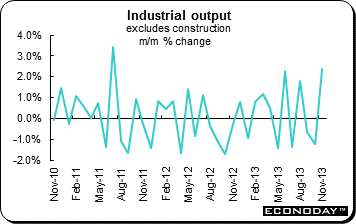
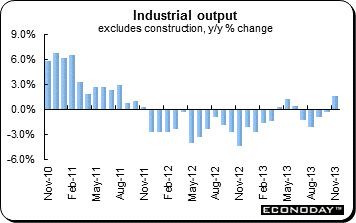 November industrial output excluding construction was up 1.3 percent after October’s revised decline of 0.5 percent. On the year, output was up 1.5 percent, its best performance since August 2011. The headline statistics were flattered by a 6.3 percent monthly surge in the energy and extracted goods sector. More significantly, manufacturing posted a modest 0.2 percent advance, this following a 0.3 percent gain at the start of the quarter. Within this, coke & refined petroleum products were up more than 22 percent while transport equipment gained 1.3 percent and both the food & drink and the other manufactured goods sectors, 0.1 percent. Construction also edged 0.1 percent firmer. November industrial output excluding construction was up 1.3 percent after October’s revised decline of 0.5 percent. On the year, output was up 1.5 percent, its best performance since August 2011. The headline statistics were flattered by a 6.3 percent monthly surge in the energy and extracted goods sector. More significantly, manufacturing posted a modest 0.2 percent advance, this following a 0.3 percent gain at the start of the quarter. Within this, coke & refined petroleum products were up more than 22 percent while transport equipment gained 1.3 percent and both the food & drink and the other manufactured goods sectors, 0.1 percent. Construction also edged 0.1 percent firmer.
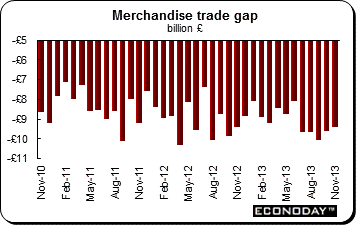 November shortfall on global trade in goods narrowed slightly from Stg9.7 billion in October to Stg9.4 billion. The modest improvement reflected a 2.0 percent rebound in exports, partially offset by a 0.8 percent increase in imports. However, excluding oil and other erratic items, the deficit was only unchanged at Stg8.4 billion as a 2.8 percent monthly bounce in exports was cancelled out by a 2.0 percent advance in imports. The bilateral red ink with the rest of the EU shrunk Stg0.1 billion to Stg6.4 billion with exports climbing almost 5 percent from October and imports gaining 2.8 percent. Meantime, the shortfall with the rest of the world was similarly Stg0.1 billion smaller at Stg3.0 billion as exports fell 0.7 percent and imports declined 1.1 percent. November shortfall on global trade in goods narrowed slightly from Stg9.7 billion in October to Stg9.4 billion. The modest improvement reflected a 2.0 percent rebound in exports, partially offset by a 0.8 percent increase in imports. However, excluding oil and other erratic items, the deficit was only unchanged at Stg8.4 billion as a 2.8 percent monthly bounce in exports was cancelled out by a 2.0 percent advance in imports. The bilateral red ink with the rest of the EU shrunk Stg0.1 billion to Stg6.4 billion with exports climbing almost 5 percent from October and imports gaining 2.8 percent. Meantime, the shortfall with the rest of the world was similarly Stg0.1 billion smaller at Stg3.0 billion as exports fell 0.7 percent and imports declined 1.1 percent.
 November industrial production and manufacturing output posted no change from their respective October levels. Moreover, this followed slightly weaker revised gains at the start of the quarter. Annual growth of the former dipped 0.7 percentage points to 2.5 percent but manufacturing accelerated by a couple of ticks 2.8 percent courtesy of favorable base effects. Within manufacturing there were monthly gains in eight of the thirteen subsectors among which the most impressive was registered by rubber, plastic products & other non-metallic mineral products where output climbed 2.1 percent. Food, drink & tobacco advanced 0.9 percent and basic metals & metal products 0.4 percent. On the downside, the other machinery & equipment category posted a 1.7 percent monthly drop and there were significant declines too in pharmaceuticals (1.6 percent) and transport equipment (0.6 percent). Elsewhere within overall production, mining & quarrying contracted a monthly 2.2 percent and water supply & sewerage 0.3 percent. There was also a 3.0 percent slide in oil & gas extraction but electricity, gas, steam & air conditioning climbed 3.0 percent. November industrial production and manufacturing output posted no change from their respective October levels. Moreover, this followed slightly weaker revised gains at the start of the quarter. Annual growth of the former dipped 0.7 percentage points to 2.5 percent but manufacturing accelerated by a couple of ticks 2.8 percent courtesy of favorable base effects. Within manufacturing there were monthly gains in eight of the thirteen subsectors among which the most impressive was registered by rubber, plastic products & other non-metallic mineral products where output climbed 2.1 percent. Food, drink & tobacco advanced 0.9 percent and basic metals & metal products 0.4 percent. On the downside, the other machinery & equipment category posted a 1.7 percent monthly drop and there were significant declines too in pharmaceuticals (1.6 percent) and transport equipment (0.6 percent). Elsewhere within overall production, mining & quarrying contracted a monthly 2.2 percent and water supply & sewerage 0.3 percent. There was also a 3.0 percent slide in oil & gas extraction but electricity, gas, steam & air conditioning climbed 3.0 percent.
 November seasonally adjusted goods and services deficit narrowed to A$118 million from a revised deficit of A$258 million. Exports were up 0.3 percent on the month and 10.6% on the year. Both rural and non-rural goods were up 1.0 percent. Services were also up 1.0 percent. The main components that contributed to the increase in rural goods exports were other rural (2 percent) and meat and meat preparations (2 percent). Partly offsetting these increases was a 3 percent decline in the cereal grains and cereal preparations component. The main component contributing to the increase in non-rural exports was metal ores and minerals, up 4 percent. However, partly offsetting the increase was a 6 percent drop in the coal, coke and briquettes component. November imports dropped 0.5 percent on the month and 1.3 percent from a year ago. Consumption goods dropped 2 percent and non-monetary gold plunged 12 percent. Intermediate and other merchandise goods were unchanged. Capital goods and services both were 1 percent lower. November seasonally adjusted goods and services deficit narrowed to A$118 million from a revised deficit of A$258 million. Exports were up 0.3 percent on the month and 10.6% on the year. Both rural and non-rural goods were up 1.0 percent. Services were also up 1.0 percent. The main components that contributed to the increase in rural goods exports were other rural (2 percent) and meat and meat preparations (2 percent). Partly offsetting these increases was a 3 percent decline in the cereal grains and cereal preparations component. The main component contributing to the increase in non-rural exports was metal ores and minerals, up 4 percent. However, partly offsetting the increase was a 6 percent drop in the coal, coke and briquettes component. November imports dropped 0.5 percent on the month and 1.3 percent from a year ago. Consumption goods dropped 2 percent and non-monetary gold plunged 12 percent. Intermediate and other merchandise goods were unchanged. Capital goods and services both were 1 percent lower.
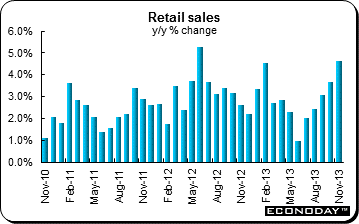 November retail sales were up 0.7 percent and 4.6 percent from a year ago. This was the seventh consecutive monthly increase and better than the 0.4 percent expected by analysts. The pace of monthly sales has been increasing with gains of 0.5 percent in August, 0.9 percent in September and 0.5 percent in October. Sales increased in other retailing (2.1 percent), cafes, restaurants & takeaway food services (2.2 percent), clothing, footwear & personal accessory retailing (1.7 percent) and household goods retailing (0.7 percent). These increases were partially offset by a decline in department stores (down 2.0 percent) and food retailing (down 0.1 percent). Turnover rose in Victoria (0.9 percent), Western Australia (1.3 percent), New South Wales (0.4 percent), Queensland (0.5 percent), South Australia (0.9 percent), the Northern Territory (1.7 percent) and Tasmania (0.5 percent). However, sales were lower in the Australian Capital Territory (down 0.2 percent). November retail sales were up 0.7 percent and 4.6 percent from a year ago. This was the seventh consecutive monthly increase and better than the 0.4 percent expected by analysts. The pace of monthly sales has been increasing with gains of 0.5 percent in August, 0.9 percent in September and 0.5 percent in October. Sales increased in other retailing (2.1 percent), cafes, restaurants & takeaway food services (2.2 percent), clothing, footwear & personal accessory retailing (1.7 percent) and household goods retailing (0.7 percent). These increases were partially offset by a decline in department stores (down 2.0 percent) and food retailing (down 0.1 percent). Turnover rose in Victoria (0.9 percent), Western Australia (1.3 percent), New South Wales (0.4 percent), Queensland (0.5 percent), South Australia (0.9 percent), the Northern Territory (1.7 percent) and Tasmania (0.5 percent). However, sales were lower in the Australian Capital Territory (down 0.2 percent).
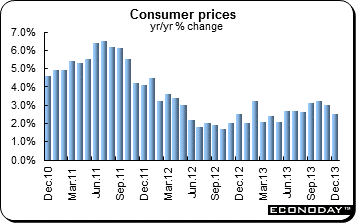 December consumer prices were up 2.5 percent from December a year ago as expected. For the month, the CPI was up 0.3 percent after slipping 0.1 percent in November. For the year 2013, the CPI was up 2.6 percent. Both the urban and rural CPIs were up 2.5 percent as well. Food prices eased to an increase of 4.1 percent on the year from 5.9 percent last time. Non-food prices were up 1.7 percent after 1.6 percent for the previous three months. Clothing prices were up 2.1 percent after increasing 2.0 percent in November. Housing prices were up 2.8 percent. However, prices for tobacco & alcohol were down 0.4 percent after declining 0.2 percent the three months before. Transportation & communication slipped 0.1 percent on the year after declining 0.5 percent in November. December consumer prices were up 2.5 percent from December a year ago as expected. For the month, the CPI was up 0.3 percent after slipping 0.1 percent in November. For the year 2013, the CPI was up 2.6 percent. Both the urban and rural CPIs were up 2.5 percent as well. Food prices eased to an increase of 4.1 percent on the year from 5.9 percent last time. Non-food prices were up 1.7 percent after 1.6 percent for the previous three months. Clothing prices were up 2.1 percent after increasing 2.0 percent in November. Housing prices were up 2.8 percent. However, prices for tobacco & alcohol were down 0.4 percent after declining 0.2 percent the three months before. Transportation & communication slipped 0.1 percent on the year after declining 0.5 percent in November.
 December producer price index declined 1.4 percent for a second month when compared with the previous year. The index was unchanged on the month for a third month. For the year, the PPI declined 1.9 percent. All subcategories declined in the month with the exception of consumer goods where prices were unchanged after increasing 0.1 percent in November. Within consumer goods, only food and related products increased – this time by 0.6 percent after 0.8 percent in November. Raw materials procurement, fuel and power declined 1.4 percent while production materials were down 1.8 percent. December producer price index declined 1.4 percent for a second month when compared with the previous year. The index was unchanged on the month for a third month. For the year, the PPI declined 1.9 percent. All subcategories declined in the month with the exception of consumer goods where prices were unchanged after increasing 0.1 percent in November. Within consumer goods, only food and related products increased – this time by 0.6 percent after 0.8 percent in November. Raw materials procurement, fuel and power declined 1.4 percent while production materials were down 1.8 percent.
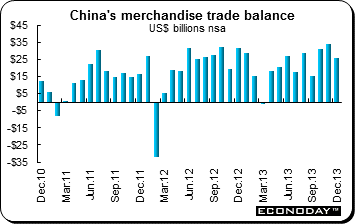 December merchandise trade surplus (unadjusted) was $25.64 billion, lower than November’s $33.8 billion. It was the lowest surplus since September when it was $15.2 billion. Exports were up 4.3 percent from a year ago after increasing 12.7 percent in November while imports jumped 8.3 percent after increasing 5.3 percent the month before. For the year 2013, the surplus was $259.8 billion, above the $241.1 billion in 2012. For the year 2013, exports were up 7.9 percent while imports gained 7.3 percent. Exports were up 2.7 percent on the month while imports advanced 8.1 percent. On a seasonally adjusted basis, imports were up 4.3 percent on the year after gaining 9.3 percent the month before. Exports were up 3.3 percent after jumping 13.2 percent in November. December merchandise trade surplus (unadjusted) was $25.64 billion, lower than November’s $33.8 billion. It was the lowest surplus since September when it was $15.2 billion. Exports were up 4.3 percent from a year ago after increasing 12.7 percent in November while imports jumped 8.3 percent after increasing 5.3 percent the month before. For the year 2013, the surplus was $259.8 billion, above the $241.1 billion in 2012. For the year 2013, exports were up 7.9 percent while imports gained 7.3 percent. Exports were up 2.7 percent on the month while imports advanced 8.1 percent. On a seasonally adjusted basis, imports were up 4.3 percent on the year after gaining 9.3 percent the month before. Exports were up 3.3 percent after jumping 13.2 percent in November.
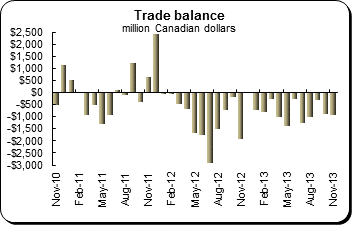 November merchandise trade deficit was C$0.94 billion following a revised deficit of C$0.91 billion in October. The essentially flat headline performance reflected no monthly change in exports and a minimal 0.1 percent increase in imports. Sales to the U.S. edged up 0.6 percent but with imports from across the border advancing 2.0 percent, the bilateral surplus narrowed from C$3.08 billion to C$2.75 billion. Within overall exports there were sharp swings among a number of component categories. Solid monthly gains in motor vehicles & parts (9.6 percent), aircraft & other transportation equipment & parts (5.6 percent) and, to a lesser extent, forestry products & building & packaging materials (2.2 percent) contrasted markedly with hefty declines in basic & industrial chemical, plastic & rubber products (7.0 percent), metal ores & non-metallic minerals (5.1 percent) and industrial machinery, equipment & parts (4.7 percent). Imports were similarly erratic at a sector level, notably energy which saw a 16.3 percent monthly plunge and basic & industrial chemical, plastic & rubber products which were off 16.2 percent. However, weakness here was offset by strong increases elsewhere — in particular in aircraft & other transportation equipment & parts (17.3 percent), metal ores & non-metallic minerals (9.1 percent) and industrial machinery, equipment & parts (8.5 percent). November merchandise trade deficit was C$0.94 billion following a revised deficit of C$0.91 billion in October. The essentially flat headline performance reflected no monthly change in exports and a minimal 0.1 percent increase in imports. Sales to the U.S. edged up 0.6 percent but with imports from across the border advancing 2.0 percent, the bilateral surplus narrowed from C$3.08 billion to C$2.75 billion. Within overall exports there were sharp swings among a number of component categories. Solid monthly gains in motor vehicles & parts (9.6 percent), aircraft & other transportation equipment & parts (5.6 percent) and, to a lesser extent, forestry products & building & packaging materials (2.2 percent) contrasted markedly with hefty declines in basic & industrial chemical, plastic & rubber products (7.0 percent), metal ores & non-metallic minerals (5.1 percent) and industrial machinery, equipment & parts (4.7 percent). Imports were similarly erratic at a sector level, notably energy which saw a 16.3 percent monthly plunge and basic & industrial chemical, plastic & rubber products which were off 16.2 percent. However, weakness here was offset by strong increases elsewhere — in particular in aircraft & other transportation equipment & parts (17.3 percent), metal ores & non-metallic minerals (9.1 percent) and industrial machinery, equipment & parts (8.5 percent).
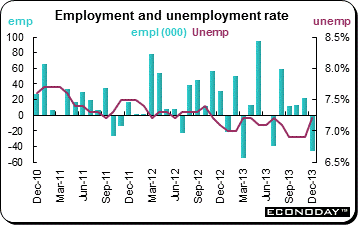 December employment dropped 45,900, its first decline since July and its steepest drop since March. Moreover, with the participation rate unchanged at 66.4 percent, the jobless rate jumped 0.3 percentage points to 7.2 percent, also its highest reading in half a year. The entire headline decline in employment was accounted for by full time positions which slumped 60,000. By contrast, part time jobs expanded 14,200. The private sector shed 26,300 positions which, with the number of self-employed shrinking 37,900, meant that the overall picture would have looked a lot grimmer but for an 18,200 increase in the public sector. December's employment decline was roughly evenly split between the goods producing sector, which saw a 23,800 drop, and services where headcount was down a marginally smaller 22,100. Within the former, manufacturing increased 7,500 and utilities were essentially flat. However, construction declined 14,100, natural resources were off 8,000 and agriculture fell 9,800. Services were undermined by sizeable declines in education (18,500), accommodation & food (16,000), business, building & other support services (13,000) and the other services category (15,000). Retail was down 4,600 and transportation & warehousing was 3,500 weaker. On the positive side, health care & social assistance was up 22,100, professional, scientific & technical services 12,100 and public administration 7,600. December employment dropped 45,900, its first decline since July and its steepest drop since March. Moreover, with the participation rate unchanged at 66.4 percent, the jobless rate jumped 0.3 percentage points to 7.2 percent, also its highest reading in half a year. The entire headline decline in employment was accounted for by full time positions which slumped 60,000. By contrast, part time jobs expanded 14,200. The private sector shed 26,300 positions which, with the number of self-employed shrinking 37,900, meant that the overall picture would have looked a lot grimmer but for an 18,200 increase in the public sector. December's employment decline was roughly evenly split between the goods producing sector, which saw a 23,800 drop, and services where headcount was down a marginally smaller 22,100. Within the former, manufacturing increased 7,500 and utilities were essentially flat. However, construction declined 14,100, natural resources were off 8,000 and agriculture fell 9,800. Services were undermined by sizeable declines in education (18,500), accommodation & food (16,000), business, building & other support services (13,000) and the other services category (15,000). Retail was down 4,600 and transportation & warehousing was 3,500 weaker. On the positive side, health care & social assistance was up 22,100, professional, scientific & technical services 12,100 and public administration 7,600.
There is an old saying that one month does not make a trend. This should be applied to the U.S. employment report that universally disappointed. Both the Bank of England and European Central Bank maintained their monetary policies. Economic data were otherwise mixed globally with China’s producer prices and merchandise trade data disappointing analysts.
Key price data from the UK, Germany, the Eurozone and the U.S. headline the week. And in the U.S., the Federal Reserve publishes its Beige Book in preparation for its January 28 and 29 FOMC meeting.
| Central Bank activities |
|
| January 15 |
United States |
Federal Reserve Beige Book |
| |
|
|
| The following indicators will be released this week... |
| Europe |
|
|
| January 13 |
Italy |
Industrial Production (November) |
| January 14 |
Eurozone |
Industrial Production (November) |
|
UK |
Consumer Price Index (December) |
|
|
Producer Price Index (December) |
| January 15 |
Eurozone |
Merchandise Trade (November) |
| January 16 |
Eurozone |
Harmonized Index of Consumer Prices (December, final) |
|
Italy |
Merchandise Trade (November) |
| January 17 |
UK |
Retail Sales (December) |
| |
|
|
| Asia/Pacific |
|
|
| January 13 |
India |
Consumer Price Index (December) |
| January 16 |
Japan |
Corporate Goods Price Index (December) |
|
|
Machinery Orders (November) |
|
|
Tertiary Index (November) |
|
Australia |
Labour Force Survey (December) |
Anne D Picker is the author of International Economic Indicators and Central Banks.
|
