|
Global investors weighed several factors last week to better judge their strategy going forward. There was the constant stream of global earnings reports which were mixed. There was a pickup in the stream of new economic data, especially in the United States where providers are still trying to catch up from the government’s partial closure for half of October. And Federal Reserve ‘tapering’ once again resurfaced after the latest FOMC meeting.
The Fed met expectations by leaving its stimulus program unchanged at its FOMC meeting, though it did surprise with its relatively upbeat assessment of the economy. This raised fears that a change in policy could come sooner than expected and weighed on sentiment. Some investors were looking for the Fed to downgrade its economic outlook after the U.S. government's partial shutdown and budget impasse earlier this month. In fact, the government shutdown was a major focus for global markets in the first half of October.
For the week, equity indexes were mixed with four of 12 declining in Asia Pacific. In Europe, two of seven retreated and in North America two of five were down. Overall gains ranged from 0.2 percent to 2.5 percent. Losses ranged from 0.1 percent to 2.4 percent. For the month of October, all but two indexes advanced.
An update on manufacturing PMIs excluding Europe
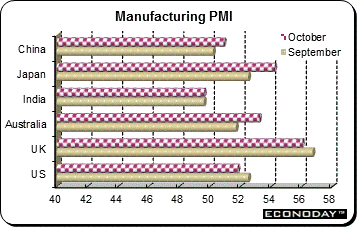 Manufacturing according to the Markit PMI surveys is growing at varying speeds in key Asian Pacific countries and the U.S. However, there is always an exception — in India the reading was 49.6 for a second successive month. It was also the third, albeit only marginal, contraction in the sector's economic activity in as many months. Manufacturing according to the Markit PMI surveys is growing at varying speeds in key Asian Pacific countries and the U.S. However, there is always an exception — in India the reading was 49.6 for a second successive month. It was also the third, albeit only marginal, contraction in the sector's economic activity in as many months.
For once in China, both the ‘official’ CFLP PMI and the Markit/HSBC indexes expanded. The October CFLP manufacturing PMI reading was 51.4, up from 51.1 in September with the gain mainly from increased production. Similarly, the Markit PMI reading was 50.9, unchanged from the flash estimate and up from the final September reading of 50.2. Though only slight, it was the strongest improvement of operating conditions in China’s manufacturing sector in seven months.
In Japan, the October manufacturing PMI jumped to a reading of 54.2 from 52.5 in September. This was the sharpest pace of improvement in over three years and was driven by a surge in new orders to a four year high. Production grew at a similar pace but employment failed to follow suit. In Australia, the Australian Industry Group Australian performance of manufacturing index improved by 1.5 points in October to 53.2. This was the second consecutive month that the index has moved above the breakeven level of 50.
Finally for comparison, the U.S. Markit PMI manufacturing survey was on the soft side, at only 51.8 which was the slowest final monthly rate in a year. However the ISM manufacturing survey showed activity expanding at a slightly faster rate in the month of October. The ISM index inched up to 56.4 from 56.2 in September. In the UK, while the PMI reading eased from 56.3 to 56, the reading indicates strong manufacturing activity in October thanks to a sharp pick up in both domestic demand and export business. Europe will release its manufacturing PMIs Monday.
Several central banks met last week other than the Federal Reserve and published their monetary policy decisions.
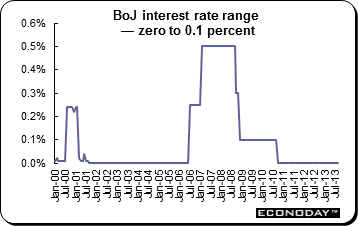 As expected, the Bank of Japan left its key interest rate range at zero to 0.1 percent. It also left its financial asset purchases program unchanged. In its latest semiannual outlook, the BoJ stuck to its bullish inflation outlook, suggesting the chance of monetary policy action in the near term is slim, even though private sector professionals think the Bank’s projections are unrealistic. The BoJ issues the outlook report each April and October, with interim reviews in January and July. As expected, the Bank of Japan left its key interest rate range at zero to 0.1 percent. It also left its financial asset purchases program unchanged. In its latest semiannual outlook, the BoJ stuck to its bullish inflation outlook, suggesting the chance of monetary policy action in the near term is slim, even though private sector professionals think the Bank’s projections are unrealistic. The BoJ issues the outlook report each April and October, with interim reviews in January and July.
The monetary policy board kept its median forecast that core consumer prices (excluding only fresh food) will rise 1.9 percent in the Japanese fiscal year beginning April 2015, unchanged from July, when the Bank held an interim review of its predictions. However, it slightly upgraded its outlook for inflation in the current fiscal year ending in March and for growth for the subsequent fiscal year. The MPB see the core CPI rising 0.7 percent in the continuing fiscal year, higher than its previous forecast for a 0.6 percent increase. For the next fiscal year, the central bank expects the index to gain 1.3 percent. The Board expects the economy will grow 2.7 percent, adjusted for price changes, in the current fiscal year, down slightly from the previous forecast of a 2.8 percent increase. But it raised its growth projection for the subsequent year to 1.5 percent from 1.3 percent and kept unchanged its forecast for fiscal 2015 for a 1.5 percent gain.
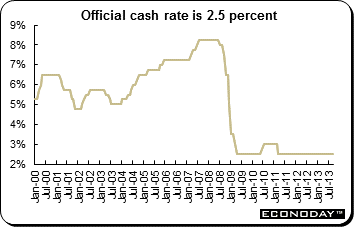 Reserve Bank of New Zealand left its key overnight cash rate (OCR) unchanged at 2.5 percent where it has been since March 2011. In his statement, Governor Graeme Wheeler said that the OCR would remain at 2.5 percent for the rest of 2013 but that increases would probably be required in 2014. He noted that the currency (NZ dollar or kiwi) remains high, hurting exporters. However, sustained exchange rate strength that leads to lower inflationary pressures would provide the RBNZ with greater flexibility as to the timing and magnitude of future increases in the OCR. He said that fiscal consolidation is also expected to continue weighing on demand over the next few years. New Zealand’s currency rose after the statement because Wheeler did not express fresh concern about the kiwi’s recent gains. Reserve Bank of New Zealand left its key overnight cash rate (OCR) unchanged at 2.5 percent where it has been since March 2011. In his statement, Governor Graeme Wheeler said that the OCR would remain at 2.5 percent for the rest of 2013 but that increases would probably be required in 2014. He noted that the currency (NZ dollar or kiwi) remains high, hurting exporters. However, sustained exchange rate strength that leads to lower inflationary pressures would provide the RBNZ with greater flexibility as to the timing and magnitude of future increases in the OCR. He said that fiscal consolidation is also expected to continue weighing on demand over the next few years. New Zealand’s currency rose after the statement because Wheeler did not express fresh concern about the kiwi’s recent gains.
New Zealand may become one of the first developed nations to begin raising borrowing costs amid expectations inflation will accelerate toward the middle of the RBNZ’s 1 percent to 3 percent inflation range target. While the kiwi’s gains make imports cheaper, rising domestic demand fanned by a housing boom adds to signs a rate rise may come as early as March. In September, the RBNZ forecast annual inflation will accelerate to 1.9 percent by late 2014. Consumer prices rose 1.4 percent in the 12 months through September, the fastest pace in 18 months.
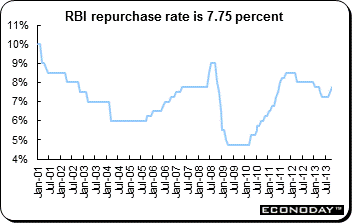 In line with expectations the Reserve Bank of India raised its key repo rate by 25 basis points to 7.75 percent — its second consecutive increase of this magnitude in as many months. At the same time, the RBI lifted its reverse repo by an equivalent amount to 6.75 percent while also cutting the marginal standing facility (MSF) rate by a further 25 basis points to 8.75 percent. The Cash Reserve Ratio (CRR) was left unchanged at 4.0 percent. Recently arrived (in September) Governor Raghuram Rajan described the move as part of broader RBI attempts to ‘normalize’ its policies following India’s recent market turbulence, and included other steps to unwind emergency measures introduced to support the plummeting rupee earlier this year. The moves reflect the Bank’s determination to anchor inflation expectations during a period of increasing price pressures while continuing to realign policy back towards a more normal interest rate structure following the emergency measures implemented to support the rupee. In line with expectations the Reserve Bank of India raised its key repo rate by 25 basis points to 7.75 percent — its second consecutive increase of this magnitude in as many months. At the same time, the RBI lifted its reverse repo by an equivalent amount to 6.75 percent while also cutting the marginal standing facility (MSF) rate by a further 25 basis points to 8.75 percent. The Cash Reserve Ratio (CRR) was left unchanged at 4.0 percent. Recently arrived (in September) Governor Raghuram Rajan described the move as part of broader RBI attempts to ‘normalize’ its policies following India’s recent market turbulence, and included other steps to unwind emergency measures introduced to support the plummeting rupee earlier this year. The moves reflect the Bank’s determination to anchor inflation expectations during a period of increasing price pressures while continuing to realign policy back towards a more normal interest rate structure following the emergency measures implemented to support the rupee.
The RBI released its latest quarterly macroeconomic review within which it noted that it expects inflation to remain elevated and close to current levels (CPI 9.84 percent, WPI 6.46 percent in September) through the remainder of the current fiscal year ending March 2014. With economic growth (4.4 percent in the June quarter) also seen accelerating modestly, the increase in the repo should come as no surprise and additional monetary tightening cannot be ruled out over months if inflation continues to accelerate.
|
|
2012 |
2013 |
% Change |
|
Index |
31-Dec |
Oct 25 |
Nov 1 |
Week |
October |
Year |
| Asia/Pacific |
|
|
|
|
|
|
|
| Australia |
All Ordinaries |
4664.6 |
5385.7 |
5406.5 |
0.4% |
3.9% |
15.9% |
| Japan |
Nikkei 225 |
10395.2 |
14088.2 |
14201.6 |
0.8% |
-0.9% |
36.6% |
| Hong Kong |
Hang Seng |
22656.9 |
22698.3 |
23249.8 |
2.4% |
1.5% |
2.6% |
| S. Korea |
Kospi |
1997.1 |
2034.4 |
2039.4 |
0.2% |
1.7% |
2.1% |
| Singapore |
STI |
3167.1 |
3205.2 |
3201.2 |
-0.1% |
1.4% |
1.1% |
| China |
Shanghai Composite |
2269.1 |
2133.0 |
2149.6 |
0.8% |
-1.5% |
-5.3% |
|
|
|
|
|
|
|
|
| India |
Sensex 30 |
19426.7 |
20683.5 |
21196.8 |
2.5% |
9.2% |
9.1% |
| Indonesia |
Jakarta Composite |
4316.7 |
4580.9 |
4432.6 |
-3.2% |
4.5% |
2.7% |
| Malaysia |
KLCI |
1689.0 |
1817.6 |
1810.4 |
-0.4% |
2.2% |
7.2% |
| Philippines |
PSEi |
5812.7 |
6539.8 |
6585.38 |
0.7% |
6.4% |
13.3% |
| Taiwan |
Taiex |
7699.5 |
8346.6 |
8388.2 |
0.5% |
3.4% |
8.9% |
| Thailand |
SET |
1391.9 |
1454.9 |
1429.1 |
-1.8% |
4.3% |
2.7% |
|
|
|
|
|
|
|
|
| Europe |
|
|
|
|
|
|
|
| UK |
FTSE 100 |
5897.8 |
6721.3 |
6734.7 |
0.2% |
4.2% |
14.2% |
| France |
CAC |
3641.1 |
4272.3 |
4273.2 |
0.0% |
3.8% |
17.4% |
| Germany |
XETRA DAX |
7612.4 |
8985.7 |
9007.8 |
0.2% |
5.1% |
18.3% |
| Italy |
FTSE MIB |
16273.4 |
18874.8 |
19164.3 |
1.5% |
11.0% |
17.8% |
| Spain |
IBEX 35 |
8167.5 |
9815.5 |
9838.3 |
0.2% |
7.9% |
20.5% |
| Sweden |
OMX Stockholm 30 |
1104.7 |
1290.6 |
1278.4 |
-0.9% |
1.9% |
15.7% |
| Switzerland |
SMI |
6822.4 |
8249.3 |
8221.8 |
-0.3% |
2.6% |
20.5% |
|
|
|
|
|
|
|
|
| North America |
|
|
|
|
|
|
|
| United States |
Dow |
13104.1 |
15570.3 |
15615.6 |
0.3% |
2.8% |
19.2% |
|
NASDAQ |
3019.5 |
3943.4 |
3922.0 |
-0.5% |
3.9% |
29.9% |
|
S&P 500 |
1426.2 |
1759.8 |
1761.6 |
0.1% |
4.5% |
23.5% |
| Canada |
S&P/TSX Comp. |
12433.5 |
13400.4 |
13337.5 |
-0.5% |
4.5% |
7.3% |
| Mexico |
Bolsa |
43705.8 |
40671.6 |
41079.6 |
1.0% |
2.1% |
-6.0% |
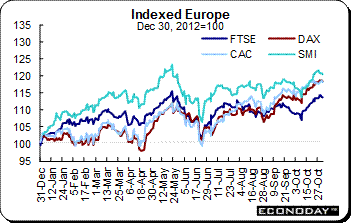 Equities here for the most part were up on the week after oscillating between gain and loss. The FTSE received an end of the week boost from its strong manufacturing PMI result. On the week, the FTSE and DAX both edged up 0.2 percent and the CAC was virtually unchanged. The OMX and SMI retreated 1.0 percent and 0.3 percent respectively. All indexes followed here gained in October. The star performer here was Italy’s MIB, which shot up 11 percent on the month. Elsewhere, the FTSE was up 4.2 percent, the CAC gained 3.8 percent, the DAX added 5.1 percent and the SMI was 2.6 percent higher. Equities here for the most part were up on the week after oscillating between gain and loss. The FTSE received an end of the week boost from its strong manufacturing PMI result. On the week, the FTSE and DAX both edged up 0.2 percent and the CAC was virtually unchanged. The OMX and SMI retreated 1.0 percent and 0.3 percent respectively. All indexes followed here gained in October. The star performer here was Italy’s MIB, which shot up 11 percent on the month. Elsewhere, the FTSE was up 4.2 percent, the CAC gained 3.8 percent, the DAX added 5.1 percent and the SMI was 2.6 percent higher.
Eurozone inflation slowed unexpectedly in October largely due to a drop in energy prices according to October’s flash harmonized index of consumer prices. Inflation was 0.7 percent on the year, down from 1.1 percent in September. The rate was expected to stay unchanged at 1.1 percent in October. The major indexes remain close to multiyear highs amid growing expectations that the Eurozone’s low rate of inflation will push the European Central Bank to cut interest rates. This sent the euro lower against the U.S. dollar.
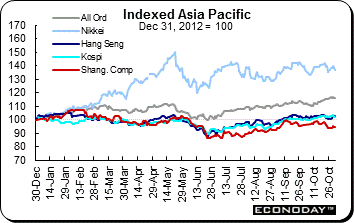 Equities were mixed last week as earnings and the U.S. data backlog vied with news from the Federal Reserve to sway investor actions. The major indexes including the All Ordinaries, Nikkei, Hang Seng, Shanghai Composite and Sensex advanced. Indexes including the Jakarta Composite, KLCI and SET retreated. Regional data were encouraging with manufacturing picking up in China, Japan and Australia. However, investors continued to ponder the possibility of Fed stimulus moves. Indeed, each data release in the U.S. is parsed for its impact on Fed decision making regarding its bond purchase program. Equities were mixed last week as earnings and the U.S. data backlog vied with news from the Federal Reserve to sway investor actions. The major indexes including the All Ordinaries, Nikkei, Hang Seng, Shanghai Composite and Sensex advanced. Indexes including the Jakarta Composite, KLCI and SET retreated. Regional data were encouraging with manufacturing picking up in China, Japan and Australia. However, investors continued to ponder the possibility of Fed stimulus moves. Indeed, each data release in the U.S. is parsed for its impact on Fed decision making regarding its bond purchase program.
All but two indexes — the Nikkei down 0.9 percent and the Shanghai Composite down 1.5 percent — advanced in October. Gains were widespread with the Sensex soaring 9.2 percent for the month. The PSEi was up 6.4 percent and the All Ordinaries added 3.9 percent.
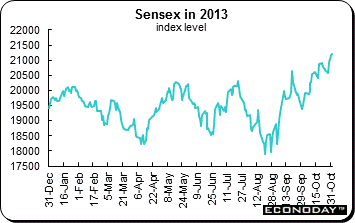 The Sensex continued to add new highs last week as banks advanced on improving asset quality and the Federal Reserve’s decision to continue with its stimulus. During the week, the index posted a healthy 2.5 percent gain, and as noted above, jumped 9.2 percent in October — its best monthly gain since February 2012. The Sensex is now up 9.1 percent in 2013. Overseas investors have remained net buyers of Indian stocks for 19 straight sessions and pumped about $2.5 billion in the local market this month. The rupee gained about 1.8 percent against the U.S. currency this month. The Sensex continued to add new highs last week as banks advanced on improving asset quality and the Federal Reserve’s decision to continue with its stimulus. During the week, the index posted a healthy 2.5 percent gain, and as noted above, jumped 9.2 percent in October — its best monthly gain since February 2012. The Sensex is now up 9.1 percent in 2013. Overseas investors have remained net buyers of Indian stocks for 19 straight sessions and pumped about $2.5 billion in the local market this month. The rupee gained about 1.8 percent against the U.S. currency this month.
Indian stocks and bonds remain vulnerable to any moves by the Federal Reserve. The Fed is widely expected to begin reining in its stimulus, although the exact timing of such a move remains unclear. Emerging markets like India have been beneficiaries of the Fed's stimulus measures, but suffered this summer when Fed jitters sparked a selloff in developing economies.
Worries about inflation in India combined with a slowdown in growth and fading investor interest in emerging markets are keeping some investors away. Wholesale inflation — the main gauge of prices in India — reached a seven month high of 6.46 percent in September, remaining above the Reserve Bank of India’s comfort level of 5.0 percent for the fourth consecutive month. Meanwhile, the country's consumer price index in recent months has been more than 9 percent higher than a year ago.
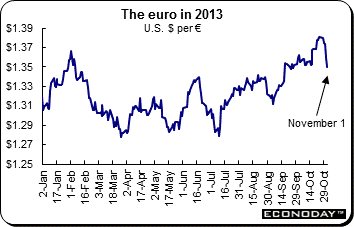 The U.S. dollar was mostly higher against its major counterparts with the exception of the Canadian dollar. The euro was down 2.3 percent on the week with most of the losses occurring since Thursday, when the Eurozone reported that inflation cooled to a four year low in October while joblessness climbed to a record high. Some now expect that the anemic Eurozone inflation reading will spur the European Central Bank to cut rates at its meeting on Thursday (November7). The U.S. dollar was mostly higher against its major counterparts with the exception of the Canadian dollar. The euro was down 2.3 percent on the week with most of the losses occurring since Thursday, when the Eurozone reported that inflation cooled to a four year low in October while joblessness climbed to a record high. Some now expect that the anemic Eurozone inflation reading will spur the European Central Bank to cut rates at its meeting on Thursday (November7).
Meanwhile, better than expected U.S. manufacturing data increased the odds of the Fed cutting its bond purchases in December according to some traders. Lower rates would make owning the euro a less attractive prospect for investors. A move by the Fed to curtail its stimulus would cause yields to rise on dollar denominated assets. The U.S. dollar gained against many currencies since the Federal Reserve offered a relatively optimistic take on the U.S. economy, despite political wrangling that led to a 16-day government shutdown in October. And the better than expected U.S. manufacturing data on Friday cemented the feeling in the markets that a scaling back of Fed stimulus as early as December could be back on the table.
Before this week, the euro had climbed more than 8 percent against the dollar since July. Investors had bought the currency as economic data showed activity picking up across Europe. But the euro's rise is making some European officials nervous. On Thursday, Austrian central bank governor Ewald Nowotny said the euro's strength has weighed on southern European exports and reduced inflation. In October, the French finance minister urged the ECB to lower interest rates in order to curb the euro's strength. Although the ECB does not directly target the euro's price, it can influence the exchange rate through looser monetary policy. A weaker euro would help boost inflation while giving a trade advantage to European exporters.
|
|
2012 |
2013 |
% Change |
|
|
Dec 31 |
Oct 25 |
Nov 1 |
Week |
2013 |
| U.S. $ per currency |
|
|
|
|
|
|
| Australia |
A$ |
1.040 |
0.959 |
0.943 |
-1.6% |
-9.3% |
| New Zealand |
NZ$ |
0.829 |
0.829 |
0.823 |
-0.6% |
-0.7% |
| Canada |
C$ |
1.007 |
0.957 |
0.959 |
0.3% |
-4.8% |
| Eurozone |
euro (€) |
1.319 |
1.381 |
1.349 |
-2.3% |
2.2% |
| UK |
pound sterling (£) |
1.623 |
1.618 |
1.592 |
-1.6% |
-1.9% |
|
|
|
|
|
|
|
| Currency per U.S. $ |
|
|
|
|
|
|
| China |
yuan |
6.231 |
6.084 |
6.099 |
-0.3% |
2.2% |
| Hong Kong |
HK$* |
7.750 |
7.754 |
7.752 |
0.0% |
0.0% |
| India |
rupee |
54.995 |
61.460 |
61.730 |
-0.4% |
-10.9% |
| Japan |
yen |
86.750 |
97.410 |
98.780 |
-1.4% |
-12.2% |
| Malaysia |
ringgit |
3.058 |
3.157 |
3.171 |
-0.4% |
-3.6% |
| Singapore |
Singapore $ |
1.222 |
1.236 |
1.243 |
-0.6% |
-1.7% |
| South Korea |
won |
1064.400 |
1062.060 |
1060.800 |
0.1% |
0.3% |
| Taiwan |
Taiwan $ |
29.033 |
29.383 |
29.435 |
-0.2% |
-1.4% |
| Thailand |
baht |
30.580 |
31.025 |
31.210 |
-0.6% |
-2.0% |
| Switzerland |
Swiss franc |
0.916 |
0.893 |
0.913 |
-2.2% |
0.3% |
| *Pegged to U.S. dollar |
|
|
|
|
|
|
| Source: Bloomberg |
|
|
|
|
|
|
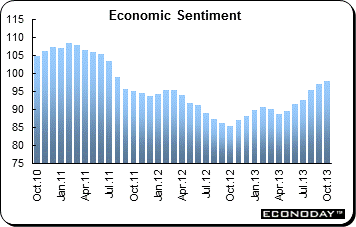 October EU Commission's economic sentiment index (ESI) was up 0.9 point from an unrevised September base to 97.8 — its highest reading since August 2011. The October advance reflected improved confidence in the consumer and, in particular, industrial sectors, with the former rising 0.4 points to minus 14.9 (as previously signaled in its flash report) and the latter increasing nearly 2 points to minus 4.8. However, sentiment deteriorated modestly in construction, retail and services. Among the larger member states the core outperformed with national ESIs in France and Germany advancing 2.6 points and 0.8 points respectively compared with declines in both Italy (2.0 points) and Spain (2.2 points). Elsewhere, Austria (5.2 points), the Netherlands (3.3 points), Malta (3.0 points) and Estonia (1.1 points) all posted respectable gains. October EU Commission's economic sentiment index (ESI) was up 0.9 point from an unrevised September base to 97.8 — its highest reading since August 2011. The October advance reflected improved confidence in the consumer and, in particular, industrial sectors, with the former rising 0.4 points to minus 14.9 (as previously signaled in its flash report) and the latter increasing nearly 2 points to minus 4.8. However, sentiment deteriorated modestly in construction, retail and services. Among the larger member states the core outperformed with national ESIs in France and Germany advancing 2.6 points and 0.8 points respectively compared with declines in both Italy (2.0 points) and Spain (2.2 points). Elsewhere, Austria (5.2 points), the Netherlands (3.3 points), Malta (3.0 points) and Estonia (1.1 points) all posted respectable gains.
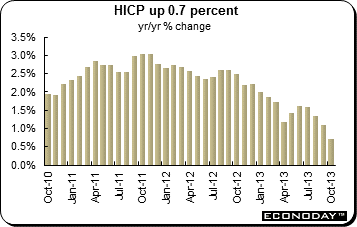 October flash harmonized index of consumer prices slowed to just 0.7 percent when compared with a year ago and fell beneath the psychologically important 1.0 percent mark for the first time since February 2010. The unusually large 0.4 percentage point drop from its September level left prices rising at their weakest annual rate since November 2009. Energy prices declined to minus 1.7 percent from minus 0.9 percent. Food, alcohol & tobacco similarly decelerated sharply (1.9 percent from 2.6 percent). However, the underlying picture was also particularly soft. Excluding food, drink, tobacco & energy the annual rate was just 0.8 percent, — 0.3 percentage points down from last time. In fact without the Italian VAT rate having been increased 1 percentage point at the start of October, the figures might have been even weaker. October flash harmonized index of consumer prices slowed to just 0.7 percent when compared with a year ago and fell beneath the psychologically important 1.0 percent mark for the first time since February 2010. The unusually large 0.4 percentage point drop from its September level left prices rising at their weakest annual rate since November 2009. Energy prices declined to minus 1.7 percent from minus 0.9 percent. Food, alcohol & tobacco similarly decelerated sharply (1.9 percent from 2.6 percent). However, the underlying picture was also particularly soft. Excluding food, drink, tobacco & energy the annual rate was just 0.8 percent, — 0.3 percentage points down from last time. In fact without the Italian VAT rate having been increased 1 percentage point at the start of October, the figures might have been even weaker.
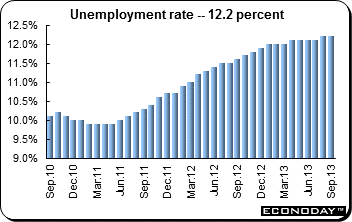 September unemployment rate was 12.2 percent — a record high for a second month. August's unemployment rate was revised 0.2 percentage points higher to 12.2 percent. The September rate was unchanged at this level despite a further 60,000 increase in joblessness to a new peak of 19.447 million. The headline data would have looked worse but for a 0.1 percentage point dip in the German rate to 5.2 percent as calculated by Eurostat. The Spanish rate held steady, albeit at 26.6 percent, but there were 0.1 percentage point gains in both France (11.1 percent) and Italy (12.5 percent). There was better news out of Portugal (16.3 percent from 16.5 percent) but Cyprus posted another 0.2 percentage point increase to 17.1 percent. Significantly youth unemployment also continued to rise and now is at an economically and politically dangerous 24.1 percent. September unemployment rate was 12.2 percent — a record high for a second month. August's unemployment rate was revised 0.2 percentage points higher to 12.2 percent. The September rate was unchanged at this level despite a further 60,000 increase in joblessness to a new peak of 19.447 million. The headline data would have looked worse but for a 0.1 percentage point dip in the German rate to 5.2 percent as calculated by Eurostat. The Spanish rate held steady, albeit at 26.6 percent, but there were 0.1 percentage point gains in both France (11.1 percent) and Italy (12.5 percent). There was better news out of Portugal (16.3 percent from 16.5 percent) but Cyprus posted another 0.2 percentage point increase to 17.1 percent. Significantly youth unemployment also continued to rise and now is at an economically and politically dangerous 24.1 percent.
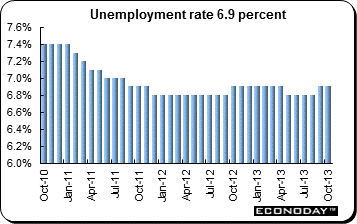
 October joblessness edged a seasonally adjusted 2,000 higher on the month. In September it climbed a much sharper, albeit downwardly revised, 24,000. The lack of any real movement in October was reflected in an unchanged unemployment rate of 6.9 percent. Despite the latest very modest increase in unemployment, vacancies rose a further 2,000 after a 3,000 gain last month and so give support to the view that the stagnation of the labour market now has as much to do with skills shortages as anything else. Recent surveys have found several instances of firms being unable to add to headcount due to a lack of availability of qualified workers. Overall employment is still just about growing, at least it was in September according to the lagging ILO data which showed an extra 2,000 jobs being filled over the period. This was the smallest monthly increase since September 2012 and warns that supply side factors could be a serious factor limiting the speed of the German economic recovery over coming quarters. October joblessness edged a seasonally adjusted 2,000 higher on the month. In September it climbed a much sharper, albeit downwardly revised, 24,000. The lack of any real movement in October was reflected in an unchanged unemployment rate of 6.9 percent. Despite the latest very modest increase in unemployment, vacancies rose a further 2,000 after a 3,000 gain last month and so give support to the view that the stagnation of the labour market now has as much to do with skills shortages as anything else. Recent surveys have found several instances of firms being unable to add to headcount due to a lack of availability of qualified workers. Overall employment is still just about growing, at least it was in September according to the lagging ILO data which showed an extra 2,000 jobs being filled over the period. This was the smallest monthly increase since September 2012 and warns that supply side factors could be a serious factor limiting the speed of the German economic recovery over coming quarters.
 September retail sales declined 0.2 percent and were up 0.2 percent on the year. Volumes were down 0.4 percent. For the third quarter as a whole, purchases declined 0.1 percent from the previous period when they also contracted 0.1 percent from the first three months of the year. As always with the retail sales data, potentially significant revisions are a possibility but as currently reported the September figures do not bode well for third quarter GDP. September retail sales declined 0.2 percent and were up 0.2 percent on the year. Volumes were down 0.4 percent. For the third quarter as a whole, purchases declined 0.1 percent from the previous period when they also contracted 0.1 percent from the first three months of the year. As always with the retail sales data, potentially significant revisions are a possibility but as currently reported the September figures do not bode well for third quarter GDP.
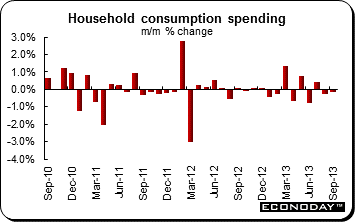 September household spending on manufactured goods slid 0.2 percent for a second month. Sales were 0.1 percent lower on the year. September's weakness was largely due to textiles which dropped 0.8 percent on the month after a 1.1 percent increase in August. Autos rebounded from the previous period's 0.4 percent decline with a 1.0 percent increase while household goods were up 0.3 percent and the other products category was unchanged. September household spending on manufactured goods slid 0.2 percent for a second month. Sales were 0.1 percent lower on the year. September's weakness was largely due to textiles which dropped 0.8 percent on the month after a 1.1 percent increase in August. Autos rebounded from the previous period's 0.4 percent decline with a 1.0 percent increase while household goods were up 0.3 percent and the other products category was unchanged.
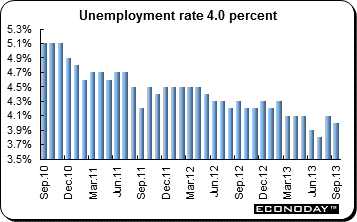 September unemployment rate slipped to 4.0 percent from 4.1 percent the previous month. The number of unemployed persons was 2.58 million, a decrease of 170,000 from the previous year. Employment increased by 510,000 to 64.59 million from a year ago. This was the ninth consecutive increase in employment. Employment increased 190,000 in September to a seasonally adjusted 63.19 million for the first increase in two months after dropping 30,000 in August. The adjusted number of unemployed declined 3.3 percent to 2.63 million for the first monthly drop in two months. September unemployment rate slipped to 4.0 percent from 4.1 percent the previous month. The number of unemployed persons was 2.58 million, a decrease of 170,000 from the previous year. Employment increased by 510,000 to 64.59 million from a year ago. This was the ninth consecutive increase in employment. Employment increased 190,000 in September to a seasonally adjusted 63.19 million for the first increase in two months after dropping 30,000 in August. The adjusted number of unemployed declined 3.3 percent to 2.63 million for the first monthly drop in two months.
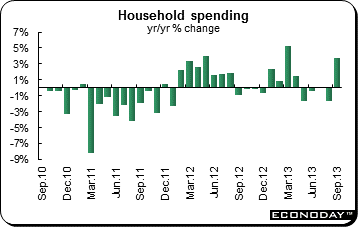 September household spending jumped 3.7 percent from a year ago after declining 1.6 percent the month before. Analysts were looking for an increase of 0.5 percent. The unexpected drop in August was caused by a temporary factor (strong car sales the year before). In September, consumers appeared to show a continued good appetite for durable goods ahead of the sales tax increase from 5 percent to 8 percent in April. But the largest positive contributions came from a sharp rise in university tuitions, higher spending on funerals and weddings as well as mobile communications. September household spending jumped 3.7 percent from a year ago after declining 1.6 percent the month before. Analysts were looking for an increase of 0.5 percent. The unexpected drop in August was caused by a temporary factor (strong car sales the year before). In September, consumers appeared to show a continued good appetite for durable goods ahead of the sales tax increase from 5 percent to 8 percent in April. But the largest positive contributions came from a sharp rise in university tuitions, higher spending on funerals and weddings as well as mobile communications.
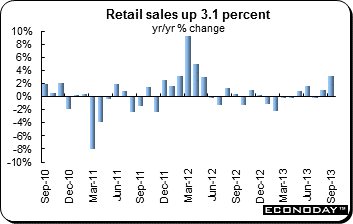 September retail sales data confirmed the increase in household spending. Retail sales were up 3.1 percent from a year ago. Fabrics, apparel & accessories were up 3.9 percent on the year after climbing 3.7 percent in August. Motor vehicle sales jumped 11 percent. They were up for the first month since April. Fuel sales were up for a fifth month, this time by 4.7 percent. However, machinery & equipment sales dropped 3.2 percent after increasing 0.4 percent in August. Food & beverage sales were 2.2 percent higher after gaining 1.6 percent. September retail sales data confirmed the increase in household spending. Retail sales were up 3.1 percent from a year ago. Fabrics, apparel & accessories were up 3.9 percent on the year after climbing 3.7 percent in August. Motor vehicle sales jumped 11 percent. They were up for the first month since April. Fuel sales were up for a fifth month, this time by 4.7 percent. However, machinery & equipment sales dropped 3.2 percent after increasing 0.4 percent in August. Food & beverage sales were 2.2 percent higher after gaining 1.6 percent.
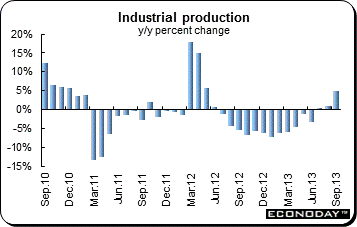 September industrial production increased a less than expected 1.5 percent on the month and was up 4.8 percent from a year ago. Output was expected to increase 1.8 percent on the month. Among the industries that contributed to higher output were transport equipment which was up 3.9 percent, electronic parts & devices which gained 4.7 percent and information & communication electronics equipment which was up 4.9 percent on the month. Commodities that mainly contributed to increased output were large and small passenger cars which were up 8.9 percent and 9.9 percent respectively and active matrix lcds (liquid crystal devices) middle and small which were up 22.9. METI forecasts that production will increase 4.7 percent in October but slide 1.2 percent in November. Expectations are that the main contributors to the October increase will be general purpose, production & business oriented machinery, information & communication electronics equipment and electrical machinery. The industries expected to decline in November are general purpose, production & business oriented machinery, electrical machinery and information & communication electronics equipment. September industrial production increased a less than expected 1.5 percent on the month and was up 4.8 percent from a year ago. Output was expected to increase 1.8 percent on the month. Among the industries that contributed to higher output were transport equipment which was up 3.9 percent, electronic parts & devices which gained 4.7 percent and information & communication electronics equipment which was up 4.9 percent on the month. Commodities that mainly contributed to increased output were large and small passenger cars which were up 8.9 percent and 9.9 percent respectively and active matrix lcds (liquid crystal devices) middle and small which were up 22.9. METI forecasts that production will increase 4.7 percent in October but slide 1.2 percent in November. Expectations are that the main contributors to the October increase will be general purpose, production & business oriented machinery, information & communication electronics equipment and electrical machinery. The industries expected to decline in November are general purpose, production & business oriented machinery, electrical machinery and information & communication electronics equipment.
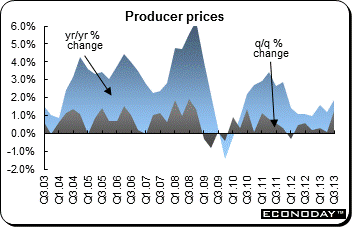 Third quarter producer price index for final demand (excluding exports) was up 1.3 percent on the quarter and 1.9 percent from the same quarter a year ago. The increase was mainly due to rises in the prices received for electricity supply, gas supply & water supply and sewerage & drainage services (up 4.8 percent), petroleum refining & petroleum fuel manufacturing (up 10.0 percent) and electronic equipment manufacturing (up 4.8 percent). These increases were partly offset by declines in the prices received for other agriculture (down 3.4 percent).Intermediate prices were up 1.7 percent and 2.4 percent on the year while preliminary demand prices were up 2.0 percent on the quarter and 2.5 percent from a year ago. Third quarter producer price index for final demand (excluding exports) was up 1.3 percent on the quarter and 1.9 percent from the same quarter a year ago. The increase was mainly due to rises in the prices received for electricity supply, gas supply & water supply and sewerage & drainage services (up 4.8 percent), petroleum refining & petroleum fuel manufacturing (up 10.0 percent) and electronic equipment manufacturing (up 4.8 percent). These increases were partly offset by declines in the prices received for other agriculture (down 3.4 percent).Intermediate prices were up 1.7 percent and 2.4 percent on the year while preliminary demand prices were up 2.0 percent on the quarter and 2.5 percent from a year ago.
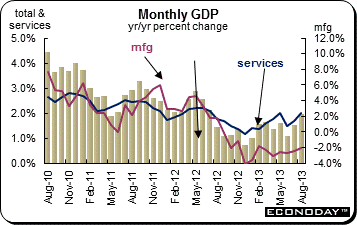 August monthly gross domestic product was up 0.3 percent and was 2.0 percent higher from a year ago. The monthly increase in total output was spread almost evenly between the goods producing and service sectors with the former advancing 0.4 percent and the latter with a 0.3 percent gain. However, within the goods producing sector, manufacturing declined 0.3 percent and utilities were off 0.2 percent. The setbacks here were more than offset by a 1.9 percent jump in mining, quarrying and oil & gas extraction and a 0.8 percent increase in agriculture, forestry, fishing & hunting. Construction was flat. Services were propelled by broad-based increases among the subsectors, led by accommodation & food (1.3 percent), management of companies & enterprises (0.7 percent) and arts, entertainment & recreation (0.6 percent). Wholesale trade grew 0.4 percent and retail was up 0.3 percent, in line with real estate, rental & leasing and professional, scientific & technical services. Only finance & insurance retreated. August monthly gross domestic product was up 0.3 percent and was 2.0 percent higher from a year ago. The monthly increase in total output was spread almost evenly between the goods producing and service sectors with the former advancing 0.4 percent and the latter with a 0.3 percent gain. However, within the goods producing sector, manufacturing declined 0.3 percent and utilities were off 0.2 percent. The setbacks here were more than offset by a 1.9 percent jump in mining, quarrying and oil & gas extraction and a 0.8 percent increase in agriculture, forestry, fishing & hunting. Construction was flat. Services were propelled by broad-based increases among the subsectors, led by accommodation & food (1.3 percent), management of companies & enterprises (0.7 percent) and arts, entertainment & recreation (0.6 percent). Wholesale trade grew 0.4 percent and retail was up 0.3 percent, in line with real estate, rental & leasing and professional, scientific & technical services. Only finance & insurance retreated.
Most equity indexes were up both on the week and month. Economic data were mixed. Traders continue to parse each U.S. data release as a vote either yea or nay on whether the Fed will begin curtailing its stimulus. While the Fed, Bank of Japan and the Reserve Bank of New Zealand kept their monetary policies unchanged, the Reserve Bank of India increased interest rates in its fight against inflation.
The Reserve Bank of Australia, Bank of England and the European Central Bank meet this coming week. Investors will particularly eye the meeting results and post meeting press conference of the ECB given the shockingly low flash inflation reading of 0.7 percent on the year. Europe will release a slew of purchasing managers surveys and in the U.S. the October employment situation will be the climax of the week on Friday.
| Central Bank activities |
|
| November 5 |
Australia |
Reserve Bank of Australia Monetary Policy Announcement |
| November 6,7 |
UK |
Bank of England Monetary Policy Meeting |
| November 7 |
Eurozone |
European Central Bank Monetary Policy Meeting |
| |
|
|
| The following indicators will be released this week... |
| Europe |
|
|
| November 4 |
Eurozone |
Manufacturing PMI (October) |
|
Germany |
Manufacturing PMI (October) |
|
France |
Manufacturing PMI (October) |
|
Italy |
Manufacturing PMI (October) |
| November 5 |
Eurozone |
Producer Price Index (September) |
|
UK |
Services PMI (October) |
| November 6 |
Eurozone |
Services & Composite PMI (October) |
|
|
Retail Sales (September) |
|
Germany |
Services & Composite PMI (October) |
|
|
Manufacturing Orders (September) |
|
France |
Services & Composite PMI (October) |
|
Italy |
Services & Composite PMI (October) |
|
UK |
Industrial Production (September) |
| November 7 |
Germany |
Industrial Production (September) |
| November 8 |
Germany |
Merchandise Trade (September) |
|
France |
Merchandise Trade (September) |
|
UK |
Merchandise Trade (September) |
| |
|
|
| Asia/Pacific |
|
|
| November 4 |
Australia |
Retail Sales (October) |
| November 6 |
Australia |
Merchandise Trade (September) |
| November 7 |
Australia |
Labour Force Survey (October) |
| November 8 |
China |
Merchandise Trade (October) |
| |
|
|
| Americas |
|
|
| November 5 |
Canada |
International Trade Balance (September) |
| November 8 |
Canada |
Labour Force Survey (October) |
Anne D Picker is the author of International Economic Indicators and Central Banks.
|
