|
Equities were mixed last week as investors returned to monitoring economic data and earnings reports. In the U.S., many data reports were postponed because of the U.S. government shutdown. There was no question that consumer sentiment was soured by the government closure. But elsewhere data, including the flash PMIs below, were mixed.
On the week, etc
Flash PMIs indicate tepid growth
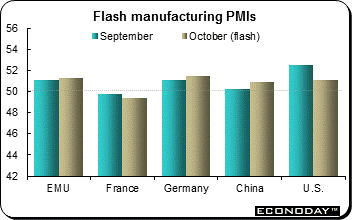 Flash October manufacturing purchasing managers’ indexes were published for China, the Eurozone, Germany, France and the U.S. Flash services and composites (which combine manufacturing with services) were released for the Eurozone, Germany and France as well. While the manufacturing indexes (except France) indicated growth, the pace was tepid at best. In China, the manufacturing PMI reading was 50.9, not much above 50 but still a seven month high and up from the September final of 50.2. The U.S. index reading was 51.1, down from September’s 52.8. The downdraft in the U.S. was mainly caused by a weakening in new orders. Flash October manufacturing purchasing managers’ indexes were published for China, the Eurozone, Germany, France and the U.S. Flash services and composites (which combine manufacturing with services) were released for the Eurozone, Germany and France as well. While the manufacturing indexes (except France) indicated growth, the pace was tepid at best. In China, the manufacturing PMI reading was 50.9, not much above 50 but still a seven month high and up from the September final of 50.2. The U.S. index reading was 51.1, down from September’s 52.8. The downdraft in the U.S. was mainly caused by a weakening in new orders.
In the Eurozone, the private sector expanded for the fourth month in a row according to the flash PMI surveys. However, the flash composite output index of 51.5 was down 0.7 points from its final September level and suggests that growth was disappointingly sluggish at the start of the fourth quarter. The main area of weakness was services which posted a flash PMI of 50.9, 1.3 points short of its final September level. Slower growth of output and new orders and a drop in backlogs were the main factors here. Manufacturing performed a little better with its PMI registering a 0.2 point increase to 51.3. However, overall employment contracted for the 22nd consecutive month and at a slightly faster pace than in September.
|
|
2012 |
2013 |
% Change |
|
Index |
31-Dec |
Oct 18 |
Oct 25 |
Week |
Year |
| Asia/Pacific |
|
|
|
|
|
|
| Australia |
All Ordinaries |
4664.6 |
5321.0 |
5385.7 |
1.2% |
15.5% |
| Japan |
Nikkei 225 |
10395.2 |
14561.5 |
14088.2 |
-3.3% |
35.5% |
| Hong Kong |
Hang Seng |
22656.9 |
23340.1 |
22698.3 |
-2.7% |
0.2% |
| S. Korea |
Kospi |
1997.1 |
2052.4 |
2034.4 |
-0.9% |
1.9% |
| Singapore |
STI |
3167.1 |
3192.9 |
3205.2 |
0.4% |
1.2% |
| China |
Shanghai Composite |
2269.1 |
2193.8 |
2133.0 |
-2.8% |
-6.0% |
|
|
|
|
|
|
|
| India |
Sensex 30 |
19426.7 |
20882.9 |
20683.5 |
-1.0% |
6.5% |
| Indonesia |
Jakarta Composite |
4316.7 |
4546.6 |
4580.9 |
0.8% |
6.1% |
| Malaysia |
KLCI |
1689.0 |
1799.6 |
1817.6 |
1.0% |
7.6% |
| Philippines |
PSEi |
5812.7 |
6607.8 |
6539.8 |
-1.0% |
12.5% |
| Taiwan |
Taiex |
7699.5 |
8441.2 |
8346.6 |
-1.1% |
8.4% |
| Thailand |
SET |
1391.9 |
1484.7 |
1454.9 |
-2.0% |
4.5% |
|
|
|
|
|
|
|
| Europe |
|
|
|
|
|
|
| UK |
FTSE 100 |
5897.8 |
6622.6 |
6721.3 |
1.5% |
14.0% |
| France |
CAC |
3641.1 |
4286.0 |
4272.3 |
-0.3% |
17.3% |
| Germany |
XETRA DAX |
7612.4 |
8865.1 |
8985.7 |
1.4% |
18.0% |
| Italy |
FTSE MIB |
16273.4 |
19271.0 |
18874.8 |
-2.1% |
16.0% |
| Spain |
IBEX 35 |
8167.5 |
10001.8 |
9815.5 |
-1.9% |
20.2% |
| Sweden |
OMX Stockholm 30 |
1104.7 |
1283.9 |
1290.6 |
0.5% |
16.8% |
| Switzerland |
SMI |
6822.4 |
8084.7 |
8249.3 |
2.0% |
20.9% |
|
|
|
|
|
|
|
| North America |
|
|
|
|
|
|
| United States |
Dow |
13104.1 |
15399.7 |
15570.3 |
1.1% |
18.8% |
|
NASDAQ |
3019.5 |
3914.3 |
3943.4 |
0.7% |
30.6% |
|
S&P 500 |
1426.2 |
1744.5 |
1759.8 |
0.9% |
23.4% |
| Canada |
S&P/TSX Comp. |
12433.5 |
13136.0 |
13400.4 |
2.0% |
7.8% |
| Mexico |
Bolsa |
43705.8 |
40412.7 |
40671.6 |
0.6% |
-6.9% |
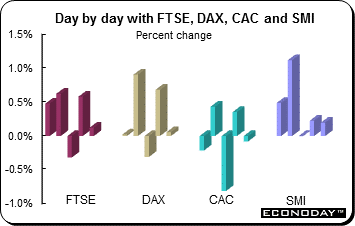 Equities were mixed last week, reflecting uneven economic data and earnings results. The FTSE gained 1.5 percent, the DAX was up 1.4 percent and the SMI was 2.0 percent higher. The CAC slipped 0.3 percent while the MIB and IBEX lost 2.1 percent and 1.9 percent respectively. Equities were mixed last week, reflecting uneven economic data and earnings results. The FTSE gained 1.5 percent, the DAX was up 1.4 percent and the SMI was 2.0 percent higher. The CAC slipped 0.3 percent while the MIB and IBEX lost 2.1 percent and 1.9 percent respectively.
Apparently meeting expectations is no longer sufficient — investors now look for economic results that beat forecasts. Therefore good UK growth was met with a ho-hum from investors. The preliminary third quarter GDP was up 0.8 percent on the quarter — the best since the second quarter of 2010 — and up 1.5 percent from a year ago. In Europe, investor sentiment was negatively affected by the unexpected dip in German business confidence Friday after being buoyed by China’s PMI the day before. And some weaker than expected corporate financial results contributed to the negative mood as well.
The Bank of England unveiled plans to expand the liquidity facilities for banks at lower cost so as to widen the scope of the financial system, Bank of England governor Mark Carney said late Thursday. The BoE will accept wide range of assets as collateral and provide funds for longer term. Further, such facilities will be cheaper, he said. In the same speech, the governor said that the unemployment rate is not the only economic indicator determining policy. Mr Carney said that the bank's Monetary Policy Committee looks at indicators including the average number of hours worked, the proportion of people in part time work and the number of long term unemployed. In August, the MPC said that it would not consider changing monetary policy until the UK's unemployment rate fell to 7 percent. The ILO measure of unemployment currently stands at 7.7 percent.
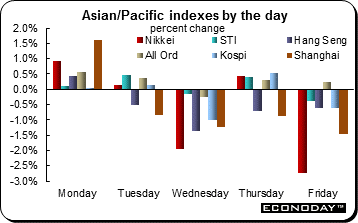 Equities were mostly lower last week with the major indexes taking the brunt of the selling. Friday’s selloff (except in Australia) was the result of some disappointing earnings news and concerns over a repeat of June's credit crunch in China. Other factors weighed too. The 16-day government shutdown in the U.S. and slowing manufacturing activity gave investors an excuse to stay on the sidelines and wait for the outcome of the Federal Reserve’s policy announcement on Wednesday. Equities were mostly lower last week with the major indexes taking the brunt of the selling. Friday’s selloff (except in Australia) was the result of some disappointing earnings news and concerns over a repeat of June's credit crunch in China. Other factors weighed too. The 16-day government shutdown in the U.S. and slowing manufacturing activity gave investors an excuse to stay on the sidelines and wait for the outcome of the Federal Reserve’s policy announcement on Wednesday.
The Nikkei, Hang Seng and Shanghai Composite retreated 3.3 percent, 2.7 percent and 2.8 percent respectively. The Nikkei continues to fluctuate with the value of the yen amid expectations that the Federal Reserve will maintain its stimulus policies until early next year. Concerns are growing about the impact of the government shutdown on the U.S. economic recovery, leading many economists to expect the Fed will continue with its current monetary stimulus policy.
The People’s Bank of China launched a new benchmark lending rate — the loan prime rate — as part of efforts to liberalize the country's interest rate regime. The new prime rate would be the benchmark for commercial banks to set interest rate while extending loans to their best customers. Nevertheless, the Shanghai Composite declined in volatile trading on concerns the economy may grow at a slightly slower pace in the fourth quarter amid a further increase in money market rates. Reports said regulators are weighing moves to tighten liquidity in a bid to curb rising housing prices and inflation.
Bank of Japan updates its economic outlook
The Bank of Japan said in its quarterly Regional Economic Report that the improvement in Japan's economic activity is gradually spilling over into regional growth. The BoJ said on Monday that all nine regions in Japan have upgraded their economic views from three months ago, thanks to continued solid domestic demand as seen in gradual increases in production, job offers and cash earnings. It is the first time since April that all the regions have upgraded their assessments. Eight regions noted that the economy had been recovering or recovering moderately while the remaining one region (Hokuriku on the Japan Sea Coast in central Japan) said the economy had been picking up steadily.
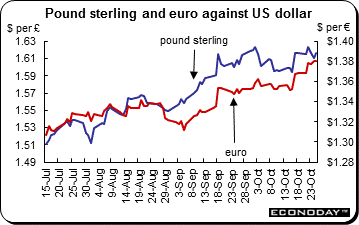 The U.S. dollar retreated against the yen, euro, pound and the Swiss franc but advanced against the commodity currencies — the Australian and Canadian dollars. Mixed economic data and earnings plus the likelihood that the Federal Reserve will delay curtailing its stimulus had a negative impact on the currency. But the combination of weaker economic data along with the negative effect of the government shutdown on growth provided reasons why the FOMC probably will leave its monetary policy unchanged when it meets mid-week. The U.S. dollar retreated against the yen, euro, pound and the Swiss franc but advanced against the commodity currencies — the Australian and Canadian dollars. Mixed economic data and earnings plus the likelihood that the Federal Reserve will delay curtailing its stimulus had a negative impact on the currency. But the combination of weaker economic data along with the negative effect of the government shutdown on growth provided reasons why the FOMC probably will leave its monetary policy unchanged when it meets mid-week.
On Tuesday, the dollar dropped to its weakest level in almost two years against the euro after lower than forecast U.S. employment gains added to speculation the Federal Reserve will delay slowing the pace of stimulus. The Swiss franc touched its strongest level against the U.S. currency since February 2012. The employment report indicated the U.S. economy had little momentum leading up to the 16-day partial shutdown of the federal government earlier this month. The Fed unexpectedly refrained in September from slowing its monthly bond purchases of $85 billion, saying it wanted more evidence of an economic recovery.
Despite signs that Europe is only slowly recovering from its slump, the euro has strengthened against the currencies of its major counterparts including, not only the U.S., but also Japan. On Friday, an unexpected drop in German business sentiment and data showing weak Eurozone bank lending illustrated just how fragile Europe's economy remains.
|
|
2012 |
2013 |
% Change |
|
|
Dec 31 |
Oct 18 |
Oct 25 |
Week |
2013 |
| U.S. $ per currency |
|
|
|
|
|
|
| Australia |
A$ |
1.040 |
0.967 |
0.959 |
-0.9% |
-7.8% |
| New Zealand |
NZ$ |
0.829 |
0.849 |
0.829 |
-2.4% |
0.0% |
| Canada |
C$ |
1.007 |
0.971 |
0.957 |
-1.5% |
-5.0% |
| Eurozone |
euro (€) |
1.319 |
1.368 |
1.381 |
0.9% |
4.7% |
| UK |
pound sterling (£) |
1.623 |
1.617 |
1.618 |
0.1% |
-0.3% |
|
|
|
|
|
|
|
| Currency per U.S. $ |
|
|
|
|
|
|
| China |
yuan |
6.231 |
6.096 |
6.084 |
0.2% |
2.4% |
| Hong Kong |
HK$* |
7.750 |
7.753 |
7.754 |
0.0% |
0.0% |
| India |
rupee |
54.995 |
61.265 |
61.460 |
-0.3% |
-10.5% |
| Japan |
yen |
86.750 |
97.860 |
97.410 |
0.5% |
-10.9% |
| Malaysia |
ringgit |
3.058 |
3.156 |
3.157 |
0.0% |
-3.1% |
| Singapore |
Singapore $ |
1.222 |
1.239 |
1.236 |
0.3% |
-1.1% |
| South Korea |
won |
1064.400 |
1060.840 |
1062.060 |
-0.1% |
0.2% |
| Taiwan |
Taiwan $ |
29.033 |
29.417 |
29.383 |
0.1% |
-1.2% |
| Thailand |
baht |
30.580 |
31.060 |
31.025 |
0.1% |
-1.4% |
| Switzerland |
Swiss franc |
0.916 |
0.902 |
0.893 |
1.1% |
2.6% |
| *Pegged to U.S. dollar |
|
|
|
|
|
|
| Source: Bloomberg |
|
|
|
|
|
|
 September M3 money supply growth from a year ago was down 0.2 percentage points from its August pace to 2.1 percent and its slowest rate since January 2012. The drop put the 3-month moving average measure followed closely by the ECB at 2.2 percent, down from 2.3 percent last time. However, private sector bank lending strengthened, albeit only marginally, with a 12-month contraction of 1.9 percent following a 2.0 percent drop in mid-quarter. Loans to households were 0.1 percent firmer on the year, a tick stronger than last time, and within this borrowing for house purchase also gained 0.1 percentage points to a 0.8 percent annual rate. Lending to non-financial corporations posted a drop of 3.5 percent in the annual growth rate and the volatile non-monetary financial intermediaries category (excluding pension funds and insurance corporations) returned contracted 6.6 percent rate after a 6.0 percent decline previously. September M3 money supply growth from a year ago was down 0.2 percentage points from its August pace to 2.1 percent and its slowest rate since January 2012. The drop put the 3-month moving average measure followed closely by the ECB at 2.2 percent, down from 2.3 percent last time. However, private sector bank lending strengthened, albeit only marginally, with a 12-month contraction of 1.9 percent following a 2.0 percent drop in mid-quarter. Loans to households were 0.1 percent firmer on the year, a tick stronger than last time, and within this borrowing for house purchase also gained 0.1 percentage points to a 0.8 percent annual rate. Lending to non-financial corporations posted a drop of 3.5 percent in the annual growth rate and the volatile non-monetary financial intermediaries category (excluding pension funds and insurance corporations) returned contracted 6.6 percent rate after a 6.0 percent decline previously.
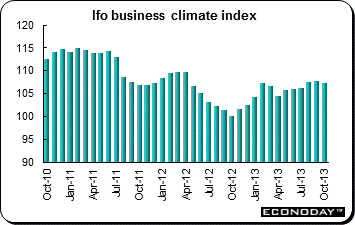 October Ifo headline business sentiment index slipped 0.3 points to 107.4, its third highest reading of the year. October's slide ended a 5-month run of consecutive gains. The decline was almost wholly attributable to weaker expectations which were off 0.6 points at 103.6, their first decline since July. Current conditions eased just 0.1 point to 111.3 and so remained below their recent August peak (112.0). Most sectors were a little more cautious about economic conditions this month. Morale in manufacturing dropped 1 point to 10.9 and declined 3.1 points to 3.3 in retail. Construction was down only a tick at minus 6.4 and services were 3.5 points weaker at 15.5. The only major category to see a rise in sentiment was wholesale, up 2.4 points at 7.7. October Ifo headline business sentiment index slipped 0.3 points to 107.4, its third highest reading of the year. October's slide ended a 5-month run of consecutive gains. The decline was almost wholly attributable to weaker expectations which were off 0.6 points at 103.6, their first decline since July. Current conditions eased just 0.1 point to 111.3 and so remained below their recent August peak (112.0). Most sectors were a little more cautious about economic conditions this month. Morale in manufacturing dropped 1 point to 10.9 and declined 3.1 points to 3.3 in retail. Construction was down only a tick at minus 6.4 and services were 3.5 points weaker at 15.5. The only major category to see a rise in sentiment was wholesale, up 2.4 points at 7.7.
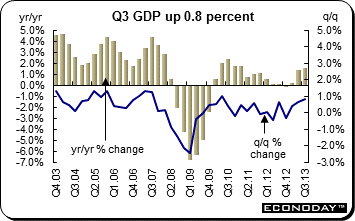 Third quarter gross domestic product was up 0.8 percent on the quarter and up 1.5 percent from the same quarter a year ago — its best performance since the first quarter of 2011. The third consecutive quarterly advance in real GDP was the strongest since the second quarter of 2010 and reflected decent gains in output in services (0.7 percent) and industrial production (0.5 percent) and a particularly robust increase in construction (2.5 percent). Agriculture (1.4 percent) also enjoyed a good quarter. Within the increase in total industrial production manufacturing climbed a solid 0.9 percent (but was still only 0.1 percent firmer on the year). Among the more erratic sub-sectors, electricity, gas and steam output contracted 6.8 percent but water supply grew 3.8 percent. Service sector growth was dominated by a 1.3 percent quarterly jump in distribution, hotels & catering and a 1.0 percent advance in business & financial services which together added 0.5 percentage points to the change in overall GDP. Transport, storage & communication grew 0.2 percent and government expanded 0.3 percent. Third quarter gross domestic product was up 0.8 percent on the quarter and up 1.5 percent from the same quarter a year ago — its best performance since the first quarter of 2011. The third consecutive quarterly advance in real GDP was the strongest since the second quarter of 2010 and reflected decent gains in output in services (0.7 percent) and industrial production (0.5 percent) and a particularly robust increase in construction (2.5 percent). Agriculture (1.4 percent) also enjoyed a good quarter. Within the increase in total industrial production manufacturing climbed a solid 0.9 percent (but was still only 0.1 percent firmer on the year). Among the more erratic sub-sectors, electricity, gas and steam output contracted 6.8 percent but water supply grew 3.8 percent. Service sector growth was dominated by a 1.3 percent quarterly jump in distribution, hotels & catering and a 1.0 percent advance in business & financial services which together added 0.5 percentage points to the change in overall GDP. Transport, storage & communication grew 0.2 percent and government expanded 0.3 percent.
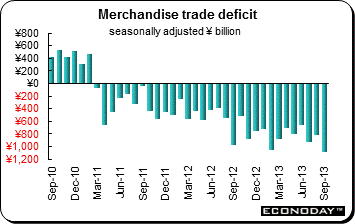 September merchandise trade deficit (unadjusted) was ¥932.1 billion. Analysts were expecting a deficit of ¥927.0 billion. Exports were up for a seventh straight increase from the previous year. Exports were up 11.5 percent, somewhat lower than expectations for a 15.6 percent increase. Imports were up 16.5 percent from a year ago. Imports also were below expectations for a 20.3 percent increase. Imports were up for an 11th straight month. The weak yen combined with the need for greater quantities of fuel from foreign sources continue to elevate imports while tepid growth globally continues to weigh on exports. Exports to the U.S. jumped 18.8 percent on the year for a ninth consecutive increase. Exports to Asia were up 8.2 percent for the seventh straight increase while those to China were up 11.4 percent for a sixth consecutive increase. Exports to the EU were up 14.3 percent for a fourth consecutive increase. On a seasonally adjusted basis, the merchandise trade deficit was ¥1091.3 billion after recording a deficit of ¥820.8 billion in August. Exports edged down 0.3 percent on the month but were up 13.5 percent on the year. Imports were up 3.8 percent and 13.2 percent on the year. September merchandise trade deficit (unadjusted) was ¥932.1 billion. Analysts were expecting a deficit of ¥927.0 billion. Exports were up for a seventh straight increase from the previous year. Exports were up 11.5 percent, somewhat lower than expectations for a 15.6 percent increase. Imports were up 16.5 percent from a year ago. Imports also were below expectations for a 20.3 percent increase. Imports were up for an 11th straight month. The weak yen combined with the need for greater quantities of fuel from foreign sources continue to elevate imports while tepid growth globally continues to weigh on exports. Exports to the U.S. jumped 18.8 percent on the year for a ninth consecutive increase. Exports to Asia were up 8.2 percent for the seventh straight increase while those to China were up 11.4 percent for a sixth consecutive increase. Exports to the EU were up 14.3 percent for a fourth consecutive increase. On a seasonally adjusted basis, the merchandise trade deficit was ¥1091.3 billion after recording a deficit of ¥820.8 billion in August. Exports edged down 0.3 percent on the month but were up 13.5 percent on the year. Imports were up 3.8 percent and 13.2 percent on the year.
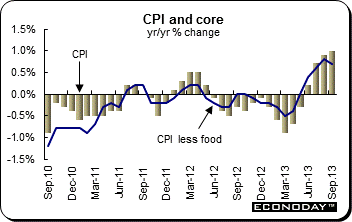 September consumer prices were up 0.3 percent on the month and 1.1 percent from a year ago. Excluding just fresh food, the CPI was up 0.1 percent and 0.7 percent on the year as expected. Excluding food and energy the index was unchanged both on the month and year. Goods prices were up 1.2 percent and 2.1 percent on the year while services were down 0.5 percent on the month and edged up 0.1 percent from a year ago. Energy costs jumped 7.4 percent from a year ago, down from August’s 9.2 percent increase. TV prices plunged 3.7 percent on the year after sinking 2.0 percent the month before. Food prices were up 1.7 percent. September consumer prices were up 0.3 percent on the month and 1.1 percent from a year ago. Excluding just fresh food, the CPI was up 0.1 percent and 0.7 percent on the year as expected. Excluding food and energy the index was unchanged both on the month and year. Goods prices were up 1.2 percent and 2.1 percent on the year while services were down 0.5 percent on the month and edged up 0.1 percent from a year ago. Energy costs jumped 7.4 percent from a year ago, down from August’s 9.2 percent increase. TV prices plunged 3.7 percent on the year after sinking 2.0 percent the month before. Food prices were up 1.7 percent.
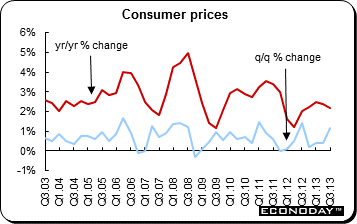 The consumer price index was up 1.2 percent in the September quarter after increasing 0.4 percent in the June quarter. On the year, the CPI was up 2.2 percent after increasing 2.4 percent in the June quarter. Prices increased for a wide range of products. The most significant price increases in the September quarter were for automotive fuel (7.6 percent), international holiday travel & accommodation (6.1 percent), electricity (4.4 percent), property rates & charges (7.9 percent), water & sewerage (9.9 percent) and domestic holiday travel & accommodation (3.5 percent).The most significant offsetting price decline was for vegetables (down 4.5 percent). The Reserve Bank of Australia has an inflation target range of 2 percent to 3 percent. The Bank’s analytical measures are the trimmed mean and weighted mean. The annual increase for both was 2.3 percent. The increase for the weighted eased from 2.5 percent in the second quarter while the trimmed mean was virtually the same in both quarters. The consumer price index was up 1.2 percent in the September quarter after increasing 0.4 percent in the June quarter. On the year, the CPI was up 2.2 percent after increasing 2.4 percent in the June quarter. Prices increased for a wide range of products. The most significant price increases in the September quarter were for automotive fuel (7.6 percent), international holiday travel & accommodation (6.1 percent), electricity (4.4 percent), property rates & charges (7.9 percent), water & sewerage (9.9 percent) and domestic holiday travel & accommodation (3.5 percent).The most significant offsetting price decline was for vegetables (down 4.5 percent). The Reserve Bank of Australia has an inflation target range of 2 percent to 3 percent. The Bank’s analytical measures are the trimmed mean and weighted mean. The annual increase for both was 2.3 percent. The increase for the weighted eased from 2.5 percent in the second quarter while the trimmed mean was virtually the same in both quarters.
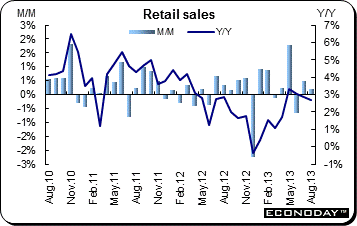 August retail sales were up 0.2 percent and 2.7 percent from a year ago. Volumes matched the nominal monthly increase and were 2.2 percent higher on the year. Nominal monthly increases were reported in six of the 11 subsectors and were led by a 1.2 percent advance in food & beverages. Clothing & accessories (1.9 percent) also had a good period as did sporting goods & hobbies (2.1 percent) and building materials & garden equipment (1.1 percent). However, motor vehicles & parts declined 0.5 percent, although this only subtracted 0.1 percentage point off the monthly change in overall purchases, while gasoline was down 0.8 percent, partly due to lower pump prices. Otherwise the main area of weakness was electronic & appliances stores (down 1.5 percent) which posted its fourth consecutive contraction. August retail sales were up 0.2 percent and 2.7 percent from a year ago. Volumes matched the nominal monthly increase and were 2.2 percent higher on the year. Nominal monthly increases were reported in six of the 11 subsectors and were led by a 1.2 percent advance in food & beverages. Clothing & accessories (1.9 percent) also had a good period as did sporting goods & hobbies (2.1 percent) and building materials & garden equipment (1.1 percent). However, motor vehicles & parts declined 0.5 percent, although this only subtracted 0.1 percentage point off the monthly change in overall purchases, while gasoline was down 0.8 percent, partly due to lower pump prices. Otherwise the main area of weakness was electronic & appliances stores (down 1.5 percent) which posted its fourth consecutive contraction.
Equity markets reverted back to gauging economic activity and earnings results now that the U.S. fiscal crisis has been resolved for a few months. During the week, U.S. government statistical agencies along with several private data providers reconfigured their release schedules going forward in order to catch up with the backlog of unreleased data. The changes extend well into November.
The FOMC is not the only central bank meeting scheduled in the upcoming week. The Bank of Japan and the Reserve Bank of India also meet. However, the Fed will garner the spotlight. The FOMC meet on October 29 and October 30. They will evaluate the strength of the recovery with a less complete set of data than usual due to the 16-day partial government shutdown that caused the suspension of reports and collection of data.
| Central Bank activities |
|
| October 29 |
India |
Reserve Bank of India Monetary Policy Meeting |
| October 29,30 |
United States |
FOMC Meeting |
| October 31 |
Japan |
Bank of Japan Monetary Policy Meeting |
| |
|
|
| The following indicators will be released this week... |
| Europe |
|
|
| October 30 |
Eurozone |
EC Business and Consumer Confidence (October) |
|
Germany |
Unemployment (October) |
| October 31 |
Eurozone |
Harmonized Index of Consumer Prices (October, flash) |
|
|
Unemployment (September) |
|
France |
Consumption of Manufactured Goods (September) |
|
|
Producer Price Index (September) |
|
Italy |
Producer Price Index (September) |
| November 1 |
UK |
Manufacturing PMI (October) |
| |
|
|
| Asia/Pacific |
|
|
| October 29 |
Japan |
Household Spending (September) |
|
|
Retail Sales (September) |
|
|
Unemployment (September) |
| October 30 |
Japan |
Industrial Production (September) |
| November 1 |
China |
Manufacturing PMI (October) |
|
|
CFLP Manufacturing PMI (October) |
| |
|
|
| Americas |
|
|
| October 29 |
Canada |
Industrial Product Price Index (September) |
| October 31 |
Canada |
Monthly Gross Domestic Product (August) |
Anne D Picker is the author of International Economic Indicators and Central Banks.
|
