|
Central banks were once again front and center last week. The Reserve Bank of Australia along with the Banks of Japan and England released minutes of their last policy meetings while Fed chairman Ben Bernanke was on Capitol Hill giving his semi-annual testimony on the economy. And the Bank of Canada announced its first monetary policy decision under its new governor.
Global equities were near all-time highs as Ben Bernanke left markets assessing how to handle the inevitable phasing out of the Fed’s support. Bernanke went out of his way to stress that the cautious withdrawal would depend on economic conditions, comments that helped comfort asset markets. Bernanke did not say anything different than he has been saying — the Fed has always been data driven. Analysts say the increases in global equities have been fuelled by solid corporate earnings, especially in the United States and by reassurance from Fed Chairman Ben Bernanke over the Fed’s easy monetary policy.
 The Fed was not the only central bank making news. The Bank of Japan released minutes of its June 10th and 11th meeting. While the discussion revolved around tweaking its asset purchase program to lessen market volatility, in the end there was no change in its zero to 0.1 percent interest rate range or its goal to add ¥60 trillion to ¥70 trillion to money supply. It left its inflation goal at 2.0 percent in two years. Japan is being watched very carefully in global markets, especially since the introduction of the Bank of Japan’s massive stimulus package in April. The Fed was not the only central bank making news. The Bank of Japan released minutes of its June 10th and 11th meeting. While the discussion revolved around tweaking its asset purchase program to lessen market volatility, in the end there was no change in its zero to 0.1 percent interest rate range or its goal to add ¥60 trillion to ¥70 trillion to money supply. It left its inflation goal at 2.0 percent in two years. Japan is being watched very carefully in global markets, especially since the introduction of the Bank of Japan’s massive stimulus package in April.
In Australia, Reserve Bank of Australia watchers parsed the minutes of the July 2nd board meeting. At that time, the RBA left its policy interest rate at 2.75 percent. With the mining boom coming to an end and the economy weakening, watchers were looking for clues to the next interest rate cut. The wording in the minutes seemed to imply that the RBA was on hold, but with second quarter CPI due before the next policy meeting and the Australian dollar continuing to be overvalued, expectations are for a cut in the next two months. The financial crisis bypassed Australia and the country has not had a recession for over 23 years.
The Bank of England released its first minutes under the leadership of its new governor, Mark Carney. The monetary policy committee minutes revealed unanimous votes to keep the Bank Rate at 0.5 percent as well as for leaving the asset purchase ceiling at Stg375 billion. The votes marked a shift from recent meetings when three out of the nine members preferred to increase the easing program by £25 billion to £400 billion. The change in vote did not so much reflect a reassessment of the economic outlook as a desire to investigate alternative delivery mechanisms for further monetary stimulus. This leaves the focus of attention squarely on forward guidance — the MPC unusually issued a statement to explain its July vote. It also signaled that financial markets have become too aggressive in their pricing of future monetary tightening. Next month's Inflation Report should clarify just how far down this track the BoE wants to go.
Finally, the Bank of Canada announced its first policy decision under its new governor, Stephan Poloz. Poloz opted to keep the target for the overnight rate at the 1.0 percent level — it has been pegged there since September 2010 — while also maintaining the deposit rate at 0.75 percent and the Bank Rate at 1.25 percent. More significantly, amidst some limited speculation about its possible withdrawal, the BoC also opted to retain its gentle tightening bias, albeit with slightly different wording as part of an apparently modified approach towards forward guidance. The Bank indicated that it will continue keep its policy stance very accommodative subject to certain conditions, specifically “so long as there is significant slack in the Canadian economy, the inflation outlook remains muted and imbalances in the household sector continue to evolve constructively.'” Over time, a gradual normalization of interest rates is to be expected in line with the anticipated recovery in the economy.
|
|
2012 |
2013 |
% Change |
|
Index |
31-Dec |
July 12 |
July 19 |
Week |
Year |
| Asia/Pacific |
|
|
|
|
|
|
| Australia |
All Ordinaries |
4664.6 |
4957.5 |
4959.4 |
0.0% |
6.3% |
| Japan |
Nikkei 225 |
10395.2 |
14506.3 |
14589.9 |
0.6% |
40.4% |
| Hong Kong |
Hang Seng |
22656.9 |
21277.3 |
21362.4 |
0.4% |
-5.7% |
| S. Korea |
Kospi |
1997.1 |
1870.0 |
1871.4 |
0.1% |
-6.3% |
| Singapore |
STI |
3167.1 |
3236.1 |
3213.3 |
-0.7% |
1.5% |
| China |
Shanghai Composite |
2269.1 |
2039.5 |
1992.7 |
-2.3% |
-12.2% |
|
|
|
|
|
|
|
| India |
Sensex 30 |
19426.7 |
19958.5 |
20149.9 |
1.0% |
3.7% |
| Indonesia |
Jakarta Composite |
4316.7 |
4633.1 |
4724.4 |
2.0% |
9.4% |
| Malaysia |
KLCI |
1689.0 |
1785.7 |
1797.7 |
0.7% |
6.4% |
| Philippines |
PSEi |
5812.7 |
6574.2 |
6621.0 |
0.7% |
13.9% |
| Taiwan |
Taiex |
7699.5 |
8220.5 |
8062.0 |
-1.9% |
4.7% |
| Thailand |
SET |
1391.9 |
1453.7 |
1481.8 |
1.9% |
6.5% |
|
|
|
|
|
|
|
| Europe |
|
|
|
|
|
|
| UK |
FTSE 100 |
5897.8 |
6544.9 |
6630.7 |
1.3% |
12.4% |
| France |
CAC |
3641.1 |
3855.1 |
3925.3 |
1.8% |
7.8% |
| Germany |
XETRA DAX |
7612.4 |
8212.8 |
8331.6 |
1.4% |
9.4% |
| Italy |
FTSE MIB |
16273.4 |
15430.6 |
16124.4 |
4.5% |
-0.9% |
| Spain |
IBEX 35 |
8167.5 |
7844.7 |
7943.2 |
1.3% |
-2.7% |
| Sweden |
OMX Stockholm 30 |
1104.7 |
1210.7 |
1221.2 |
0.9% |
10.5% |
| Switzerland |
SMI |
6822.4 |
7983.2 |
7928.1 |
-0.7% |
16.2% |
|
|
|
|
|
|
|
| North America |
|
|
|
|
|
|
| United States |
Dow |
13104.1 |
15464.3 |
15543.7 |
0.5% |
18.6% |
|
NASDAQ |
3019.5 |
3600.1 |
3587.6 |
-0.3% |
18.8% |
|
S&P 500 |
1426.2 |
1680.2 |
1692.1 |
0.7% |
18.6% |
| Canada |
S&P/TSX Comp. |
12433.5 |
12462.2 |
12685.1 |
1.8% |
2.0% |
| Mexico |
Bolsa |
43705.8 |
40329.8 |
39891.7 |
-1.1% |
-8.7% |
 Although markets ended on a down note Friday, the FTSE, DAX and CAC advanced for a fourth week. Only the SMI retreated. For the week, disappointment with technology companies’ earnings (Microsoft and Google) was offset by Fed Chairman Ben Bernanke’s benign Congressional testimony as markets put a dovish spin on his comments. The FTSE was up 1.3 percent, the CAC gained 1.8 percent and the DAX added 1.4 percent. The SMI retreated 0.7 percent. Although markets ended on a down note Friday, the FTSE, DAX and CAC advanced for a fourth week. Only the SMI retreated. For the week, disappointment with technology companies’ earnings (Microsoft and Google) was offset by Fed Chairman Ben Bernanke’s benign Congressional testimony as markets put a dovish spin on his comments. The FTSE was up 1.3 percent, the CAC gained 1.8 percent and the DAX added 1.4 percent. The SMI retreated 0.7 percent.
The IMF highlighted the importance of restoring growth and rebalancing the UK economy to improve income and ensure debt sustainability. Concluding an annual assessment, the Executive Board of IMF said economic recovery in the UK continues to be slow and fragile. Directors welcomed progress in reducing fiscal risks and ensuring the sustainability of public debt. But a number of other Directors noted that slow growth could undermine the credibility of the adjustment effort and called for additional flexibility. Although the lender welcomed the accommodative stance of monetary policy, many directors were skeptical about the effectiveness of additional policy easing.
 Equities were mixed last week as investors here absorbed Fed Chairman Bernanke’s latest comments. At the same time they fretted about China’s growth prospects. Also on the horizon for investors was Sunday’s (July 21st) upper house election in Japan. On the week, the Shanghai Composite tumbled 2.3 percent while the Nikkei was up 0.6 percent. Equities were mixed last week as investors here absorbed Fed Chairman Bernanke’s latest comments. At the same time they fretted about China’s growth prospects. Also on the horizon for investors was Sunday’s (July 21st) upper house election in Japan. On the week, the Shanghai Composite tumbled 2.3 percent while the Nikkei was up 0.6 percent.
Trading in Japan came to a volatile end Friday, with the Nikkei swinging a wild 540 points as investors positioned themselves ahead of Sunday’s upper house elections. The Nikkei climbed nearly 1 percent in the first minutes of trading, placing it within 50 points of the 15,000 mark — a level last reached on May 22nd just before Bernanke made the first mention of scaling back the Fed’s stimulus program. Stocks rapidly sold off with the index falling more than 3 percent in a quarter of an hour before it closed down for the day.
Sunday’s elections are key to the prospects for Abenomics. Prime Minister Shinzo Abe’s LDP government is expected to win a majority of the seats, with some predicting a landslide victory. With a majority in place, there would be no excuse to delay implementing tough structural reforms that many deem necessary but which could prove to be risky and unpopular, including a consumption tax. The government’s ability to implement new policies over the next six months will be a litmus test for whether Abenomics can actually pull the Japanese economy out of deflation.
The Shanghai Composite was down three of five days and a third consecutive session on Friday on concerns about weakening domestic growth. Concerns over Chinese growth kept gains in check after the IMF said China's growth remains strong despite a moderate decline, but the current pace of expansion may not be sustainable unless the country implements major structural reforms under the Twelfth Five-Year Plan. According to analysts, China’s leadership seems to be accepting a lower trajectory of growth and is not taking short term measures to boost the economy.
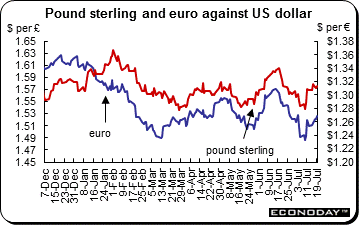 The U.S. dollar weakened against most of its major counterparts last week after Fed Chairman Ben Bernanke dampened speculation that a monetary stimulus reduction was imminent. After Bernanke’s comments, it was clear that the door is wide open for a number of different scenarios including increasing asset purchases if it is necessary. The idea for a September taper is still tentatively on the table, but there is a risk that some softness in U.S. data might ultimately push that back to around December. After several rounds of trying to explain to the markets what Bernanke said last month — namely that the purchases may slow this year and stop in the middle of next year if economic growth meets the Fed’s growth projections — the markets finally got it. Tapering is not tightening and it took several weeks for this to sink in. Analysts expect fluctuations in the dollar are going to be very data dependent. The U.S. dollar weakened against most of its major counterparts last week after Fed Chairman Ben Bernanke dampened speculation that a monetary stimulus reduction was imminent. After Bernanke’s comments, it was clear that the door is wide open for a number of different scenarios including increasing asset purchases if it is necessary. The idea for a September taper is still tentatively on the table, but there is a risk that some softness in U.S. data might ultimately push that back to around December. After several rounds of trying to explain to the markets what Bernanke said last month — namely that the purchases may slow this year and stop in the middle of next year if economic growth meets the Fed’s growth projections — the markets finally got it. Tapering is not tightening and it took several weeks for this to sink in. Analysts expect fluctuations in the dollar are going to be very data dependent.
 The yen was under pressure in the currency markets as focus switched to Sunday’s elections that are expected to strengthen the hand of Prime Minister Shinzo Abe and his economic stimulus policies. The yen was down against the dollar and euro. Abe’s Liberal Democratic Party (LDP) and its coalition partner New Komeito are on track to win more than 65 of the 121 upper house seats being contested, according to a poll published in the Nikkei newspaper on July 17. Victory will give the parties control of both chambers of parliament, strengthening the prime minister’s ability to carry out a three pronged plan of monetary easing, fiscal stimulus and deregulation known as Abenomics. The yen was under pressure in the currency markets as focus switched to Sunday’s elections that are expected to strengthen the hand of Prime Minister Shinzo Abe and his economic stimulus policies. The yen was down against the dollar and euro. Abe’s Liberal Democratic Party (LDP) and its coalition partner New Komeito are on track to win more than 65 of the 121 upper house seats being contested, according to a poll published in the Nikkei newspaper on July 17. Victory will give the parties control of both chambers of parliament, strengthening the prime minister’s ability to carry out a three pronged plan of monetary easing, fiscal stimulus and deregulation known as Abenomics.
|
|
2012 |
2013 |
% Change |
|
|
Dec 31 |
July 12 |
July 19 |
Week |
2013 |
| U.S. $ per currency |
|
|
|
|
|
|
| Australia |
A$ |
1.040 |
0.906 |
0.919 |
1.4% |
-11.6% |
| New Zealand |
NZ$ |
0.829 |
0.779 |
0.794 |
2.0% |
-4.2% |
| Canada |
C$ |
1.007 |
0.962 |
0.965 |
0.3% |
-4.2% |
| Eurozone |
euro (€) |
1.319 |
1.307 |
1.314 |
0.6% |
-0.4% |
| UK |
pound sterling (£) |
1.623 |
1.510 |
1.527 |
1.1% |
-5.9% |
|
|
|
|
|
|
|
| Currency per U.S. $ |
|
|
|
|
|
|
| China |
yuan |
6.231 |
6.138 |
6.139 |
0.0% |
1.5% |
| Hong Kong |
HK$* |
7.750 |
7.759 |
7.758 |
0.0% |
-0.1% |
| India |
rupee |
54.995 |
59.630 |
59.350 |
0.5% |
-7.3% |
| Japan |
yen |
86.750 |
99.340 |
100.320 |
-1.0% |
-13.5% |
| Malaysia |
ringgit |
3.058 |
3.178 |
3.192 |
-0.5% |
-4.2% |
| Singapore |
Singapore $ |
1.222 |
1.262 |
1.266 |
-0.3% |
-3.5% |
| South Korea |
won |
1064.400 |
1124.470 |
1121.750 |
0.2% |
-5.1% |
| Taiwan |
Taiwan $ |
29.033 |
29.909 |
29.959 |
-0.2% |
-3.1% |
| Thailand |
baht |
30.580 |
31.140 |
31.030 |
0.4% |
-1.5% |
| Switzerland |
Swiss franc |
0.916 |
0.946 |
0.941 |
0.5% |
-2.7% |
| *Pegged to U.S. dollar |
|
|
|
|
|
|
| Source: Bloomberg |
|
|
|
|
|
|
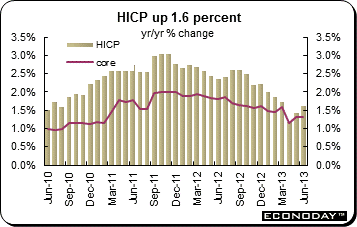 June final harmonized index of consumer prices was up 0.1 percent on the month and 1.6 percent from a year ago. Core HICP excluding food, drink, tobacco & petrol prices were up 1.2 percent on the year, without just seasonal food and petrol, up 1.4 percent and omitting only unprocessed food and petrol, 1.3 percent. By contrast, energy costs were 1.6 percent higher on the year after a 0.2 percent drop last time. June final harmonized index of consumer prices was up 0.1 percent on the month and 1.6 percent from a year ago. Core HICP excluding food, drink, tobacco & petrol prices were up 1.2 percent on the year, without just seasonal food and petrol, up 1.4 percent and omitting only unprocessed food and petrol, 1.3 percent. By contrast, energy costs were 1.6 percent higher on the year after a 0.2 percent drop last time.
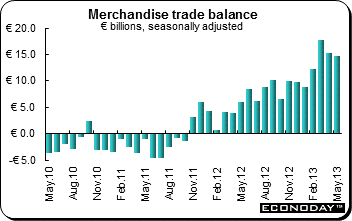 May merchandise trade surplus was €14.6 billion, down from a smaller revised €15.2 billion surplus in April. The deterioration reflected a 2.3 percent monthly drop in exports that followed a 1.1 percent decline in April. The erosion of the surplus would have been a good deal more pronounced but for a 2.2 percent monthly slide in imports that easily more than offset April's modest increase and left purchases of overseas goods at their weakest level since the end of 2010. When compared with a year ago, exports were only flat but even this compares favorably with a 6.0 percent slump in imports. May merchandise trade surplus was €14.6 billion, down from a smaller revised €15.2 billion surplus in April. The deterioration reflected a 2.3 percent monthly drop in exports that followed a 1.1 percent decline in April. The erosion of the surplus would have been a good deal more pronounced but for a 2.2 percent monthly slide in imports that easily more than offset April's modest increase and left purchases of overseas goods at their weakest level since the end of 2010. When compared with a year ago, exports were only flat but even this compares favorably with a 6.0 percent slump in imports.
 July ZEW expectations index slid 2.2 points to 36.3, its lowest level since April but still within the recent tight range and above its long run average of 23.7. Current conditions gained a couple of points to 10.6 and in so doing secured both their first monthly increase since March and also their highest reading since March. This index similarly remains well within its 5.2 to 13.6 band seen since the end of last year. July ZEW expectations index slid 2.2 points to 36.3, its lowest level since April but still within the recent tight range and above its long run average of 23.7. Current conditions gained a couple of points to 10.6 and in so doing secured both their first monthly increase since March and also their highest reading since March. This index similarly remains well within its 5.2 to 13.6 band seen since the end of last year.
 June consumer prices were down 0.2 percent on the month and up 2.9 percent from a year ago. The main positive impact on the change in the annual rate came from a smaller decline than in June 2012 in clothing & footwear charges which added nearly 0.2 percentage points and an increase in transport costs (mainly motor fuels) compared with a decline last year which added a further 0.1 percentage point. Most other categories had only minor effects but core inflation still edged up to 2.3 percent from 2.2 percent the month before. June consumer prices were down 0.2 percent on the month and up 2.9 percent from a year ago. The main positive impact on the change in the annual rate came from a smaller decline than in June 2012 in clothing & footwear charges which added nearly 0.2 percentage points and an increase in transport costs (mainly motor fuels) compared with a decline last year which added a further 0.1 percentage point. Most other categories had only minor effects but core inflation still edged up to 2.3 percent from 2.2 percent the month before.
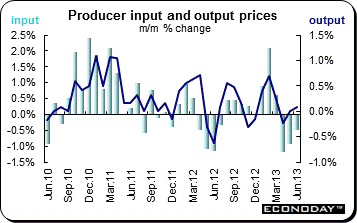 June input producer price index was up 0.2 percent and 4.2 percent higher from a year ago. Output prices edged up 0.1 percent and were 2.0 percent above their year ago level. Within the latter most categories saw relatively subdued monthly moves with food (0.4 percent) registering the steepest increase ahead of petroleum products (0.3 percent). The only declines were in chemicals & pharmaceuticals (0.1 percent) and tobacco & alcohol (also 0.1 percent). Core output prices were unchanged from mid-quarter and only 1.0 percent higher on the year. Input costs were much more volatile with a hefty monthly increase in home food materials (7.2 percent) contrasting with decreases in most other areas, notably fuel (1.7 percent) and imported metals (also 1.7 percent). June input producer price index was up 0.2 percent and 4.2 percent higher from a year ago. Output prices edged up 0.1 percent and were 2.0 percent above their year ago level. Within the latter most categories saw relatively subdued monthly moves with food (0.4 percent) registering the steepest increase ahead of petroleum products (0.3 percent). The only declines were in chemicals & pharmaceuticals (0.1 percent) and tobacco & alcohol (also 0.1 percent). Core output prices were unchanged from mid-quarter and only 1.0 percent higher on the year. Input costs were much more volatile with a hefty monthly increase in home food materials (7.2 percent) contrasting with decreases in most other areas, notably fuel (1.7 percent) and imported metals (also 1.7 percent).
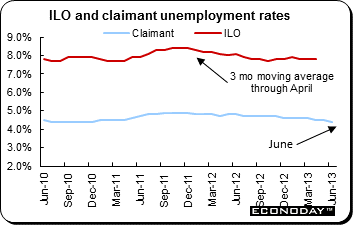 June claimant count joblessness was down a sharp 21,200 — its largest decline since June 2010 — after a steeper revised 16,200 slide in May. Last month's drop was the eighth in a row and reduced the claimant count rate to 4.4 percent from 4.5 percent, its lowest level since February 2009. The ILO data painted a similar picture with joblessness on this measure down 57,000 over the three months to May, although this left the unemployment rate steady at 7.8 percent. Headline average earnings picked up from a higher revised 1.5 percent in April to a firmer than anticipated 1.7 percent in May. However, this was still historically very soft and, excluding bonuses, the rate was only 1.0 percent. June claimant count joblessness was down a sharp 21,200 — its largest decline since June 2010 — after a steeper revised 16,200 slide in May. Last month's drop was the eighth in a row and reduced the claimant count rate to 4.4 percent from 4.5 percent, its lowest level since February 2009. The ILO data painted a similar picture with joblessness on this measure down 57,000 over the three months to May, although this left the unemployment rate steady at 7.8 percent. Headline average earnings picked up from a higher revised 1.5 percent in April to a firmer than anticipated 1.7 percent in May. However, this was still historically very soft and, excluding bonuses, the rate was only 1.0 percent.
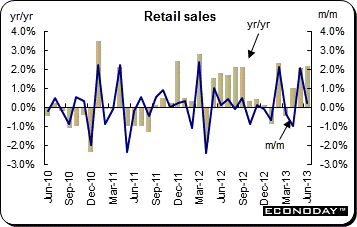 June retail sales were up 0.2 percent after gaining 2.1 percent in May. Compared with a year ago, volumes were up 2.2 percent. Excluding auto fuel, purchases also advanced 0.2 percent from May and were 2.1 percent higher than in June 2012. Excluding auto fuel, non-food sales advanced 0.6 percent on the month (2.2 percent on the year). By contrast, predominantly food stores saw a 0.1 percent monthly decline. Non-specialized stores jumped 3.0 percent from mid-quarter and household goods reported a 0.6 percent increase. However, clothing & footwear dropped 0.3 percent and the other stores category was flat. There was also a 0.4 percent drop in non-store retailing, most likely in part due to the sharp improvement in the weather. Fuel sales were unchanged from May. June retail sales were up 0.2 percent after gaining 2.1 percent in May. Compared with a year ago, volumes were up 2.2 percent. Excluding auto fuel, purchases also advanced 0.2 percent from May and were 2.1 percent higher than in June 2012. Excluding auto fuel, non-food sales advanced 0.6 percent on the month (2.2 percent on the year). By contrast, predominantly food stores saw a 0.1 percent monthly decline. Non-specialized stores jumped 3.0 percent from mid-quarter and household goods reported a 0.6 percent increase. However, clothing & footwear dropped 0.3 percent and the other stores category was flat. There was also a 0.4 percent drop in non-store retailing, most likely in part due to the sharp improvement in the weather. Fuel sales were unchanged from May.
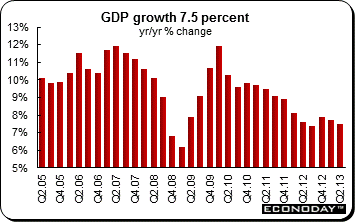 Second quarter gross domestic product was up 7.5 percent from a year ago as expected. On the quarter, GDP was up 1.7 percent after a gain of 1.6 percent in the first quarter. This was the second consecutive quarter that growth has slowed. In the first half of the year, GDP was up 7.6 percent when compared with a year earlier. According to NBS, growth remains in a reasonable range. However, it also said that growth would remain ‘complicated’ for the rest of the year. Second quarter gross domestic product was up 7.5 percent from a year ago as expected. On the quarter, GDP was up 1.7 percent after a gain of 1.6 percent in the first quarter. This was the second consecutive quarter that growth has slowed. In the first half of the year, GDP was up 7.6 percent when compared with a year earlier. According to NBS, growth remains in a reasonable range. However, it also said that growth would remain ‘complicated’ for the rest of the year.
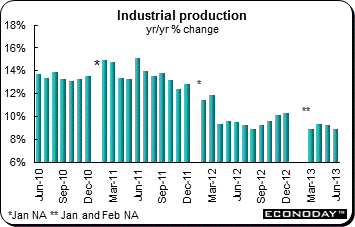 June industrial output was up a less than expected 8.9 percent after increasing 9.2 percent in May. Analysts expected an increase of 9.1 percent. On the month, output was up 0.68 percent. For the first half of the year, output was up 9.3 percent when compared with the first six months of 2012. All major categories were up on the year with the exception of transportation which was down 0.8 percent after increasing 0.5 percent in May. Among the categories where growth eased from May were textiles, up 8.0 percent after 8.9 percent in May, and ferrous metals which were up 7.7 percent, down from 9.1 percent the month before. Motor vehicle output was up 13.5 percent after increasing 15.7 percent in May and 18.3 percent in April. Communications output increased 11.8 percent after 12.5 percent in May. However, output of non-metal minerals increased to 11.5 percent from 11.0 percent the month before. June industrial output was up a less than expected 8.9 percent after increasing 9.2 percent in May. Analysts expected an increase of 9.1 percent. On the month, output was up 0.68 percent. For the first half of the year, output was up 9.3 percent when compared with the first six months of 2012. All major categories were up on the year with the exception of transportation which was down 0.8 percent after increasing 0.5 percent in May. Among the categories where growth eased from May were textiles, up 8.0 percent after 8.9 percent in May, and ferrous metals which were up 7.7 percent, down from 9.1 percent the month before. Motor vehicle output was up 13.5 percent after increasing 15.7 percent in May and 18.3 percent in April. Communications output increased 11.8 percent after 12.5 percent in May. However, output of non-metal minerals increased to 11.5 percent from 11.0 percent the month before.
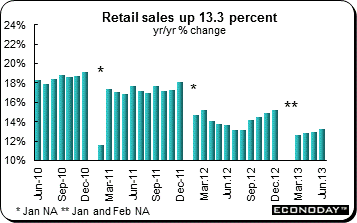 June retail sales were up a better than expected 13.3 percent. Expectations were for an increase of 12.9 percent. On the month retail sales were up 1.26 percent. For the first half of the year, sales were up 12.7 percent when compared with the year before. Sales in all major categories increased. Urban retail sales were up 13.0 percent after increasing 12.6 percent the month before while rural sales were up 15.1 percent after 14.8 percent in May. Auto sales were up 11.4 percent after increasing 9.7 percent in May. Clothing sales jumped 15.0 percent after increasing 10.9 percent. June retail sales were up a better than expected 13.3 percent. Expectations were for an increase of 12.9 percent. On the month retail sales were up 1.26 percent. For the first half of the year, sales were up 12.7 percent when compared with the year before. Sales in all major categories increased. Urban retail sales were up 13.0 percent after increasing 12.6 percent the month before while rural sales were up 15.1 percent after 14.8 percent in May. Auto sales were up 11.4 percent after increasing 9.7 percent in May. Clothing sales jumped 15.0 percent after increasing 10.9 percent.
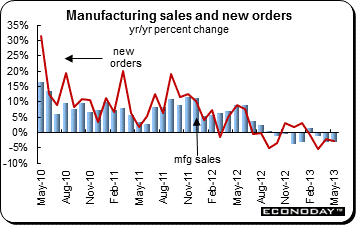 May manufacturing sales were up 0.7 percent on the month but down 3.2 percent from a year ago. The advance in nominal sales was matched by volumes which also gained 0.7 percent from the start of the quarter. Eleven of the 21 reporting industries made some headway in May. The strongest monthly increase was registered by chemicals (5.1 percent) and there were decent performances too by primary metals (3.0 percent), non-metallic minerals (3.8 percent), machinery (3.8 percent) and fabricated metals (3.4 percent). Among the weaker categories, wood was down 4.8 percent, computer & electronics down 4.3 percent and food down 1.3 percent. The rest of the survey was generally quite upbeat. In particular, new orders were up a solid 1.8 percent from April and backlogs rose 0.6 percent. At the same time, inventories dropped 0.2 percent, enough to shave 0.01 months off the inventory/sales ratio which now stands at 1.42 months. May manufacturing sales were up 0.7 percent on the month but down 3.2 percent from a year ago. The advance in nominal sales was matched by volumes which also gained 0.7 percent from the start of the quarter. Eleven of the 21 reporting industries made some headway in May. The strongest monthly increase was registered by chemicals (5.1 percent) and there were decent performances too by primary metals (3.0 percent), non-metallic minerals (3.8 percent), machinery (3.8 percent) and fabricated metals (3.4 percent). Among the weaker categories, wood was down 4.8 percent, computer & electronics down 4.3 percent and food down 1.3 percent. The rest of the survey was generally quite upbeat. In particular, new orders were up a solid 1.8 percent from April and backlogs rose 0.6 percent. At the same time, inventories dropped 0.2 percent, enough to shave 0.01 months off the inventory/sales ratio which now stands at 1.42 months.
 June consumer price index was unchanged on the month and up 1.2 percent from a year ago. Excluding food and energy the CPI slipped 0.1 percent from mid quarter and was up 0.9 percent from June 2012. At the same time, the BoC index dropped a steeper 0.2 percent from May and was 1.3 percent above its year ago level. Seasonally adjusted CPI was up 0.3 percent on the month. Both the ex-food and energy and BoC core measures advanced 0.2 percent. Within the adjusted basket only transportation (1.6 percent) showed any real strength. Elsewhere, shelter & household operations and furnishings & equipment posted a 0.2 percent increase while food, health & personal care & recreation and education & reading gained 0.1 percent. Clothing & footwear was unchanged. Alcohol & tobacco edged down 0.1 percent. June consumer price index was unchanged on the month and up 1.2 percent from a year ago. Excluding food and energy the CPI slipped 0.1 percent from mid quarter and was up 0.9 percent from June 2012. At the same time, the BoC index dropped a steeper 0.2 percent from May and was 1.3 percent above its year ago level. Seasonally adjusted CPI was up 0.3 percent on the month. Both the ex-food and energy and BoC core measures advanced 0.2 percent. Within the adjusted basket only transportation (1.6 percent) showed any real strength. Elsewhere, shelter & household operations and furnishings & equipment posted a 0.2 percent increase while food, health & personal care & recreation and education & reading gained 0.1 percent. Clothing & footwear was unchanged. Alcohol & tobacco edged down 0.1 percent.
Most equity indexes gained last week. Investors had their fill of central bank speak — Fed’s Bernanke on Capitol Hill for two days and three sets of bank meeting minutes to digest along with the Bank of Canada’s policy announcement and Monetary Policy Report. Economic data were mixed in the U.S. and Europe, but mostly better than expected in the UK. China’s second quarter gross domestic product data showed that the economy slowed once again.
The week ahead is a relatively quiet one with no major central bank meetings and a limited supply of new economic data to parse with the exception of the flash manufacturing PMIs for July. The UK also releases its first estimate of second quarter GDP. Investors will focus on the heavy stream of earnings reports that are expected.
| The following indicators will be released this week... |
| Europe |
|
|
| July 24 |
Eurozone |
Flash Manufacturing PMI (July) |
|
Germany |
Flash Manufacturing PMI (July) |
|
France |
Flash Manufacturing PMI (July) |
| July 25 |
Eurozone |
M3 Money Supply (June) |
|
Germany |
Ifo Business Survey (July) |
|
UK |
Gross Domestic Product (Q2.2013) |
| |
|
|
| Asia/Pacific |
|
|
| July 24 |
Japan |
Merchandise Trade Balance (June) |
|
Australia |
Consumer Price Index (Q2.2013) |
|
China |
Flash Manufacturing PMI (July) |
| |
|
|
| Americas |
|
|
| July 23 |
Canada |
Retail Sales (May) |
Anne D Picker is the author of International Economic Indicators and Central Banks.
|
