|
Equities were up for the most part last week thanks to a mix of positive earnings reports and economic data. Weak data from China and Germany were interpreted positively because it said that now the ECB will have to cut its key interest rate May 2nd to boost the recession prone Eurozone out of its doldrums. Currencies were in focus during the week with traders of the yen, euro and U.S. dollar in particular having a number of crucial policy and data catalysts to contend with. Early attention was on the yen, which gained against the U.S. dollar after the Bank of Japan left policy unchanged.
The Reserve Bank of New Zealand and Bank of Japan decisions described below portray two economies in very different places. The RBNZ is complaining about a high exchange rate but the economy is growing despite a drought. New Zealand is also recovering from severe earthquake damage just as Japan is. The BoJ is trying to drag the economy out of its mire of virtually no growth and severe deflation.
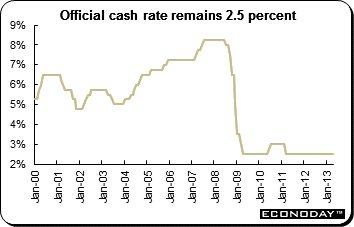 As expected, the Reserve Bank of New Zealand left its official cash rate at 2.5 percent where it has been since March 2011 as it battles a high exchange rate and rising house prices. The Bank has left the OCR unchanged to allow the economy to recover from the earthquakes that battered the South Island city of Christchurch and to revive confidence after Europe’s sovereign debt crisis curbed global demand. The RBNZ, with an inflation target range of 1 percent to three percent, noted that the March quarter consumer price index was up 0.9 percent on the year and is expected to remain close to the bottom of the range for this year. Reserve Bank Governor Graeme Wheeler extended the Bank’s two year rate pause as drought, government spending cuts and a stronger New Zealand dollar curb economic growth and contain prices. The Bank expects to keep the OCR unchanged for the rest of 2013. As expected, the Reserve Bank of New Zealand left its official cash rate at 2.5 percent where it has been since March 2011 as it battles a high exchange rate and rising house prices. The Bank has left the OCR unchanged to allow the economy to recover from the earthquakes that battered the South Island city of Christchurch and to revive confidence after Europe’s sovereign debt crisis curbed global demand. The RBNZ, with an inflation target range of 1 percent to three percent, noted that the March quarter consumer price index was up 0.9 percent on the year and is expected to remain close to the bottom of the range for this year. Reserve Bank Governor Graeme Wheeler extended the Bank’s two year rate pause as drought, government spending cuts and a stronger New Zealand dollar curb economic growth and contain prices. The Bank expects to keep the OCR unchanged for the rest of 2013.
The RBNZ is facing a record high currency and low inflation on one hand, and risks to inflation and financial stability from rising house prices on the other. In his statement, Governor Graeme Wheeler once again said that the New Zealand dollar is overvalued and continues to be a negative for the tradables sector. He noted that growth has picked up thanks to consumer spending and the rebuilding activity in Canterbury. Wheeler reiterated his confidence the economy will rebound, led by global growth, a lift in consumer spending and reconstruction of earthquake devastated Christchurch. New Zealand faces an estimated NZ$30 billion rebuild of its third largest city after a series of temblors that began in late 2010, including the nation’s deadliest earthquake in 80 years in February 2011.
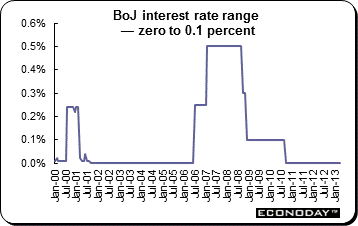 As expected, the Bank of Japan left its key policy interest rate range at zero to 0.1 percent. The brief announcement said the Bank of Japan would conduct money market operations so that the monetary base will increase at an annual pace of about ¥60 to ¥70 trillion. Little policy change was expected in the wake of the April 4th announcement when BoJ Governor Haruhiko Kuroda shocked markets with a radical policy overhaul — it adopted a new balance sheet target and pledged to double its government bond holdings in two years as it seeks to end nearly two decades of deflation. Since then, analysts have emphasized the importance for companies and consumers to buy into the idea that policy will successfully push inflation to 2.0 percent over the next two years or so. As expected, the Bank of Japan left its key policy interest rate range at zero to 0.1 percent. The brief announcement said the Bank of Japan would conduct money market operations so that the monetary base will increase at an annual pace of about ¥60 to ¥70 trillion. Little policy change was expected in the wake of the April 4th announcement when BoJ Governor Haruhiko Kuroda shocked markets with a radical policy overhaul — it adopted a new balance sheet target and pledged to double its government bond holdings in two years as it seeks to end nearly two decades of deflation. Since then, analysts have emphasized the importance for companies and consumers to buy into the idea that policy will successfully push inflation to 2.0 percent over the next two years or so.
The first semiannual report on the price and economic outlook under Governor Kuroda was released after the meeting’s end. The BoJ said it does not expect prices to reach its stated 2.0 percent inflation target over the next two years. Rather, it said its nine member monetary policy board projects a 1.9 percent increase in the core consumer price index in fiscal 2015 beginning in April that year. It said that inflation was likely to hit around 2 percent toward the end of the year, which runs until the end of March, 2016. The figure excludes the effects of a 3.0 percent sales tax increase planned from April 2014. The board members see the CPI rising to 0.7 percent in the current fiscal year that began April 1st and increasing 1.4 percent in the subsequent fiscal year. The MPB also said it was extending its forecast period for prices and growth by one fiscal year. The March consumer price data which was released earlier showed that there is much work to do. The CPI excluding fresh food slumped 0.5 percent from a year ago.
The board members expect the economy to grow 2.9 percent in real terms for the current fiscal year and 1.4 percent for the following fiscal year. These figures compare with gross domestic product forecasts of 2.3 percent for this fiscal year and 0.8 percent for the next fiscal year in its interim forecast in January.
|
|
2012 |
2013 |
% Change |
|
Index |
31-Dec |
April 19 |
April 26 |
Week |
Year |
| Asia/Pacific |
|
|
|
|
|
|
| Australia |
All Ordinaries |
4664.6 |
4923.0 |
5082.7 |
3.2% |
9.0% |
| Japan |
Nikkei 225 |
10395.2 |
13316.5 |
13884.1 |
4.3% |
33.6% |
| Hong Kong |
Hang Seng |
22656.9 |
22013.6 |
22547.7 |
2.4% |
-0.5% |
| S. Korea |
Kospi |
1997.1 |
1906.8 |
1944.6 |
2.0% |
-2.6% |
| Singapore |
STI |
3167.1 |
3294.1 |
3348.9 |
1.7% |
5.7% |
| China |
Shanghai Composite |
2269.1 |
2244.6 |
2177.9 |
-3.0% |
-4.0% |
|
|
|
|
|
|
|
| India |
Sensex 30 |
19426.7 |
19016.5 |
19286.7 |
1.4% |
-0.7% |
| Indonesia |
Jakarta Composite |
4316.7 |
4998.5 |
4978.5 |
-0.4% |
15.3% |
| Malaysia |
KLCI |
1689.0 |
1706.3 |
1711.3 |
0.3% |
1.3% |
| Philippines |
PSEi |
5812.7 |
6957.1 |
7025.4 |
1.0% |
20.9% |
| Taiwan |
Taiex |
7699.5 |
7930.8 |
8022.1 |
1.2% |
4.2% |
| Thailand |
SET |
1391.9 |
1545.5 |
1582.9 |
2.4% |
13.7% |
|
|
|
|
|
|
|
| Europe |
|
|
|
|
|
|
| UK |
FTSE 100 |
5897.8 |
6286.6 |
6426.4 |
2.2% |
9.0% |
| France |
CAC |
3641.1 |
3652.0 |
3810.1 |
4.3% |
4.6% |
| Germany |
XETRA DAX |
7612.4 |
7460.0 |
7814.8 |
4.8% |
2.7% |
| Italy |
FTSE MIB |
16273.4 |
15760.8 |
16565.3 |
5.1% |
1.8% |
| Spain |
IBEX 35 |
8167.5 |
7915.5 |
8297.0 |
4.8% |
1.6% |
| Sweden |
OMX Stockholm 30 |
1104.7 |
1147.3 |
1194.7 |
4.1% |
8.1% |
| Switzerland |
SMI |
6822.4 |
7618.8 |
7856.3 |
3.1% |
15.2% |
|
|
|
|
|
|
|
| North America |
|
|
|
|
|
|
| United States |
Dow |
13104.1 |
14547.5 |
14712.6 |
1.1% |
12.3% |
|
NASDAQ |
3019.5 |
3206.1 |
3279.3 |
2.3% |
8.6% |
|
S&P 500 |
1426.2 |
1555.3 |
1582.2 |
1.7% |
10.9% |
| Canada |
S&P/TSX Comp. |
12433.5 |
12065.6 |
12220.2 |
1.3% |
-1.7% |
| Mexico |
Bolsa |
43705.8 |
42808.2 |
41897.0 |
-2.1% |
-4.1% |
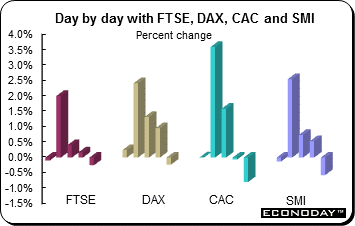 Equities posted healthy gains for the week despite Friday’s slump. Positive earnings helped buoy stocks in part. However, reaction to disappointing economic data was muted by the thought that this would push the European Central Bank to lower its policy interest rate when it meets May 2nd. Friday’s declines were attributed to weaker than expected U.S. first quarter growth which was partially but not entirely offset by better than expected consumer sentiment. The FTSE was up 2.2 percent on the week, the SMI gained 3.1 percent while the CAC and DAX jumped 4.3 percent and 4.8 percent respectively. Equities posted healthy gains for the week despite Friday’s slump. Positive earnings helped buoy stocks in part. However, reaction to disappointing economic data was muted by the thought that this would push the European Central Bank to lower its policy interest rate when it meets May 2nd. Friday’s declines were attributed to weaker than expected U.S. first quarter growth which was partially but not entirely offset by better than expected consumer sentiment. The FTSE was up 2.2 percent on the week, the SMI gained 3.1 percent while the CAC and DAX jumped 4.3 percent and 4.8 percent respectively.
The Spanish government downgraded its economic forecasts and now sees a wider economic contraction for this year. Prime Minister Mariano Rajoy said GDP would decline 1.3 percent this year. The projection is far worse than the earlier forecast of a 0.5 percent drop. The latest set of forecasts from the government showed the ailing economy returning to growth in 2014 by registering an expansion of 0.5 percent. Earlier in the week, the first quarter unemployment rate soared to a record 27.2 percent from 26.0 percent in the fourth quarter of 2012.
There was good news on the economic front — first quarter gross domestic product in the UK expanded 0.3 percent from the preceding quarter compared with expectations for a 0.1 percent rise. Gilts fell sharply while the pound rose to a fresh two month high against the dollar and a three week high against the euro. The reaction in equity markets was a little more muted. However, German data disappointed —Tuesday's German PMI surveys for April and Wednesday's Ifo survey both were weaker than expected. The PMI showed that German manufacturing contracted in April while the Ifo survey indicated that both current sentiment and expectations swooned.
Supporting expectations that the ECB might act, Vice President Vitor Constancio said Wednesday that the bank is ready to adjust monetary policy if economic conditions in the euro area continue to worsen. He also said that monetary policy is accommodative and will continue to be accommodative to respond to the present conditions in which inflation is going down in a significant way.
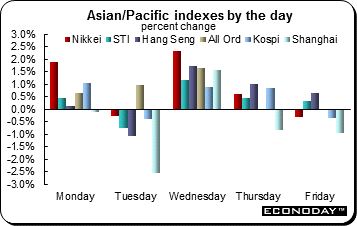 Most equities here also gained last week. The major exception was the Shanghai Composite, which was 3.0 percent lower after gaining 1.7 percent the previous week. In contrast, the Nikkei was up a heady 4.3 percent after retreating 1.3 percent in the previous week. Investors had a mix of disappointing economic data —sliding PMI indexes in China and Europe — that was counterbalanced by many favorable earnings reports. U.S. first quarter GDP data were released after markets here were closed for the week. The Bank of Japan announcement was watched closely and especially its first inflation and growth forecasts under its new governor. ECB stimulus hopes and rebounding commodity prices however, did underpin sentiment. Most equities here also gained last week. The major exception was the Shanghai Composite, which was 3.0 percent lower after gaining 1.7 percent the previous week. In contrast, the Nikkei was up a heady 4.3 percent after retreating 1.3 percent in the previous week. Investors had a mix of disappointing economic data —sliding PMI indexes in China and Europe — that was counterbalanced by many favorable earnings reports. U.S. first quarter GDP data were released after markets here were closed for the week. The Bank of Japan announcement was watched closely and especially its first inflation and growth forecasts under its new governor. ECB stimulus hopes and rebounding commodity prices however, did underpin sentiment.
Japanese share prices, especially those of exporters, continue to fluctuate with the value of the yen. Also weighing on investor sentiment on Friday was March consumer price data that showed core consumer prices excluding fresh food slid 0.5 percent from a year earlier, the fifth straight monthly decline.
During the week, Asian stocks followed global markets higher thanks to solid U.S. earnings and relatively upbeat new home sales data. Weaker than expected economic data from China and Europe boosted speculation that global central banks will keep interest rates low and step up economic stimulus to boost growth. With the euro area remaining mired in recession, investors bet that the ECB will cut its key lending rate when it meets.
Asian stocks fell broadly on Tuesday on concerns over China's economic outlook after a preliminary report showed Chinese manufacturing activity expanded less than economists estimated in April. The flash HSBC Purchasing Managers' Index for the month fell to a two-month low of 50.5 from a final reading of 51.6 in March, suggesting China still faces considerable headwinds into the second quarter.
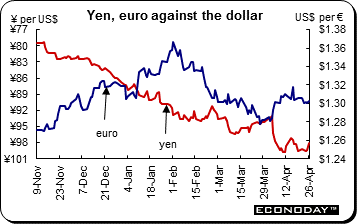 The yen advanced last week after core consumer price index dropped the most in two years, the BoJ kept its monetary stance unchanged and later released its economic forecasts. Since mid-November, the yen has tumbled about 18 percent and the Nikkei has climbed 60 percent on optimism about Abenomics, the reflationary policy framework promoted by Prime Minister Shinzo Abe, who won office in December and installed Haruhiko Kuroda in March as Bank of Japan governor. On a sustained basis, consumer prices have not risen at the 2 percent pace the BoJ set as its target in January since the early 1990s. The yen advanced last week after core consumer price index dropped the most in two years, the BoJ kept its monetary stance unchanged and later released its economic forecasts. Since mid-November, the yen has tumbled about 18 percent and the Nikkei has climbed 60 percent on optimism about Abenomics, the reflationary policy framework promoted by Prime Minister Shinzo Abe, who won office in December and installed Haruhiko Kuroda in March as Bank of Japan governor. On a sustained basis, consumer prices have not risen at the 2 percent pace the BoJ set as its target in January since the early 1990s.
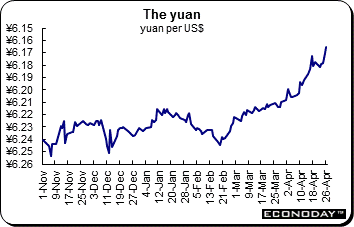 The yuan climbed to a 19 year high after the Peoples Bank of China set a record reference rate amid growing usage of the currency for worldwide trade and investment. Global yuan payments increased 32.7 percent in March from the previous month according to the Society for Worldwide Interbank Financial Telecommunication. Hong Kong Monetary Authority said that the value of trade settled in the yuan by the city’s banks rose 45 percent from a year earlier in the first quarter while the Reserve Bank of Australia announced plans to put about 5 percent of its foreign exchange reserves in China. The yuan climbed to a 19 year high after the Peoples Bank of China set a record reference rate amid growing usage of the currency for worldwide trade and investment. Global yuan payments increased 32.7 percent in March from the previous month according to the Society for Worldwide Interbank Financial Telecommunication. Hong Kong Monetary Authority said that the value of trade settled in the yuan by the city’s banks rose 45 percent from a year earlier in the first quarter while the Reserve Bank of Australia announced plans to put about 5 percent of its foreign exchange reserves in China.
The yuan’s trading band against the dollar is likely to be widened around June, before the U.S.-China Strategic and Economic Dialogue in Washington during the week of July 8 to July 12. The last revision, which doubled the band, was announced on April 14, 2012.
|
|
2012 |
2013 |
% Change |
|
|
Dec 31 |
Apr 19 |
Apr 26 |
Week |
2013 |
| U.S. $ per currency |
|
|
|
|
|
|
| Australia |
A$ |
1.040 |
1.029 |
1.028 |
0.0% |
-1.1% |
| New Zealand |
NZ$ |
0.829 |
0.843 |
0.849 |
0.7% |
2.4% |
| Canada |
C$ |
1.007 |
0.974 |
0.984 |
0.9% |
-2.3% |
| Eurozone |
euro (€) |
1.319 |
1.306 |
1.303 |
-0.2% |
-1.2% |
| UK |
pound sterling (£) |
1.623 |
1.523 |
1.548 |
1.7% |
-4.6% |
|
|
|
|
|
|
|
| Currency per U.S. $ |
|
|
|
|
|
|
| China |
yuan |
6.231 |
6.178 |
6.165 |
0.2% |
1.1% |
| Hong Kong |
HK$* |
7.750 |
7.764 |
7.763 |
0.0% |
-0.2% |
| India |
rupee |
54.995 |
53.973 |
54.375 |
-0.7% |
1.1% |
| Japan |
yen |
86.750 |
99.520 |
98.100 |
1.4% |
-11.6% |
| Malaysia |
ringgit |
3.058 |
3.036 |
3.035 |
0.0% |
0.8% |
| Singapore |
Singapore $ |
1.222 |
1.237 |
1.236 |
0.1% |
-1.2% |
| South Korea |
won |
1064.400 |
1116.300 |
1112.010 |
0.4% |
-4.3% |
| Taiwan |
Taiwan $ |
29.033 |
29.813 |
29.639 |
0.6% |
-2.0% |
| Thailand |
baht |
30.580 |
28.630 |
29.250 |
-2.1% |
4.5% |
| Switzerland |
Swiss franc |
0.916 |
0.933 |
0.943 |
-1.0% |
-2.9% |
| *Pegged to U.S. dollar |
|
|
|
|
|
|
| Source: Bloomberg |
|
|
|
|
|
|
 April flash composite PMI reading was unchanged at 46.5. A reading below 50 indicates contraction. The index on manufacturing slipped to 46.5 from 46.8. The PMI for Germany dipped below the breakeven point after four months of expansion. The composite index reading was 48.8 with manufacturing declining to 47.9 and services down to 49.2. In France, the rate of decline slowed with the composite index rising from a 4-month low in March of 41.9 to 44.2 in April, its highest reading this year. Both manufacturing and services posted 4-month highs with the former at 44.4 and the latter at 44.1. Elsewhere, China’s flash manufacturing PMI grew at a slower rate. The flash reading was 50.5, down from the final March reading of 51.6. And in the US, the flash manufacturing reading eased to 52.0 from 54.9. April flash composite PMI reading was unchanged at 46.5. A reading below 50 indicates contraction. The index on manufacturing slipped to 46.5 from 46.8. The PMI for Germany dipped below the breakeven point after four months of expansion. The composite index reading was 48.8 with manufacturing declining to 47.9 and services down to 49.2. In France, the rate of decline slowed with the composite index rising from a 4-month low in March of 41.9 to 44.2 in April, its highest reading this year. Both manufacturing and services posted 4-month highs with the former at 44.4 and the latter at 44.1. Elsewhere, China’s flash manufacturing PMI grew at a slower rate. The flash reading was 50.5, down from the final March reading of 51.6. And in the US, the flash manufacturing reading eased to 52.0 from 54.9.
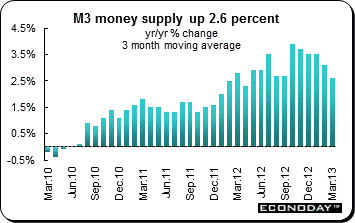 March M3 money supply growth slowed to 2.6 percent on the year from February's unrevised 3.1 percent — its weakest rate since April 2012. As a result, the ECB's preferred 3-month moving average measure decelerated by 0.4 percentage points to 3.0 percent. Private sector bank lending contracted at a 0.8 percent annual pace, unchanged from mid-quarter. Within this, borrowing by households eased 0.1 percentage points to 0.4 percent rate with lending for house purchase also a tick weaker at 1.3 percent. Loans to non-financial corporations were 2.4 percent beneath their March 2012 level after a 2.5 percent contraction last time and growth of lending to non-monetary financial intermediaries (excluding insurance companies and pension funds) accelerated by 0.7 percentage points to a 0.1 percent annual rate. March M3 money supply growth slowed to 2.6 percent on the year from February's unrevised 3.1 percent — its weakest rate since April 2012. As a result, the ECB's preferred 3-month moving average measure decelerated by 0.4 percentage points to 3.0 percent. Private sector bank lending contracted at a 0.8 percent annual pace, unchanged from mid-quarter. Within this, borrowing by households eased 0.1 percentage points to 0.4 percent rate with lending for house purchase also a tick weaker at 1.3 percent. Loans to non-financial corporations were 2.4 percent beneath their March 2012 level after a 2.5 percent contraction last time and growth of lending to non-monetary financial intermediaries (excluding insurance companies and pension funds) accelerated by 0.7 percentage points to a 0.1 percent annual rate.
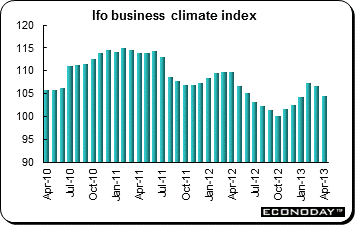 April Ifo business climate index dropped more than 2 points to 104.4, its lowest level so far this year and its steepest decline since May 2012. The second consecutive monthly decline was attributable to a 2.7 point slide in the current conditions component to 107.2 — its weakest reading since December — and a 2 point dip in expectations to 101.6, a 3-month low. Sentiment worsened in all of the main sectors and so was consistent with the deteriorating conditions described in both the flash April manufacturing and service PMIs. April Ifo business climate index dropped more than 2 points to 104.4, its lowest level so far this year and its steepest decline since May 2012. The second consecutive monthly decline was attributable to a 2.7 point slide in the current conditions component to 107.2 — its weakest reading since December — and a 2 point dip in expectations to 101.6, a 3-month low. Sentiment worsened in all of the main sectors and so was consistent with the deteriorating conditions described in both the flash April manufacturing and service PMIs.
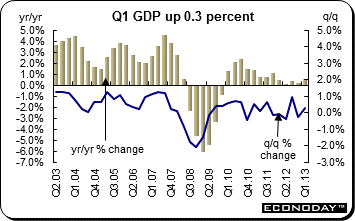 First quarter provisional gross domestic product expanded 0.3 percent from the previous period and 0.6 percent from a year ago. This follows an unrevised 0.3 percent quarterly contraction at the end of 2012 and means that the UK economy avoided falling back into technical recession. The details provided are limited to the major output sectors. These showed that the pick-up in activity was primarily attributable to a 0.6 percent quarterly advance in services. Within services, the gain was led by a 1.4 percent jump in transport, storage & communications and a 1.1 percent increase in distribution, hotels & catering. Business & financial services grew 0.2 percent and government 0.5 percent. The goods producing sector saw output increase 0.2 percent on the quarter within which the key manufacturing sector declined 0.3 percent. The volatile mining & quarrying category registered a 3.2 percent jump but this only followed a record 10.7 percent slump in the fourth quarter caused by the temporary close of the UK's largest North Sea oil field (Buzzard). Elsewhere, electricity, gas & steam output advanced 0.5 percent while water supply was unchanged. Construction continued to subtract from headline growth, posting a 2.5 percent drop this time. First quarter provisional gross domestic product expanded 0.3 percent from the previous period and 0.6 percent from a year ago. This follows an unrevised 0.3 percent quarterly contraction at the end of 2012 and means that the UK economy avoided falling back into technical recession. The details provided are limited to the major output sectors. These showed that the pick-up in activity was primarily attributable to a 0.6 percent quarterly advance in services. Within services, the gain was led by a 1.4 percent jump in transport, storage & communications and a 1.1 percent increase in distribution, hotels & catering. Business & financial services grew 0.2 percent and government 0.5 percent. The goods producing sector saw output increase 0.2 percent on the quarter within which the key manufacturing sector declined 0.3 percent. The volatile mining & quarrying category registered a 3.2 percent jump but this only followed a record 10.7 percent slump in the fourth quarter caused by the temporary close of the UK's largest North Sea oil field (Buzzard). Elsewhere, electricity, gas & steam output advanced 0.5 percent while water supply was unchanged. Construction continued to subtract from headline growth, posting a 2.5 percent drop this time.
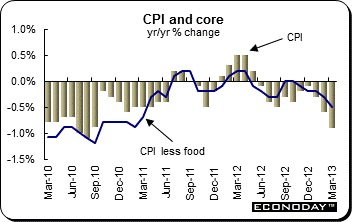 March unadjusted consumer price index was up 0.2 percent on the month but dropped 0.9 percent on the year as the pace of deflation picked up for the third month in 2013. The key core CPI that excludes only fresh food was up 0.3 percent and was down 0.5 percent on the year. The pace of decline also accelerated for the core. Excluding food and energy, the CPI was up 0.4 percent but down 0.8 percent from March 2012. Most component prices declined in March when compared with a year ago with the exception of energy – it was up 2.2 percent after increasing 5.0 percent in February. Televisions however, dropped 18.7 percent after plunging 28.9 percent the month before. Recreational durable goods slid 13.4 percent after retreating 20.3 percent. March unadjusted consumer price index was up 0.2 percent on the month but dropped 0.9 percent on the year as the pace of deflation picked up for the third month in 2013. The key core CPI that excludes only fresh food was up 0.3 percent and was down 0.5 percent on the year. The pace of decline also accelerated for the core. Excluding food and energy, the CPI was up 0.4 percent but down 0.8 percent from March 2012. Most component prices declined in March when compared with a year ago with the exception of energy – it was up 2.2 percent after increasing 5.0 percent in February. Televisions however, dropped 18.7 percent after plunging 28.9 percent the month before. Recreational durable goods slid 13.4 percent after retreating 20.3 percent.
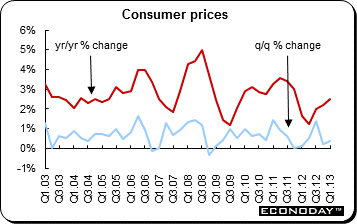 March quarter consumer price index was up 0.4 percent on the quarter after increasing 0.2 percent in the December 2012 quarter. On the year, the CPI was up 2.5 percent after climbing 2.2 percent in the previous quarter. The most significant price increases in the March quarter were for new dwelling purchase by owner occupiers (up 1.7 percent), pharmaceutical products (up 7.6 percent), tertiary education (up 6.5 percent) and tobacco (up 3.7 percent). The most significant offsetting price declines were for international holiday travel & accommodation (down 5.2 percent), furniture (down 6.8 percent) and fruit (down 7.0 percent). The Reserve Bank of Australia uses two analytical measures for policy purposes to measure the underlying trend. The trimmed mean was up 0.3 percent and 2.2 percent from a year ago while the weighted mean was 0.5 percent higher on the quarter and 2.6 percent on the year. The RBA has an inflation target range of two percent to three percent. March quarter consumer price index was up 0.4 percent on the quarter after increasing 0.2 percent in the December 2012 quarter. On the year, the CPI was up 2.5 percent after climbing 2.2 percent in the previous quarter. The most significant price increases in the March quarter were for new dwelling purchase by owner occupiers (up 1.7 percent), pharmaceutical products (up 7.6 percent), tertiary education (up 6.5 percent) and tobacco (up 3.7 percent). The most significant offsetting price declines were for international holiday travel & accommodation (down 5.2 percent), furniture (down 6.8 percent) and fruit (down 7.0 percent). The Reserve Bank of Australia uses two analytical measures for policy purposes to measure the underlying trend. The trimmed mean was up 0.3 percent and 2.2 percent from a year ago while the weighted mean was 0.5 percent higher on the quarter and 2.6 percent on the year. The RBA has an inflation target range of two percent to three percent.
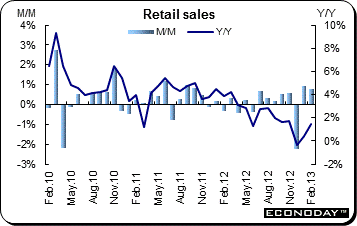 February retail sales were up 0.8 percent after increasing 0.9 percent in January. However, after removing the effects of price changes and in particular higher gasoline prices, volumes were flat for a second month. Analysts expected an increase of 0.3 percent on the month. Sales were in positive territory when compared with a year ago, up 1.5 percent. Seven of 11 subsectors representing 82 percent of total sales advanced on the month. The largest gain in nominal terms was a 2.8 percent increase at general merchandise stores. Higher sales in the "other general merchandise stores" industry accounted for most of the gain, increasing 4.4 percent while department store sales rose 0.8 percent. Following three straight monthly declines, gasoline station sales increased 1.9 percent thanks to higher prices. Motor vehicle & parts dealers were up for a second consecutive month gaining 1.0 percent in February. New car dealer sales (up 2.0 percent) more than offset declines at other motor vehicle dealers (down 7.3 percent) and used car dealers (down 2.3 percent). Following flat sales in January, electronics & appliance store sales were 1.3 percent higher in February. Food & beverage store sales edged up 0.1 percent. However, sales at furniture & home furnishings stores slid 2.9 percent. Clothing & clothing accessories stores declined 0.6 percent. February retail sales were up 0.8 percent after increasing 0.9 percent in January. However, after removing the effects of price changes and in particular higher gasoline prices, volumes were flat for a second month. Analysts expected an increase of 0.3 percent on the month. Sales were in positive territory when compared with a year ago, up 1.5 percent. Seven of 11 subsectors representing 82 percent of total sales advanced on the month. The largest gain in nominal terms was a 2.8 percent increase at general merchandise stores. Higher sales in the "other general merchandise stores" industry accounted for most of the gain, increasing 4.4 percent while department store sales rose 0.8 percent. Following three straight monthly declines, gasoline station sales increased 1.9 percent thanks to higher prices. Motor vehicle & parts dealers were up for a second consecutive month gaining 1.0 percent in February. New car dealer sales (up 2.0 percent) more than offset declines at other motor vehicle dealers (down 7.3 percent) and used car dealers (down 2.3 percent). Following flat sales in January, electronics & appliance store sales were 1.3 percent higher in February. Food & beverage store sales edged up 0.1 percent. However, sales at furniture & home furnishings stores slid 2.9 percent. Clothing & clothing accessories stores declined 0.6 percent.
Earnings and economic data boosted equities last week. Both the Reserve Bank of New Zealand and the Bank of Japan left their policy interest rates unchanged as expected. The Bank of Japan extended the period in which it expects to reach its target of 2.0 percent inflation into 2016. Economic data were mixed but investors now expect extended stimulus from central banks.
The European Central Bank meets Thursday amid expectations that the ECB will finally respond to the dire economic conditions spreading across the Eurozone. In the U.S., the FOMC will meet. An avalanche of new economic data is expected for investors to absorb. Meanwhile, earnings season continues.
| Central Bank activities |
|
| April 30, May 1 |
United States |
FOMC Meeting |
| May 2 |
Eurozone |
European Central Bank Monetary Policy Meeting |
| |
|
|
| The following indicators will be released this week... |
| Europe |
|
|
| April 29 |
Eurozone |
Business and Consumer Sentiment (April) |
|
Germany |
Retail Sales (March) |
| April 30 |
Eurozone |
Harmonized Index of Consumer Prices (April, flash) |
|
|
Unemployment Rate (March) |
|
Germany |
Unemployment Rate (April) |
|
France |
Consumption of Manufactured Goods (March) |
|
|
Producer Price Index (March) |
| May 1 |
UK |
PMI Manufacturing (April) |
| May 2 |
Eurozone |
PMI Manufacturing (April) |
|
Germany |
PMI Manufacturing (April) |
|
France |
PMI Manufacturing (April) |
| May 3 |
UK |
PMI Services (April) |
| |
|
|
| Asia |
|
|
| April 30 |
Japan |
Household Spending (March) |
|
|
Unemployment (March) |
|
|
Retail Sales (March) |
|
|
Industrial Production (March) |
|
China |
PMI Manufacturing (April) |
| May 3 |
Australia |
Producer Price Index Q1.2013) |
| |
|
|
| Americas |
|
|
| April 30 |
Canada |
Monthly Gross Domestic Product (February) |
|
|
Industrial Product Price Index (March) |
| May 2 |
Canada |
International Trade (March) |
Anne D Picker is the author of International Economic Indicators and Central Banks.
|
