|
Global markets were mixed in the holiday shortened week. Only the Shanghai Composite was lower in the Asia Pacific region while in Europe, the CAC, DAX, MIB and IBEX succumbed to concerns about the situations in Cyprus and Italy. In North America, the S&P/TSX slipped. March was a tough month in Australia and China while Japan rallied. In Europe, stocks in Italy and Spain declined in March and were down in the first quarter as well. U.S. equities advanced for the week, month and quarter.
It was a climatic week as Cyprus agreed to a bailout package with the troika — the European Central Bank, European Union and the International Monetary Fund. Cypriot banks opened Thursday for the first time since March 6th after the government imposed strict capital controls to avoid a bank run, limiting withdrawals to €300 in cash a day. The opening was orderly with little sign of the expected rush to remove deposits. Cyprus obtained a €10 billion bailout after the island agreed to shut down its second largest lender and impose losses on uninsured deposits of more than €100,000. The deal replaced a previous demand to impose a levy on all bank accounts.
Italy was also in the spotlight, as Democratic Party leader Pier Luigi Bersani told President Giorgio Napolitano that he cannot form a government. Week long talks between Bersani and other political leaders finally ended in deadlock and it now looks like President Napolitano will have to try to construct a temporary technocrat government to manage daily affairs ahead of new elections, most probably in September. In the meantime, key reform measures will be put on hold. Bersani won a majority in the lower house of Italy’s parliament last month and needs additional support in the Senate to form a government.
|
|
2012 |
2013 |
% Change |
|
Index |
31-Dec |
March 22 |
March 29 |
Week |
March |
Q1 |
Year |
| Asia/Pacific |
|
|
|
|
|
|
|
|
| Australia |
All Ordinaries |
4664.6 |
4980.8 |
4979.9 |
0.0% |
-2.7% |
6.8% |
6.8% |
| Japan |
Nikkei 225 |
10395.2 |
12338.5 |
12397.9 |
0.5% |
7.3% |
19.3% |
19.3% |
| Hong Kong |
Hang Seng |
22656.9 |
22115.3 |
22299.6 |
0.8% |
-3.1% |
-1.6% |
-1.6% |
| S. Korea |
Kospi |
1997.1 |
1948.7 |
2004.9 |
2.9% |
-1.1% |
0.4% |
0.4% |
| Singapore |
STI |
3167.1 |
3258.6 |
3308.1 |
1.5% |
1.2% |
4.5% |
4.5% |
| China |
Shanghai Composite |
2269.1 |
2328.3 |
2236.6 |
-3.9% |
-5.5% |
-1.4% |
-1.4% |
|
|
|
|
|
|
|
|
|
| India |
Sensex 30 |
19426.7 |
18735.6 |
18835.8 |
0.5% |
-0.1% |
-3.0% |
-3.0% |
| Indonesia |
Jakarta Composite |
4316.7 |
4723.2 |
4941.0 |
4.6% |
3.0% |
14.5% |
14.5% |
| Malaysia |
KLCI |
1689.0 |
1626.9 |
1671.6 |
2.8% |
2.1% |
-1.0% |
-1.0% |
| Philippines |
PSEi |
5812.7 |
6518.7 |
6847.5 |
5.0% |
1.9% |
17.8% |
17.8% |
| Taiwan |
Taiex |
7699.5 |
7796.2 |
7918.6 |
1.6% |
0.3% |
2.8% |
2.8% |
| Thailand |
SET |
1391.9 |
1479.0 |
1561.1 |
5.6% |
1.3% |
12.2% |
12.2% |
|
|
|
|
|
|
|
|
|
| Europe |
|
|
|
|
|
|
|
|
| UK |
FTSE 100 |
5897.8 |
6392.8 |
6411.7 |
0.3% |
0.8% |
8.7% |
8.7% |
| France |
CAC |
3641.1 |
3770.3 |
3731.4 |
-1.0% |
0.2% |
2.5% |
2.5% |
| Germany |
XETRA DAX |
7612.4 |
7911.4 |
7795.3 |
-1.5% |
0.7% |
2.4% |
2.4% |
| Italy |
FTSE MIB |
16273.4 |
16045.5 |
15338.7 |
-4.4% |
-3.7% |
-5.7% |
-5.7% |
| Spain |
IBEX 35 |
8167.5 |
8329.5 |
7920.0 |
-4.9% |
-3.8% |
-3.0% |
-3.0% |
| Sweden |
OMX Stockholm 30 |
1104.7 |
1196.4 |
1201.2 |
0.4% |
0.1% |
8.7% |
8.7% |
| Switzerland |
SMI |
6822.4 |
7744.3 |
7813.7 |
0.9% |
2.9% |
14.5% |
14.5% |
|
|
|
|
|
|
|
|
|
| North America |
|
|
|
|
|
|
|
|
| United States |
Dow |
13104.1 |
14512.0 |
14578.5 |
0.5% |
3.7% |
11.3% |
11.3% |
|
NASDAQ |
3019.5 |
3245.0 |
3267.5 |
0.7% |
3.4% |
8.2% |
8.2% |
|
S&P 500 |
1426.2 |
1556.9 |
1569.2 |
0.8% |
3.6% |
10.0% |
10.0% |
| Canada |
S&P/TSX Comp. |
12433.5 |
12757.4 |
12749.9 |
-0.1% |
-0.6% |
2.5% |
2.5% |
| Mexico |
Bolsa |
43705.8 |
42686.7 |
44077.1 |
3.3% |
-0.1% |
0.8% |
0.8% |
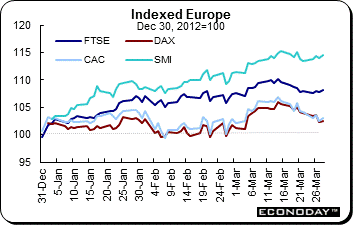 Equities in Europe were mostly mixed in the holiday shortened week as investors remained risk averse thanks to uncertainty about Cyprus and the political deadlock in Italy. The uncertainties overshadowed better than estimated U.S. economic data. The problems in Cyprus and Italy also weighed on readings for the month and quarter. The FTSE and SMI were up for the week, month and quarter — the FTSE was up 0.3 percent on the week, 0.8 percent in March and 8.7 percent in the first quarter. The SMI advanced 0.9 percent, 2.9 percent and 14.5 percent respectively. The CAC and DAX retreated 1.0 percent and 1.5 percent on the week but were up 0.2 percent and 0.7 percent in March and gained 2.5 percent and 2.4 percent in the first quarter. Equities in Europe were mostly mixed in the holiday shortened week as investors remained risk averse thanks to uncertainty about Cyprus and the political deadlock in Italy. The uncertainties overshadowed better than estimated U.S. economic data. The problems in Cyprus and Italy also weighed on readings for the month and quarter. The FTSE and SMI were up for the week, month and quarter — the FTSE was up 0.3 percent on the week, 0.8 percent in March and 8.7 percent in the first quarter. The SMI advanced 0.9 percent, 2.9 percent and 14.5 percent respectively. The CAC and DAX retreated 1.0 percent and 1.5 percent on the week but were up 0.2 percent and 0.7 percent in March and gained 2.5 percent and 2.4 percent in the first quarter.
Economic data continued to be bleak. Fourth quarter French and UK GDP both contracted 0.3 percent from the previous quarter while German unemployment surprised with an increase although the unemployment rate remained at 6.9 percent for the sixth month. However, German retail sales unexpectedly climbed in February. Even before the escalation in Cyprus debt crisis, Eurozone economic confidence deteriorated in March, putting on hold the recovery that had started in November last year. The relapse was driven by declines in all business sectors while consumer confidence remained broadly stable.
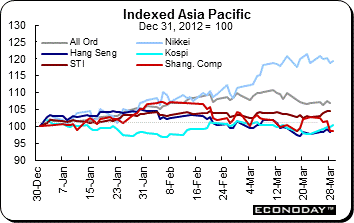 Even though worries about the European debt crisis weighed on investors, indexes here — with the exception of the Shanghai Composite — advanced on the week. Equities responded to upbeat news from the U.S. including positive economic data and market performance which in turn, helped mitigate losses. Even though worries about the European debt crisis weighed on investors, indexes here — with the exception of the Shanghai Composite — advanced on the week. Equities responded to upbeat news from the U.S. including positive economic data and market performance which in turn, helped mitigate losses.
However, both monthly and quarterly results were decidedly mixed. The Nikkei was the star performer. The index was up 0.5 percent on the week, 7.3 percent in March and 19.3 percent for the quarter. Equities in Japan were bolstered by the anticipated easing by the new leadership of the Bank of Japan when they meet on April 3rd and 4th. Concerns about Cyprus continued to cloud investor sentiment, the Italian political impasse and weak Eurozone data added to worries about the region's debt crisis.
The Shanghai Composite dropped 3.9 percent on the week, dragged down by banks after China's banking regulator ordered banks to strengthen checks on wealth management products to increase transparency and ward off potential risks to the financial system. The index slid 5.5 percent in March and was down 1.4 percent in the first quarter.
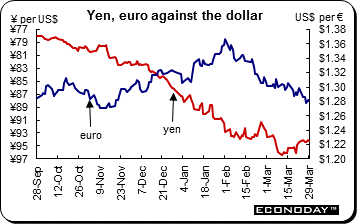 The U.S. dollar advanced against most of its major counterparts last week including the euro, pound, Swiss franc and Australian dollar. It slipped against the Canadian dollar and yen. The U.S. dollar advanced against most of its major counterparts last week including the euro, pound, Swiss franc and Australian dollar. It slipped against the Canadian dollar and yen.
The yen, which has been declining in anticipation of a stimulus boost by Bank of Japan and new Governor Haruhiko Kuroda at their upcoming meeting. The Japanese currency which has been declining against the dollar this quarter as Kuroda pledged action to achieve the BoJ’s 2.0 percent annual inflation target. However, data on Friday indicated that it will be a tough job — February consumer prices slid at the fastest pace in 2 1/2 years. In his testimony to parliament last week, Kuroda said that he wants to achieve the Bank’s price target in two years. Analysts expect that BoJ policies may become aggressive and experimental under Kuroda.
The euro suffered the brunt of the Cyprus and Italian uncertainty. In Italy, President Giorgio Napolitano took charge of the search for the next prime minister after Pier Luigi Bersani was unable to assemble a majority in the divided parliament. The euro rallied after Cyprus averted panic withdrawals as banks opened for the first time in almost two weeks with government controls on access to cash leading to orderly lines rather than runs on deposits.
|
|
2012 |
2013 |
% Change |
|
|
Dec 31 |
Mar 22 |
Mar 29 |
Week |
2013 |
| U.S. $ per currency |
|
|
|
|
|
|
| Australia |
A$ |
1.040 |
1.045 |
1.042 |
-0.3% |
0.2% |
| New Zealand |
NZ$ |
0.829 |
0.836 |
0.837 |
0.2% |
1.0% |
| Canada |
C$ |
1.007 |
0.977 |
0.983 |
0.6% |
-2.4% |
| Eurozone |
euro (€) |
1.319 |
1.299 |
1.282 |
-1.3% |
-2.8% |
| UK |
pound sterling (£) |
1.623 |
1.524 |
1.520 |
-0.3% |
-6.4% |
|
|
|
|
|
|
|
| Currency per U.S. $ |
|
|
|
|
|
|
| China |
yuan |
6.231 |
6.212 |
6.210 |
0.0% |
0.3% |
| Hong Kong |
HK$* |
7.750 |
7.764 |
7.764 |
0.0% |
-0.2% |
| India |
rupee |
54.995 |
54.341 |
54.280 |
0.1% |
1.3% |
| Japan |
yen |
86.750 |
94.450 |
94.220 |
0.2% |
-7.9% |
| Malaysia |
ringgit |
3.058 |
3.112 |
3.094 |
0.6% |
-1.2% |
| Singapore |
Singapore $ |
1.222 |
1.248 |
1.240 |
0.7% |
-1.5% |
| South Korea |
won |
1064.400 |
1119.280 |
1111.350 |
0.7% |
-4.2% |
| Taiwan |
Taiwan $ |
29.033 |
29.887 |
29.825 |
0.2% |
-2.7% |
| Thailand |
baht |
30.580 |
29.290 |
29.260 |
0.1% |
4.5% |
| Switzerland |
Swiss franc |
0.916 |
0.941 |
0.949 |
-0.9% |
-3.5% |
| *Pegged to U.S. dollar |
|
|
|
|
|
|
| Source: Bloomberg |
|
|
|
|
|
|
 March economic sentiment declined to 90 from 91.1 in the previous month. The decline was driven by decreases in all business sectors, while consumer confidence remained broadly stable. Industrial confidence declined by 1.2 points to minus 12.5, due to a much more negative assessment of the current level of overall order books and a slightly weaker view of stocks of finished products. Services confidence halted its upward trend observed since October 2012. The corresponding indicator dropped to minus 6.7 from minus 5.3. Driven by a worsened assessment of all the three sub-components, confidence among retailers deteriorated to minus 17.6 from minus 16.1. Consumer confidence remained broadly stable at minus 23.5. Consumers were less pessimistic regarding their unemployment expectations but slightly more pessimistic regarding their savings expectations over the next 12 months. March economic sentiment declined to 90 from 91.1 in the previous month. The decline was driven by decreases in all business sectors, while consumer confidence remained broadly stable. Industrial confidence declined by 1.2 points to minus 12.5, due to a much more negative assessment of the current level of overall order books and a slightly weaker view of stocks of finished products. Services confidence halted its upward trend observed since October 2012. The corresponding indicator dropped to minus 6.7 from minus 5.3. Driven by a worsened assessment of all the three sub-components, confidence among retailers deteriorated to minus 17.6 from minus 16.1. Consumer confidence remained broadly stable at minus 23.5. Consumers were less pessimistic regarding their unemployment expectations but slightly more pessimistic regarding their savings expectations over the next 12 months.
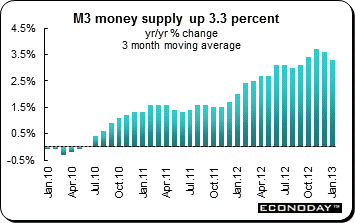 February M3 money supply was up 3.1 percent from a year ago after increasing 3.5 percent the month before. The three month moving average — the measure preferred by the ECB — slowed to 3.3 percent from 3.6 percent. The key private sector lending component posted a 12-month contraction of 0.9 percent, unchanged from January. Annual growth of household borrowing was unchanged at 0.5 percent. Within this, loans for house purchase, the most important component of household loans, stood at 1.4 percent and unchanged from the previous month. Borrowing by non-financial corporations was down 2.6 percent in February compared with a 2.5 percent decline in January. Lending to non-monetary financial intermediaries (excluding insurance corporations and pension funds) was down 0.5 percent. February M3 money supply was up 3.1 percent from a year ago after increasing 3.5 percent the month before. The three month moving average — the measure preferred by the ECB — slowed to 3.3 percent from 3.6 percent. The key private sector lending component posted a 12-month contraction of 0.9 percent, unchanged from January. Annual growth of household borrowing was unchanged at 0.5 percent. Within this, loans for house purchase, the most important component of household loans, stood at 1.4 percent and unchanged from the previous month. Borrowing by non-financial corporations was down 2.6 percent in February compared with a 2.5 percent decline in January. Lending to non-monetary financial intermediaries (excluding insurance corporations and pension funds) was down 0.5 percent.
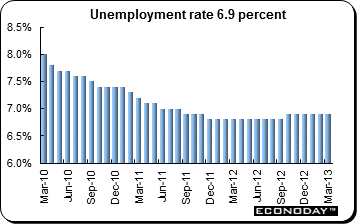 March unemployment increased 13,000 to 2.94 million. The jobless rate remained near a post-unification low, at a seasonally adjusted 6.9 percent in March where it been since October 2012. Earlier, the Federal Statistical Office said that the unemployment rate, as measured by the International Labor Organization, remained unchanged at 5.4 percent in February. The number of unemployed persons remained broadly unchanged at around 2.3 million. March unemployment increased 13,000 to 2.94 million. The jobless rate remained near a post-unification low, at a seasonally adjusted 6.9 percent in March where it been since October 2012. Earlier, the Federal Statistical Office said that the unemployment rate, as measured by the International Labor Organization, remained unchanged at 5.4 percent in February. The number of unemployed persons remained broadly unchanged at around 2.3 million.
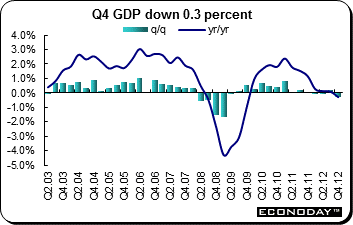 Fourth quarter gross domestic product contracted 0.3 percent on the quarter as expected. On the year, GDP also was down 0.3 percent. For the year 2012, GDP was flat after growing 1.7 percent in 2011. Households' consumption expenditure remained sluggish in the fourth quarter, down 0.1 percent. Gross fixed capital formation declined 0.8 percent after easing 0.4 percent a quarter ago. Exports were down 0.6 percent while imports dropped 1.2 percent. As a result, foreign trade balance contributed positively again to GDP growth. On the contrary, changes in inventories continued to weigh down on GDP growth in the fourth quarter. Fourth quarter gross domestic product contracted 0.3 percent on the quarter as expected. On the year, GDP also was down 0.3 percent. For the year 2012, GDP was flat after growing 1.7 percent in 2011. Households' consumption expenditure remained sluggish in the fourth quarter, down 0.1 percent. Gross fixed capital formation declined 0.8 percent after easing 0.4 percent a quarter ago. Exports were down 0.6 percent while imports dropped 1.2 percent. As a result, foreign trade balance contributed positively again to GDP growth. On the contrary, changes in inventories continued to weigh down on GDP growth in the fourth quarter.
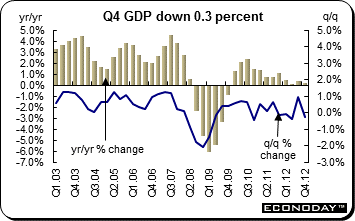 Final estimate of fourth quarter gross domestic product was unrevised at a contraction of 0.3 percent on the quarter and a 0.2 percent decline from a year ago. The contraction follows 0.9 percent growth in the third quarter and a 0.4 percent drop in the second quarter. The fall back effect from the Olympic and Paralympic Games combined with reduced North Sea oil output and weak underlying domestic demand sent the fourth quarter into contraction. Output of the production industries declined 2.1 percent, and that of mining and quarrying output plunged 10.7 percent. Manufacturing output was down 1.4 percent. A more positive development was the growth of 0.8 percent in the construction industry. Services, which grew by 1.2 percent in the third quarter for the highest rate in five years, saw no growth in the fourth quarter. Final estimate of fourth quarter gross domestic product was unrevised at a contraction of 0.3 percent on the quarter and a 0.2 percent decline from a year ago. The contraction follows 0.9 percent growth in the third quarter and a 0.4 percent drop in the second quarter. The fall back effect from the Olympic and Paralympic Games combined with reduced North Sea oil output and weak underlying domestic demand sent the fourth quarter into contraction. Output of the production industries declined 2.1 percent, and that of mining and quarrying output plunged 10.7 percent. Manufacturing output was down 1.4 percent. A more positive development was the growth of 0.8 percent in the construction industry. Services, which grew by 1.2 percent in the third quarter for the highest rate in five years, saw no growth in the fourth quarter.
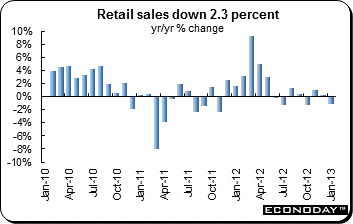 February retail sales dropped 2.3 percent from a year ago after falling 1.1 percent in January. Most major categories declined. Auto sales dropped 10.3 percent after sliding 11.0 percent the month before. Retail machinery sales declined 4.0 percent after dropping 4.4 percent. Other categories that retreated included general merchandise, fabrics, apparel & accessories and food & beverage. Fuel sales were up 1.8 percent. Analysts will be looking at household spending to see just how weak consumption is in the run-up to the Bank of Japan meeting next week amid market expectations for a hefty dose of quantitative easing. February retail sales dropped 2.3 percent from a year ago after falling 1.1 percent in January. Most major categories declined. Auto sales dropped 10.3 percent after sliding 11.0 percent the month before. Retail machinery sales declined 4.0 percent after dropping 4.4 percent. Other categories that retreated included general merchandise, fabrics, apparel & accessories and food & beverage. Fuel sales were up 1.8 percent. Analysts will be looking at household spending to see just how weak consumption is in the run-up to the Bank of Japan meeting next week amid market expectations for a hefty dose of quantitative easing.
 February consumer price index was down 0.1 percent on the month and 0.7 percent from a year ago. Less fresh food, the CPI was unchanged on the month and down 0.3 percent on the year. Excluding food and energy, the index was unchanged and dropped 0.9 percent. Energy costs were up 5.0 percent on the year in February after increasing 3.9 percent the month before. The core CPI excluding fresh food was down because of depressed prices of TVs and air conditioners and heaters. The Bank of Japan has promised to conduct more aggressive monetary easing under its new governor. Many in the market expect the BoJ to struggle as the government also needs to work out feasible growth strategies in order to boost inflation expectations among households and businesses. February consumer price index was down 0.1 percent on the month and 0.7 percent from a year ago. Less fresh food, the CPI was unchanged on the month and down 0.3 percent on the year. Excluding food and energy, the index was unchanged and dropped 0.9 percent. Energy costs were up 5.0 percent on the year in February after increasing 3.9 percent the month before. The core CPI excluding fresh food was down because of depressed prices of TVs and air conditioners and heaters. The Bank of Japan has promised to conduct more aggressive monetary easing under its new governor. Many in the market expect the BoJ to struggle as the government also needs to work out feasible growth strategies in order to boost inflation expectations among households and businesses.
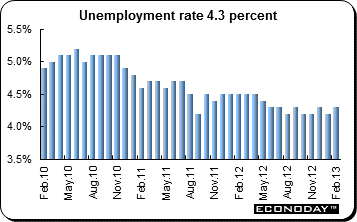 The unemployment rate edged up to 4.3 percent from 4.2 percent the month before. Employment increased for a second month and was up 160,000 from a year ago. In February, the number of payroll jobs rose 90,000 from the previous month to a seasonally adjusted 62.98 million, the adjusted number of unemployed was up 1.8 percent to 2.84 million from 2.79 million in January. Medical, health care and welfare services continued to hire workers and construction added jobs. However, factory, retail and transport jobs continued to decline. The unemployment rate edged up to 4.3 percent from 4.2 percent the month before. Employment increased for a second month and was up 160,000 from a year ago. In February, the number of payroll jobs rose 90,000 from the previous month to a seasonally adjusted 62.98 million, the adjusted number of unemployed was up 1.8 percent to 2.84 million from 2.79 million in January. Medical, health care and welfare services continued to hire workers and construction added jobs. However, factory, retail and transport jobs continued to decline.
 February household spending was up 0.8 percent from a year ago. Spending on transportation & communication jumped 11.4 percent while housing slumped 11.1 percent. Spending on medical care was down 8.3 percent from a year ago. Other categories that declined included fuel, light & water charges and furniture & household utensils. Spending increased for culture & recreation (up 3.5 percent), education (up 4.8 percent) and clothing & footwear (up 3.8 percent). The average of monthly consumption expenditures per household for February 2013 was ¥268,099. February household spending was up 0.8 percent from a year ago. Spending on transportation & communication jumped 11.4 percent while housing slumped 11.1 percent. Spending on medical care was down 8.3 percent from a year ago. Other categories that declined included fuel, light & water charges and furniture & household utensils. Spending increased for culture & recreation (up 3.5 percent), education (up 4.8 percent) and clothing & footwear (up 3.8 percent). The average of monthly consumption expenditures per household for February 2013 was ¥268,099.
 February industrial output slipped 0.1 percent on the month and was down 5.7 percent on the year. This was the first monthly decline in three months. Output was hit by a downturn in production of electronics devices, such as memory chips used for smartphones, reflecting slower demand in Asia. But the report showed an upturn in the forecast for the coming two months, underscoring that the economy has already moved out of a brief slump caused by the global slowdown and aggravated by weaker demand from China when the territorial dispute over the East China Islands flared up. METI's latest survey of factory operators showed that industrial production is projected to rise 1.0 percent on the month in March and climb a further 0.6% percent in April led by a recovery in demand for electronics and general machinery. February industrial output slipped 0.1 percent on the month and was down 5.7 percent on the year. This was the first monthly decline in three months. Output was hit by a downturn in production of electronics devices, such as memory chips used for smartphones, reflecting slower demand in Asia. But the report showed an upturn in the forecast for the coming two months, underscoring that the economy has already moved out of a brief slump caused by the global slowdown and aggravated by weaker demand from China when the territorial dispute over the East China Islands flared up. METI's latest survey of factory operators showed that industrial production is projected to rise 1.0 percent on the month in March and climb a further 0.6% percent in April led by a recovery in demand for electronics and general machinery.
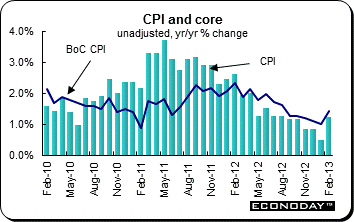 February consumer price index jumped 1.2 percent on the month and from a year ago. Core CPI excluding food and energy was up 0.9 percent and 1.1 percent while the Bank of Canada’s core which excludes eight volatile items was up 0.8 percent and 1.4 percent. Seasonally adjusted CPI was up 0.7 percent for the steepest monthly gain since June 2008. Excluding food and energy, the index was up 0.3 percent while the Bank of Canada measure was 0.4 percent higher. Within the overall adjusted basket the main area of strength was transportation which, with a 2.4 percent spurt, dominated the headline increase. Elsewhere, the cost of food climbed 0.9 percent as did clothing & footwear while alcohol & tobacco advanced 0.4 percent ahead of household operations, furnishings & equipment at 0.3 percent. In contrast, shelter charges were up just 0.1 percent. February consumer price index jumped 1.2 percent on the month and from a year ago. Core CPI excluding food and energy was up 0.9 percent and 1.1 percent while the Bank of Canada’s core which excludes eight volatile items was up 0.8 percent and 1.4 percent. Seasonally adjusted CPI was up 0.7 percent for the steepest monthly gain since June 2008. Excluding food and energy, the index was up 0.3 percent while the Bank of Canada measure was 0.4 percent higher. Within the overall adjusted basket the main area of strength was transportation which, with a 2.4 percent spurt, dominated the headline increase. Elsewhere, the cost of food climbed 0.9 percent as did clothing & footwear while alcohol & tobacco advanced 0.4 percent ahead of household operations, furnishings & equipment at 0.3 percent. In contrast, shelter charges were up just 0.1 percent.
Front and center last week were the crises in Cyprus and Italy. While Cyprus agreed to a restructured bailout package, the political impasse in Italy remains with no solution in sight.
The Reserve Bank of Australia, Bank of England and European Central Bank announce their respective monetary policy decisions. However, the focus will be on the Bank of Japan and the first announcement from new governor Haruhiko Kuroda. Expectations are high for aggressive moves to finally hoist the economy from its malaise and defeat the over 15 years of deflation. Elsewhere, investors will be monitoring the plethora of purchasing managers’ indexes globally but especially from China, the Eurozone and the U.S. The week draws to an end with the U.S. employment situation report.
| Central Bank activities |
|
| April 2 |
Australia |
Reserve Bank of Australia Monetary Policy Announcement |
| April 3, 4 |
Japan |
Bank of Japan Monetary Policy Announcement |
| April 4 |
UK |
Bank of England Monetary Policy Announcement |
|
Eurozone |
European Central Bank Monetary Policy Announcement |
| |
|
|
| The following indicators will be released this week... |
| Europe |
|
|
| April 2 |
Eurozone |
Unemployment (February) |
|
|
Manufacturing PMI (March) |
|
Germany |
Manufacturing PMI (March) |
|
France |
Manufacturing PMI (March) |
|
Italy |
Manufacturing PMI (March) |
|
UK |
Manufacturing PMI (March) |
| April 4 |
Eurozone |
Producer Price Index (February) |
|
|
Services & Composite PMI (March) |
|
Germany |
Services & Composite PMI (March) |
|
France |
Services & Composite PMI (March) |
|
Italy |
Services & Composite PMI (March) |
|
UK |
Services PMI (March) |
| April 5 |
Eurozone |
Retail Sales (February) |
|
Germany |
Manufacturing Orders (February) |
| |
|
|
| Asia/Pacific |
|
|
| April 1 |
Japan |
Tankan Survey (Q1. 2013) |
|
China |
Manufacturing PMI (March, Markit) |
|
|
Manufacturing PMI (March, CFLP) |
| April 3 |
Australia |
Merchandise Trade Balance (February) |
|
Japan |
Services/Composite PMI (March) |
| April 4 |
Australia |
Retail Sales (February) |
| |
|
|
| Americas |
|
|
| April 5 |
Canada |
International Trade (February) |
|
|
Labour Force Survey (March) |
Anne D Picker is the author of International Economic Indicators and Central Banks.
|
