|
Simply Economics will be taking next week off
Simply Economics will return on Friday, January 4, 2013
Merry Christmas and Happy Holidays
from all of us at Econoday!
Fiscal cliff optimism for a resolution rose and fell during the week. Despite disappointment Thursday night on a House vote that did not occur, optimism about a temporary resolution appears to be outweighing pessimism. Economic news was mostly positive and equities ended the week up notably.
 Equities ended the week with notable gains. Optimism about resolving the fiscal cliff was strongest early in the week but faded somewhat as the week progressed. On Monday, a meeting between President Barack Obama and House Speaker John Boehner was seen as positive, boosting equities. Boehner made a concession, indicating he would allow legislation for income tax rates to rise for individuals making $1 million a year. It was reported that Obama was considering a possible budget concession on Social Security cost-of-living increases. Equities ended the week with notable gains. Optimism about resolving the fiscal cliff was strongest early in the week but faded somewhat as the week progressed. On Monday, a meeting between President Barack Obama and House Speaker John Boehner was seen as positive, boosting equities. Boehner made a concession, indicating he would allow legislation for income tax rates to rise for individuals making $1 million a year. It was reported that Obama was considering a possible budget concession on Social Security cost-of-living increases.
Tuesday, negotiations on the fiscal cliff seemed to be making progress as Obama proposed starting tax rate increases at $400,000 in income instead of $250,000. Stocks rose on the  news. Incidentally, the National Association of Home Builders’ housing market index showed improvement. news. Incidentally, the National Association of Home Builders’ housing market index showed improvement.
At mid-week, equities dipped as fiscal cliff discussions appeared to reverse. House Speaker John Boehner said his chamber would vote on and pass a proposal that Obama had already threatened to veto as it spares many wealthy Americans from tax increases needed to balance the budget. Obama had already agreed to reductions in benefits for senior citizens. On the economic news front, the housing starts report was net positive with a gain in permits offsetting a modest dip in starts after earlier strong gains.
Stocks were up in thin trading Thursday after Republican House Speaker John Boehner pledged to keep working on a solution to the "fiscal cliff" while still criticizing President Barack Obama's approach to budget talks—allegedly not addressing spending cuts. Meanwhile, the economy looked good overall with favorable reports on GDP, existing home sales, Philly Fed, and FHFA home prices.
However, problems with the fiscal cliff arose Thursday night. House Speaker John Boehner had promised a vote on his “Plan B” that would raise taxes on some very high income earners with the income threshold much higher than proposed by President Obama. However, Boehner could not obtain sufficient votes (in a standard pre-vote survey of House members) to pass his proposed legislation and the vote was canceled. On Friday, equities dropped significantly as passage of the legislation would have been seen as one more step in the political posturing leading to a final deal. Equities were down for the day despite healthy reports on personal income and durables orders.
Equities were up this past week. The Dow was up 0.4 percent; the S&P 500, up 1.2 percent; the Nasdaq, up 1.7 percent; the Russell 2000, up 2.9 percent; and the Wilshire 5000, up 1.4 percent.
For the year-to-date, major indexes are up as follows: the Dow, up 8.0 percent; the S&P 500, up 13.7 percent; the Nasdaq, up 16.0 percent; the Russell 2000, up 14.4 percent; and the Wilshire 5000, up 13.9 percent.
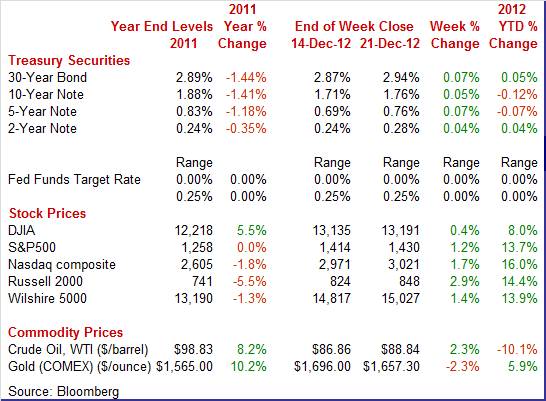
Weekly percent change column reflects percent changes for all components except interest rates. Interest rate changes are reflected in simple differences.
 This past week, changes in optimism and pessimism over fiscal cliff negotiations dominated Treasuries with notable news on economic indicators being largely ignored. Treasury yields rose Monday and Tuesday as optimism prevailed. Rates were little changed Wednesday and Thursday as negotiations between President Obama and House Speaker John Boehner wavered. And yields fell moderately at week’s close after the Speaker cancelled a vote for his “Plan B” that was scheduled for Thursday night. The good news is that optimism for a “soon” solution has not faded (which could be somewhat after the 1st), given the relatively mild swings in rates. This past week, changes in optimism and pessimism over fiscal cliff negotiations dominated Treasuries with notable news on economic indicators being largely ignored. Treasury yields rose Monday and Tuesday as optimism prevailed. Rates were little changed Wednesday and Thursday as negotiations between President Obama and House Speaker John Boehner wavered. And yields fell moderately at week’s close after the Speaker cancelled a vote for his “Plan B” that was scheduled for Thursday night. The good news is that optimism for a “soon” solution has not faded (which could be somewhat after the 1st), given the relatively mild swings in rates.
For this past week Treasury rates were up as follows: 3-month T-bill, up 3 basis points; the 2-year note, up 4 basis points; the 5-year note, up 7 basis points; the 7-year note, up 9 basis points; the 10-year note, up 5 basis points; and the 30-year bond, up 7 basis points.
 As with bond yields, oil prices largely tracked progress or lack of progress in negotiations on resolving the fiscal cliff. The spot price of West Texas Intermediate trended upward the first four days of trading during the week. The most notable movement these days was on Wednesday after the Energy Department reported a drop in crude inventories. Crude rose $1-1/2 per barrel on the day. As with bond yields, oil prices largely tracked progress or lack of progress in negotiations on resolving the fiscal cliff. The spot price of West Texas Intermediate trended upward the first four days of trading during the week. The most notable movement these days was on Wednesday after the Energy Department reported a drop in crude inventories. Crude rose $1-1/2 per barrel on the day.
At week’s end, crude dropped a dollar a barrel on news of the cancelled vote Thursday night on Speaker Boehner’s “Plan B.”
Net for the week, the spot price for West Texas Intermediate gained $1.98 per barrel to settle at $88.84.
Economic news was mostly favorable this past week—especially for housing. Manufacturing is seeing some favorable—though mixed—reports. And overall economic growth for the third quarter was stronger than previously believed.
 For its final estimate for the third quarter, GDP got a notable upgrade. Real GDP growth for the third quarter was revised up to 3.1 percent annualized, compared to the second estimate of 2.7 percent annualized and to the advance estimate of 2.0 percent. Second quarter growth was a meager 1.3 percent. The latest number topped market expectations for a 2.8 percent advance. For its final estimate for the third quarter, GDP got a notable upgrade. Real GDP growth for the third quarter was revised up to 3.1 percent annualized, compared to the second estimate of 2.7 percent annualized and to the advance estimate of 2.0 percent. Second quarter growth was a meager 1.3 percent. The latest number topped market expectations for a 2.8 percent advance.
Demand figures also got a boost. Final sales of domestic product increased 2.4 percent versus the second estimate of 1.9 percent and second quarter growth of 1.7 percent. Final sales to domestic producers (which exclude net exports) were revised to 1.9 percent, compared to the second estimate of 1.7 percent and compared to the prior quarter's 1.4 percent.
By components, the upward revision to GDP was primarily due to higher estimates for personal consumption, nonresidential fixed investment, exports, and government purchases. Imports were bumped down. Cutting into the upward revision were lower estimates for residential investment and inventory investment.
Headline inflation for the GDP price index was left unrevised at an annualized 2.7 percent for the second estimate versus 1.6 percent in the second quarter. But when excluding food and energy, inflation pressure is not nearly as strong with the third quarter figure posting at 1.3 percent, matching the prior estimate of 1.3 percent and compared to the second quarter's 1.4 percent.
The latest revision to GDP puts the economy in a little better position for continuing growth—assuming the fiscal cliff issue is resolved.
 Personal income got some lift in November as businesses in the Northeast re-opened and employees returned to work after Hurricane Sandy. Spending also improved from return to normalcy in the region. Personal income gained 0.6 percent in November, following a 0.1 percent increase in October. Importantly, the wages & salaries component rebounded 0.6 percent in November after decreasing 0.3 percent in October. The Commerce Department earlier indicated that Hurricane Sandy caused a notable part of the loss in private wages and salaries. Personal income got some lift in November as businesses in the Northeast re-opened and employees returned to work after Hurricane Sandy. Spending also improved from return to normalcy in the region. Personal income gained 0.6 percent in November, following a 0.1 percent increase in October. Importantly, the wages & salaries component rebounded 0.6 percent in November after decreasing 0.3 percent in October. The Commerce Department earlier indicated that Hurricane Sandy caused a notable part of the loss in private wages and salaries.
Consumer spending rebounded 0.4 percent after slipping 0.1 percent in October. By components for spending, durables rebounded 2.7 percent, following a 1.1 percent decline the prior month. Nondurables fell 1.0 percent, following a 0.1 percent dip in October. Services jumped 0.5 percent, following a 0.1 percent rise in October.
 Turning to inflation, the headline PCE price index fell 0.2 percent in November after edging up 0.1 percent the month before. Expectations were for a 0.2 percent decrease. The core rate slowed to no change after a 0.1 percent rise in October. The market median forecast was for 0.1 percent increase. Turning to inflation, the headline PCE price index fell 0.2 percent in November after edging up 0.1 percent the month before. Expectations were for a 0.2 percent decrease. The core rate slowed to no change after a 0.1 percent rise in October. The market median forecast was for 0.1 percent increase.
Year-on-year, headline prices were up 1.4 percent in November compared to 1.7 percent in October. The core was up 1.5 percent, following 1.6 percent in October.
Looking ahead to how fourth quarter GDP is shaping up, consumer spending is looking like it will make a decent contribution. Real personal spending rebounded 0.6 percent in November, following a 0.2 percent dip the prior month.
The good news is that the economy is improving at the consumer level despite sentiment issues and that inflation is subdued, leaving the Fed room to keep policy very loose.
 The consumer is spending, but nonetheless, the consumer is increasingly worried about the economic outlook—especially regarding the looming fiscal cliff. Consumer sentiment was down nearly 10 points in December to 72.9 versus November's final reading of 82.7. A look at the two-week breakdowns points to an even lower 70s reading in the second half of this month, which is consistent with fiscal-cliff concern as key elected officials continued to posture instead of working towards compromise. The consumer is spending, but nonetheless, the consumer is increasingly worried about the economic outlook—especially regarding the looming fiscal cliff. Consumer sentiment was down nearly 10 points in December to 72.9 versus November's final reading of 82.7. A look at the two-week breakdowns points to an even lower 70s reading in the second half of this month, which is consistent with fiscal-cliff concern as key elected officials continued to posture instead of working towards compromise.
Weakness was centered in the expectations index which ended December at 63.8 which was down nearly 15 points from November. A separate reading on the 12-month economic outlook was down an eye-popping 23 points in the month to 74.
 Current conditions were also down but less severely, at 87 for only a 3.7 point loss for the month. Inflation expectations are not an issue right now, at 3.2 percent for the one-year outlook and at 2.9 percent for the five-year outlook. Current conditions were also down but less severely, at 87 for only a 3.7 point loss for the month. Inflation expectations are not an issue right now, at 3.2 percent for the one-year outlook and at 2.9 percent for the five-year outlook.
 Homebuilders slowed the pace of housing starts somewhat in November but this largely was a minor pullback after strong gains the prior two months. And momentum continues to be positive with a boost in housing permits. However, October and September were revised down somewhat. Homebuilders slowed the pace of housing starts somewhat in November but this largely was a minor pullback after strong gains the prior two months. And momentum continues to be positive with a boost in housing permits. However, October and September were revised down somewhat.
Housing starts declined 3.0 percent, following an increase of 5.3 percent in October and a jump of 12.4 percent in September. The November starts pace of 0.861 million units was up 21.6 percent on a year-ago basis.
 October was revised to 0.888 million units from the initial estimate of 0.894 million. September was bumped down to 0.843 million annualized units from the prior estimate of 0.863 units. October was revised to 0.888 million units from the initial estimate of 0.894 million. September was bumped down to 0.843 million annualized units from the prior estimate of 0.863 units.
The latest decrease in starts was led by the single-family component while the multifamily component edged down.
Home builders still are moderately optimistic about future sales as housing permits rose 3.6 percent to an annual pace of 0.899 million units. This followed a 2.5 percent decline in October. The latest permits number is at the highest level since the 0.921 million unit pace set for July 2008.
Despite some monthly volatility, housing is on a moderate uptrend. Recent gains in the NAHB housing market index add to this view.
 Low mortgage rates and gradual improvement in the economy are carrying over to further gains in home sales. Existing home sales surged 5.9 percent in November to a 5.04 million annual rate and followed a 1.5 percent rise in October. Low mortgage rates and gradual improvement in the economy are carrying over to further gains in home sales. Existing home sales surged 5.9 percent in November to a 5.04 million annual rate and followed a 1.5 percent rise in October.
Existing home sales were up 14.5 percent on a year ago basis, compared to 10.2 percent in October.
Hurricane Sandy seems to have had no significant effect on sales where in the Northeast they surged 6.9 percent following a modest decline in October. Sales in the other three regions all showed gains for both November and October as well.
Scarcity of supply is definitely an issue in the housing market, one that is limiting sales but one also that is helping prices. Supply fell sharply, to 4.8 months at the current sales rate from 5.3 months in October which was already a multi-year low. The number of existing homes on the market, at 2.03 million, was the lowest since 2001. The median price, getting a boost from higher priced homes, rose 2.1 percent in the month to $180,600. The year-on-year gain, at 10.1 percent, is in double digits for a second month in a row.
Mortgage rates have been pushed down by Fed purchases of mortgage-backed securities and long-term Treasuries. The 30-year conventional mortgage rate averaged 3.35 percent in November, compared to 3.38 percent the month before.
 October FHFA home prices were up a better than expected 0.5 percent after remaining virtually unchanged in September. On the year, the index was up 5.6 percent after increasing 4.1 percent the month before. October FHFA home prices were up a better than expected 0.5 percent after remaining virtually unchanged in September. On the year, the index was up 5.6 percent after increasing 4.1 percent the month before.
Regionally prices continue to be mixed. For the nine census divisions, seasonally adjusted monthly price changes on the month ranged from minus 1.3 percent in the Middle Atlantic division to plus 2.0 percent in the Pacific division while the 12-month changes ranged from a decline of 0.1 percent in the New England division to a 13.1 percent jump in the Mountain division.
While the regional numbers vary each month in terms of which is more or less strong, the overall trend is one of rising prices. The Fed’s Operation Twist—to lower mortgage rates—appears to have helped with the Fed’s goal of boosting asset prices—including home prices.
 New orders for durables have been very volatile in recent months and net flat. But maybe there is upward momentum with the latest report. New factory orders for durables in November rose 0.7 percent in November, following a 1.1 percent gain in October. The very volatile transportation component was down slightly on aircraft subcomponents. Excluding transportation, orders increased 1.6 percent, following a boost of 1.9 percent in October. Market expectations were for a 0.2 percent rise in orders excluding transportation. For the core measure, gains were widespread. New orders for durables have been very volatile in recent months and net flat. But maybe there is upward momentum with the latest report. New factory orders for durables in November rose 0.7 percent in November, following a 1.1 percent gain in October. The very volatile transportation component was down slightly on aircraft subcomponents. Excluding transportation, orders increased 1.6 percent, following a boost of 1.9 percent in October. Market expectations were for a 0.2 percent rise in orders excluding transportation. For the core measure, gains were widespread.
 The transportation component fell 1.1 percent after a 0.6 percent dip in October. Weakness in the latest month was in subcomponents for nondefense aircraft, down 13.9 percent, and defense aircraft, down 12.3 percent. New orders for motor vehicles were up 3.5 percent. The transportation component fell 1.1 percent after a 0.6 percent dip in October. Weakness in the latest month was in subcomponents for nondefense aircraft, down 13.9 percent, and defense aircraft, down 12.3 percent. New orders for motor vehicles were up 3.5 percent.
Outside of transportation, healthy gains were seen in primary metals, machinery, and electrical equipment. Computers & electronics saw a modest rise while “other” durables edged down.
Core investment orders in the private sector put together two healthy gains in a row. Nondefense capital goods orders excluding aircraft increased 2.7 percent in November, following a 3.2 percent boost the month before. Shipments for this series also posted consecutive increases, rising 1.8 percent and 0.6 percent in November and October, respectively.
Manufacturing may be regaining some momentum, but the pace is still moderate at best. More recent regional Fed surveys on manufacturing have been mixed.
 The manufacturing sector in the area of New York State has been contracting steadily since August. The general business conditions index of the Empire State report fell to minus 8.10 for the December reading versus minus 5.22 and minus 6.16 in the prior two months. This report has shown no effect from the landfall of Hurricane Sandy or the aftermath. The report for December was filled with negatives that included contraction for new orders, unfilled orders, and employment. The 12-month outlook was still positive but was far from robust. The manufacturing sector in the area of New York State has been contracting steadily since August. The general business conditions index of the Empire State report fell to minus 8.10 for the December reading versus minus 5.22 and minus 6.16 in the prior two months. This report has shown no effect from the landfall of Hurricane Sandy or the aftermath. The report for December was filled with negatives that included contraction for new orders, unfilled orders, and employment. The 12-month outlook was still positive but was far from robust.
 Manufacturing strength for December came from an unexpected place, from the Philly Fed report whose general business activity index, which has been depressed through most of the year, popped back into expansion at 8.1 versus November's minus 10.7. New orders were at plus 10.7, up from minus 4.6 in November and only the third positive reading since April. Unfilled orders were also in positive ground, at plus 2.3 from minus 4.6 in November for the first gain since April. Manufacturing strength for December came from an unexpected place, from the Philly Fed report whose general business activity index, which has been depressed through most of the year, popped back into expansion at 8.1 versus November's minus 10.7. New orders were at plus 10.7, up from minus 4.6 in November and only the third positive reading since April. Unfilled orders were also in positive ground, at plus 2.3 from minus 4.6 in November for the first gain since April.
 Kansas City Fed district manufacturing activity declined further in December, though by a smaller amount than in October or November. Factories’ production expectations were somewhat more optimistic than last month, but a higher share of firms plan to decrease employment in coming months. Approximately half of all contacts cited fiscal policy uncertainty as having impacted their hiring decisions. Price indexes mostly increased, particularly for future raw materials, with the increase driven heavily by food prices. Kansas City Fed district manufacturing activity declined further in December, though by a smaller amount than in October or November. Factories’ production expectations were somewhat more optimistic than last month, but a higher share of firms plan to decrease employment in coming months. Approximately half of all contacts cited fiscal policy uncertainty as having impacted their hiring decisions. Price indexes mostly increased, particularly for future raw materials, with the increase driven heavily by food prices.
The month-over-month composite index was minus 2 in December, up slightly from minus 6 in November and minus 4 in October. Manufacturing activity was stable at most durable goods producing plants, while nondurable producers cited further declines.
Most other month-over-month indexes also edged up slightly in December but remained below zero. The production index inched higher from minus 6 to minus 5. The new orders index improved to minus 8 from minus 14 in October. The order backlog and new orders for exports indexes also rose but remained negative. In contrast, the employment and shipments indexes fell after rising last month.
 The index of leading indicators showed an as-expected 0.2 percent decline in a November reading that was less than convincing. Components were very mixed. A jump in jobless claims was the chief negative in the month, one that was badly skewed by special factors and one in any case that has since been reversed. Manufacturing orders were the second area of weakness but was narrowly focused, based on the durables orders components in the index of leading indicators. Overall durables orders for the month were moderately healthy. Housing was a positive in the latest report and is likely to be an increasing positive in future reports as the housing sector appears to be building some steam. Unless fears about the fiscal cliff worsen, the S&P 500 component should be positive for December. The index of leading indicators showed an as-expected 0.2 percent decline in a November reading that was less than convincing. Components were very mixed. A jump in jobless claims was the chief negative in the month, one that was badly skewed by special factors and one in any case that has since been reversed. Manufacturing orders were the second area of weakness but was narrowly focused, based on the durables orders components in the index of leading indicators. Overall durables orders for the month were moderately healthy. Housing was a positive in the latest report and is likely to be an increasing positive in future reports as the housing sector appears to be building some steam. Unless fears about the fiscal cliff worsen, the S&P 500 component should be positive for December.
Mostly favorable economic news has been mostly ignored due to the high noise level from negotiations over resolving the fiscal cliff. If the fiscal cliff is resolved—at least temporarily—there may well be notable upside potential for the economy and equities. If there is no resolution soon, however, the risk of damaging the recovery is significant.
The holiday shortened week is dominated by housing—the sector that now is showing sustained but moderate recovery. Key reports are Case-Shiller, new home sales, and pending existing home sales. After last week’s dismal report on consumer sentiment, this week’s consumer confidence report will garner extra attention.
NYSE Early Close
SIFMA Recommended Early Close 2:00 ET
U.S. Holiday: Christmas Day
All Markets Closed
The S&P/Case-Shiller 20-city home price index (SA) rose 0.4 percent in September following similarly solid gains of 0.5 percent and 0.3 percent in the two prior months. Improvement was really evident in the year-on-year rate which was up to plus 3.0 percent from plus 2.2 and plus 1.1 percent in the prior two months. Gains swept across nearly all 20 cities.
The S&P/Case-Shiller 20-city HPI (SA, m/m) Consensus Forecast for October 12: +0.5 percent
Range: +0.3 to +0.8 percent
The S&P/Case-Shiller 20-city HPI (NSA, m/m) Consensus Forecast for October 12: -0.3 percent
Range: -0.5 to +0.4 percent
The S&P/Case-Shiller 20-city HPI (NSA, y/y) Consensus Forecast for October 12: +4.1 percent
Range: +3.5 to +4.4 percent
The Richmond Fed manufacturing index improved to plus 9 in November from October's minus 7. Still, the latest number reflected only modest growth for the month. New orders showed notable improvement as did shipments. The new orders index jumped to plus 11 from minus 6 in October.
Richmond Fed manufacturing index Consensus Forecast for December 12: 6
Range: 5 to 15
Initial jobless claims swung 17,000 higher in the December 15 week to 361,000 following a revised 27,000 decline in the December 8 week. Weekly changes for the prior weeks were likewise extreme: minus 27,000, minus 24,000, minus 21,000, minus 35,000, plus 90,000. The latter of these of course reflect the initial impact and subsequent unwinding of Hurricane Sandy, while in the backdrop were shortened weeks and holiday effects. Continuing claims in data for the December 8 week rose 12,000 to 3.225 million. This series has also been affected by the storm and by seasonal factors but to a lesser degree.
Jobless Claims Consensus Forecast for 12/22/12: 365,000
Range: 355,000 to 375,000
New home sales for October edged down 0.3 percent to a 368,000 annual rate. This followed a 0.8 percent advance in September. The Commerce Department noted that Hurricane Sandy had only a minimal effect on October, hitting at month end and in only one area of the country. Sales in the Northeast, which is by far the least active region in the report, fell 32 percent in the month. Another unfavorable sign in the report was a second straight month of price weakness, down 4.2 percent for the median to $237,700. But these numbers are not based on repeat transactions and are affected by shifts in sales between price ranges. It is difficult to believe that new home prices for comparable houses can be down so sharply while other price measures are headed up. Supply remains low in the new home market at 4.8 months at the current sales rate.
New home sales Consensus Forecast for November 12: 375 thousand-unit annual rate
Range: 360 thousand to 390 thousand-unit annual rate
The Conference Board's consumer confidence index rose to a new recovery high of 73.7 in November from an upwardly revised 73.1 in October. Strength was centered in the expectations component which was up 1.1 points to 85.1. The present situation component was down one tenth to 56.6. Holding down the present situation were flat readings on the current jobs market with 38.8 percent of consumers still saying jobs are hard to get which was unchanged from October.
Consumer confidence Consensus Forecast for December 12: 70.0
Range: 64.8 to 79.0
The Chicago PMI was up 5 tenths in November to 50.4, slightly above breakeven 50 to indicate slight month-to-month growth in general activity. The gain was led by growth in employment, where trends in this report were solid, and growth in production which has also been a solid center of strength in this report. Backlog orders were down for a fourth straight month, but just barely. Unfortunately, new orders showed significant monthly contraction, down more than 5 points to a 45.3 level that shows the most abrupt rate of monthly contraction of the recovery -- since June 2009. This is also the second sub 50 reading of the last 3 months.
Chicago PMI Consensus Forecast for December 12: 51.0
Range: 49.0 to 53.8
The pending home sales index in October jumped a very strong 5.2 percent with the impact of Hurricane Sandy, based on only a fractional decline in the Northeast, proving to be very limited, at least in the October report. The Midwest showed a very strong gain as did the South. October’s pending home sales index was at a five-year high.
Pending home sales Consensus Forecast for November 11: +1.8 percent
Range: -2.7 to +6.0 percent
In another holiday shortened week, the highlight will be Friday’s employment situation report for December. Leading into that key report will be important reports on the consumer sector, including motor vehicle sales and ADP private employment. Manufacturing has been mixed recently but perhaps has been showing a little more positive movement than negative. The Markit PMI and ISM manufacturing report will provide updates for December.
Consensus numbers were not available for this week at time of publication.
The Dallas Fed general business activity index in its Texas manufacturing survey was little changed in November but the outlook slipped. The production index, a key measure of state manufacturing conditions, came in at 1.7, indicating output barely increased from October. Other survey measures suggested flat manufacturing activity in November. The new orders index came in at 0.4, suggesting that demand was unchanged from October. Perceptions of broader business conditions worsened in November. The general business activity index fell to minus 2.8 from plus 1.8 in October, returning to negative territory. Indexes reflecting future business conditions fell sharply in November. The index of future general business activity plunged from 16.8 to minus 5.3, its lowest reading in four months.
SIFMA Recommended Early Close 2:00 ET
New Year’s Day. All Markets Closed.
Sales of total light motor vehicles in November surged a monthly 8.7 percent to a 15.5 million annual rate. Replacement demand tied to Hurricane Sandy boosted sales as did incentives during the month. Sales were led by imports, up 11.2 percent, versus domestics, up 8.0 percent. Sales of imported trucks were up a sharp 15.9 percent, likely reflecting demand due to Sandy.
The Markit PMI manufacturing flash index for December rose to 54.2, up a solid 1.4 points from the final index for November. A reading over 50 indicates monthly growth in business activity and a reading over the prior reading indicates a greater rate of growth. Details were solid across the report led by monthly acceleration in new orders which were up 1.2 points to 54.8. A special highlight was the index for new export orders which, following a long streak under 50, first popped over the breakeven mark last month and is now at 52.8. This suggests that foreign demand is on the mend.
The composite index from the ISM manufacturing survey slipped to 49.5 from 51.7 in October. This index has been in negative territory in four of the last six months. The new orders index showed only fractional growth relative to October, posting at 50.3 in November versus 54.2 the prior month. Backlog orders remained notably negative at 41.0, compared to 41.5 in October.
Construction spending jumped 1.4 percent in October, following a gain of 0.5 percent the month before. The rise in October was led by private residential spending which advanced 3.0 percent after rising 1.1 percent the prior month. For the latest month, new 1-family outlays jumped 3.6 percent, new multi-family construction jumped 6.2 percent, and residential excluding new homes (largely improvements) gained 1.8 percent. Private nonresidential spending rose 0.3 percent after increasing 0.5 percent in September. Public outlays rebounded 0.8 percent, following a 0.1 percent dip the prior month.
The Minutes of the December 11-12 FOMC meeting are scheduled for release at 2:00 p.m. ET. The Fed engaged in a number of new initiatives and markets will be absorbing more detail on everything from changes in guidance using unemployment and inflation measures to how QE4 is expected to boost the economy.
ADP private payroll employment for November was estimated to be a gain of 118,000, following a downwardly revised increase of 157,000 for October. The BLS figure for private employment from the employment situation posted a 147,000 gain for November, following a revised 189,000 increase the prior month.
Initial jobless claims for this week were not yet available at time of publication of Simply Economics.
Nonfarm payroll employment in November rose a moderately strong 146,000, following an increase of 138,000 in October (originally up 171,000), following a gain of 132,000 in September (previously up 148,000). The net revisions for September and October were down 49,000. Private payrolls advanced 147,000 in November after increasing 189,000 the prior month. Government jobs nudged down 1,000 in November after plunging 51,000 the month before. Wage inflation firmed as average hourly earnings in November rose 0.2 percent, following no change in October. The average workweek held steady at 34.4 hours in November.
Turning to the household survey, the unemployment rate declined to 7.7 percent after edging up one tenth in October to 7.9 percent. The decline in the unemployment rate reflected a drop in the labor force of 350,000 after a spike of 578,000 in October.
Factory orders in October were up 0.8 percent. Excluding the volatile transportation sector, factory orders rose an even stronger 1.3 percent. The durable goods component was revised upward to a gain of 0.5 percent versus the initial reading of flat. Nondurable goods, led by price changes for fuel, rose 1.1 percent. More recently, new factory orders for durables in November rose 0.7 percent in November, following a 1.1 percent gain in October. The very volatile transportation component was down slightly on aircraft subcomponents. Excluding transportation, orders increased 1.6 percent, following a boost of 1.9 percent in October.
The composite index from the ISM non-manufacturing survey in November rose five tenths to 54.7 with business activity over 60 for the first time since February. New orders came in at 58.1 for a more than three point gain and the best reading since March. But employment was barely over 50, at 50.3 for a nearly five point monthly dip for the worst reading since July.
R. Mark Rogers is the author of The Complete Idiot’s Guide to Economic Indicators, Penguin Books.
Econoday Senior Writer Mark Pender contributed to this article.
|
