|
The uncertainty from the U.S. presidential election is over. However, markets are now concerned about resolution of the U.S. “fiscal cliff” problem even as the economy shows signs of continued but modest improvement.
 Equities dropped for the week even as presidential election uncertainty ended. However, stocks started the first two days of the week on a positive note ahead of the election results. Monday, equities drifted higher, essentially on a listless trend ahead of election results. Traders worried and wondered about how not just the presidential election would affect resolution of the pending fiscal cliff but also on whether Congressional elections would have impact. ISM non-manufacturing was in positive territory but a little below expectations. Stocks rose moderately Tuesday for no apparent reason other than seeing an end to much of the uncertainty related to the elections. There was no U.S. economic news and indicators from Europe actually disappointed. And limited corporate news in the U.S. disappointed. Equities dropped for the week even as presidential election uncertainty ended. However, stocks started the first two days of the week on a positive note ahead of the election results. Monday, equities drifted higher, essentially on a listless trend ahead of election results. Traders worried and wondered about how not just the presidential election would affect resolution of the pending fiscal cliff but also on whether Congressional elections would have impact. ISM non-manufacturing was in positive territory but a little below expectations. Stocks rose moderately Tuesday for no apparent reason other than seeing an end to much of the uncertainty related to the elections. There was no U.S. economic news and indicators from Europe actually disappointed. And limited corporate news in the U.S. disappointed.
Tuesday’s elections resulted in another term for President Barack Obama, retention of control of the House of Representatives by the Republican Party, and retention of control of the Senate by the Democratic Party. Market attention then focused on what the outcomes are likely regarding the fiscal cliff that is enacted in law and will occur unless tax and spending laws are adjusted. A number of economic pundits argue that the U.S. will go back into recession unless significant changes in law are made as tax rates will rise and government spending will be cut.
Wednesday, stocks dropped sharply after the election results with the Dow having its biggest decline in a year. In part, Wall Street was disappointed that its mostly preferred candidate lost the presidential election. Also, concerns over the situation in Greece also weighed on investors as they awaited the results of a vote in the Greek Parliament and The European Commission slashed its 2013 growth forecast. But the big issue is that traders realized that the fiscal cliff issue still looms and the Tuesday elections did not clarify that issue. However, many health care stocks gained Wednesday on affirmation of “Obama Care.” Stocks continued to decline Thursday on fiscal cliff worries even as initial jobless claims dipped and exports rose in the international trade report. Equities edged up Friday on a better than expected number on consumer sentiment.
Equities were down this past week. The Dow was down 2.1 percent; the S&P 500, down 2.4 percent; the Nasdaq, down 2.6 percent; the Russell 2000, down 2.4 percent; and the Wilshire 5000, down 2.4 percent.
For the year-to-date, major indexes are up as follows: the Dow, up 4.9 percent; the S&P 500, up 9.7 percent; the Nasdaq, up 11.5 percent; the Russell 2000, up 7.3 percent; and the Wilshire 5000, up 9.5 percent.
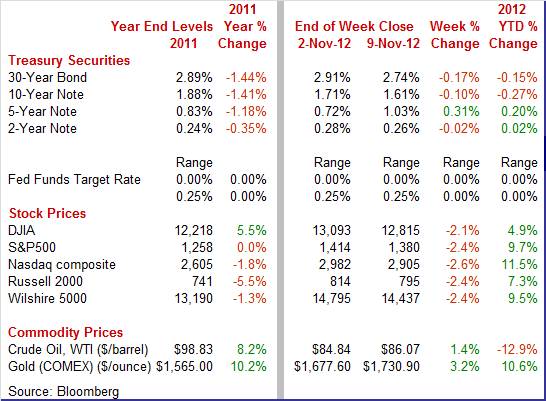
Weekly percent change column reflects percent changes for all components except interest rates. Interest rate changes are reflected in simple differences.
 Treasury yields ended the week down, largely on safe haven moves. There was not much economic news—mainly election worries and outcomes. Rates eased Monday as some investors decided to move to the sidelines ahead of Tuesday elections. Also, ISM non-manufacturing was not as positive as projected and Greek worries stood out. Rates rose modestly Tuesday on sluggish demand on the 3-year T-note auction. Treasury yields ended the week down, largely on safe haven moves. There was not much economic news—mainly election worries and outcomes. Rates eased Monday as some investors decided to move to the sidelines ahead of Tuesday elections. Also, ISM non-manufacturing was not as positive as projected and Greek worries stood out. Rates rose modestly Tuesday on sluggish demand on the 3-year T-note auction.
Rates dropped notably Wednesday after President Obama’s re-election was seen as helping to enforce the Fed’s easy monetary policy. Fiscal cliff concerns also added to flight to safety. Rates declined further Thursday despite positive economic news. Again, it was moves to the sidelines for safety. Rates were essentially unchanged Friday.
For this past week Treasury rates were down as follows: the 2-year note, down 2 basis points; the 5-year note, down 8 basis points; the 7-year note, down 13 basis points; the 10-year note, down 10 basis points; and the 30-year bond, down 17 basis points. The 3-month T-bill was unchanged for the week.
 The spot price of crude rose modestly this past week. However, there were some sharp daily swings in price. West Texas Intermediate rose a dollar a barrel Monday on the re-start of some refineries on the East Coast after Hurricane Sandy. Forecasts on supply shortage jacked up WTI by 2-1/2 dollars Tuesday. The spot price of crude rose modestly this past week. However, there were some sharp daily swings in price. West Texas Intermediate rose a dollar a barrel Monday on the re-start of some refineries on the East Coast after Hurricane Sandy. Forecasts on supply shortage jacked up WTI by 2-1/2 dollars Tuesday.
At mid-week, crude dropped a sharp almost $4 a barrel as the outcome of the presidential election raised worries about resolution of the fiscal cliff. Following little change Thursday, WTI rose a buck a barrel on stronger consumer sentiment.
Net for the week, the spot price for West Texas Intermediate rose $1.23 per barrel to settle at $86.07.
This week, progress was seen in international trade and the consumer sector.
 The U.S. trade balance in September improved, largely on petroleum. And the best news is that exports rebounded. The trade deficit narrowed to $41.5 billion from $43.8 billion in August. Exports rebounded 3.1 percent, following a 1.0 percent decline in August. Imports increased 1.5 percent after slipping 0.2 percent the month before. The U.S. trade balance in September improved, largely on petroleum. And the best news is that exports rebounded. The trade deficit narrowed to $41.5 billion from $43.8 billion in August. Exports rebounded 3.1 percent, following a 1.0 percent decline in August. Imports increased 1.5 percent after slipping 0.2 percent the month before.
 The shrinking in the trade gap was led by the petroleum deficit which decreased to $21.7 billion in September from $23.5 billion in August. The non-petroleum goods shortfall actually grew to $35.2 billion from $34.9 billion for the prior month. The services surplus improved to $15.9 billion from $15.1 billion in August. The shrinking in the trade gap was led by the petroleum deficit which decreased to $21.7 billion in September from $23.5 billion in August. The non-petroleum goods shortfall actually grew to $35.2 billion from $34.9 billion for the prior month. The services surplus improved to $15.9 billion from $15.1 billion in August.
Perhaps exports hit a low in August, given the widespread rebound in September. Gains were seen in all major categories except for automotive. And that category probably reflected monthly volatility between U.S. and Canadian trade which is common in the auto industry.
On the import side, nearly all categories were up with consumer goods especially strong. Perhaps, businesses are not as negative about consumer demand as suggested in earlier trade reports.
Broadly, the latest trade report was good news as exports were up and businesses were bringing in imported consumer goods for apparently expected higher demand.
 With the election over and despite the approach of the fiscal cliff, consumer sentiment was strong in mid-November, up 2.3 points to another recovery best of 84.9, compared to end of October 82.6. Confidence in current conditions was especially strong, at 91.3 versus October's final reading of 88.1. With the election over and despite the approach of the fiscal cliff, consumer sentiment was strong in mid-November, up 2.3 points to another recovery best of 84.9, compared to end of October 82.6. Confidence in current conditions was especially strong, at 91.3 versus October's final reading of 88.1.
But expectations were also on the rise, up nearly 2 points to 80.8. Both of these readings, like the composite index, were at recovery bests.
 Another big increase in student loans drove consumer credit higher, up $11.4 billion in September, following August's very large revised gain of $18.4 billion. Another big increase in student loans drove consumer credit higher, up $11.4 billion in September, following August's very large revised gain of $18.4 billion.
The non-revolving component, inclusive of the student loan category and auto sales, rose $14.3 billion in the month on top of August's $14.1 billion gain.
Revolving credit, where credit card debt is tracked, actually fell, down $2.9 billion for the third decrease in four months. Contraction here belies the strength seen in ex-auto retail sales over this period and perhaps points to a rising share of cash transactions at retailers. The bottom line is that students are staying in school due to slow job formation.
 The bulk of the nation's economy fared well in October based on the ISM's non-manufacturing index which came in at 54.2, safely above 50 to indicate monthly growth though at a slightly slower rate of monthly growth than September's 55.1. Growth in new orders slowed a bit but the 54.8 reading was healthy and points to activity down the production chain in the months ahead. Business activity, akin to a production index in this report, also slowed but at 55.4 was still solid and compared to 59.9 in September. The bulk of the nation's economy fared well in October based on the ISM's non-manufacturing index which came in at 54.2, safely above 50 to indicate monthly growth though at a slightly slower rate of monthly growth than September's 55.1. Growth in new orders slowed a bit but the 54.8 reading was healthy and points to activity down the production chain in the months ahead. Business activity, akin to a production index in this report, also slowed but at 55.4 was still solid and compared to 59.9 in September.
Employment was the standout in this report, rising nearly four points to 54.9 for the strongest rate of monthly growth since March.
The economy continues to make modest progress. With the presidential election over, the markets now worry about how the “fiscal cliff” issue is going to be resolved.
Manufacturing has been wavering in recent months and we get to see if this trend continues with industrial production, Empire State, and Philly Fed. The consumer has been a little more optimistic but the question is whether it will show up in retail sales for October—which likely were affected by Hurricane Sandy. Oil prices have weakened and we may see softer headline numbers for the PPI and CPI.
U.S. Holiday: Veterans’ Day Observed. Stock Market Open. Banks Closed.
The NFIB Small Business Optimism Index for September edged down one tenth to 92.8 which is a level that the National Federation of Independent Business calls recessionary. Employment readings were down as were plans for capital outlays. On the positive side, earnings trends were up with optimism on the outlook for the economy slightly higher.
No consensus numbers are available
The U.S. Treasury monthly budget report showed a deficit in August of $190.5 billion. Eleven months into the fiscal year, the government's deficit slowed further in August and was down 5.6 percent versus this time last year. The biggest improvement was in corporate taxes which were up 31 percent. Individual taxes, which are a much larger source of income for the Treasury, are also higher, up 3.9 percent. Looking ahead, the month of September typically shows a surplus for the month. Over the past 10 years, the average surplus for the month of September has been $20.0 billion and $3.2 billion over the past 5 years. The September 2011 budget number posted at a deficit $62.8 billion.
Treasury Statement Consensus Forecast for September 12: -$113.0 billion
Range: -$130.0 billion to -$113.0 billion.
The producer price index in September posted a 1.1 percent surge, following a 1.7 percent jump in August. The core rate, which excludes both food and energy, was unchanged after rising 0.2 percent the month before. Food inflation eased to a 0.2 percent increase after a 0.9 percent boost in August. Energy remained robust with a monthly 4.7 percent jump, following a surge of 6.4 percent the prior month. Gasoline increased 9.8 percent, following a 13.6 percent spike in August. Within the core, higher prices for light motor trucks were offset by declining prices for communication and related equipment.
PPI Consensus Forecast for October 12: +0.2 percent
Range: -0.2 to +0.4 percent
PPI ex food & energy Consensus Forecast for October 12: +0.2 percent
Range: -0.1 to +0.2 percent
Retail sales in September advanced 1.1 percent after gaining 1.2 percent the month before. Motor vehicle sales increased 1.3 percent after a 1.8 percent jump in August. Ex-auto sales jumped 1.1 percent, following a rise of 1.0 percent in August. Gasoline sales continued strong gains, increasing 2.5 percent in September, following a 6.1 percent spike the prior month. Excluding both autos and gasoline components, sales still posted a healthy 0.9 percent gain, following a 0.3 percent gain in August. Core components showed widespread gains. Leading the way were electronics & appliance stores, likely reflecting to a notable degree sales of iPhone 5.
Retail sales Consensus Forecast for October 12: -0.1 percent
Range: -0.4 to +0.3 percent
Retail sales excluding motor vehicles Consensus Forecast for October 12: +0.2 percent
Range: -0.4 to +0.6 percent
Less motor vehicles & gasoline Consensus Forecast for October 12: +0.2 percent
Range: -0.2 to +0.5 percent
Business inventories rose 0.6 percent in August versus a 0.5 percent rise for sales which kept the inventory-to-sales ratio unchanged at 1.28. More recently, factory inventories increased 0.6 percent in September while wholesale inventories spiked 1.1 percent.
Business inventories Consensus Forecast for September 12: +0.4 percent
Range: +0.2 to +0.6 percent
The Minutes of the September 12-13 FOMC meeting are scheduled for release at 2:00 p.m. ET. The FOMC has decided the key issue for now is unemployment instead of inflation and traders will be focusing on any changes in the characterization of the labor market. Also, additional details on QE3 would get market attention.
The consumer price index in September increased 0.6 percent, following a 0.6 percent surge the month before. In contrast, excluding food and energy, the CPI rose a mild 0.1 percent after edging up 0.1 percent in August. By major components, energy jumped a monthly 4.5 percent after increasing 5.6 percent in August. Gasoline increased 7.0 percent in September, following a monthly surge of 9.0 percent the month before. Food prices eased to a 0.1 percent gain after rising 0.2 percent in August. Within the core, indexes for shelter, medical care, apparel, and airline fares were among those that increased, while the indexes for used cars and trucks, new vehicles, personal care, and household furnishings and operations all declined.
CPI Consensus Forecast for October 12: +0.1 percent
Range: 0.0 to +0.3 percent
CPI ex food & energy Consensus Forecast for October 12: +0.2 percent
Range: +0.1 to +0.2 percent
Initial jobless claims in the November 3 week fell 8,000 to 355,000 but the recent trend is still somewhat upward with the four-week average up 3,250 to 370,500 which is slightly above, not below, levels a month ago. Continuing claims are coming down, down a very sizable 135,000 in data for the October 26 week to 3.127 million. The four-week average was down 38,000 to 3.228 million which is a recovery best.
Jobless Claims Consensus Forecast for 11/10/12: 376,000
Range: 340,000 to 390,000
The Empire State manufacturing index in October improved to minus 6.16 from minus 10.41 the prior month which indicates monthly contraction but at a less severe rate than September. The rate of contraction also eased for new orders which are at minus 8.97 versus September's minus 14.03.
Empire State Manufacturing Survey Consensus Forecast for November 12: -5.00
Range: -10.00 to 0.30
The general business conditions index of the Philadelphia Fed's Business Outlook Survey for October improved to plus 5.7 from minus 1.9 the prior month. This was the first positive reading since April. However, new orders were back in contraction, though only slightly at minus 0.6 versus plus 1.0 in September.
Philadelphia Fed survey Consensus Forecast for November 12: 4.5
Range: -4.0 to 8.0
Industrial production made a partial comeback in September. Overall industrial production rebounded 0.4 percent in September after falling 1.4 percent in August. However, according to the Fed, roughly 0.3 percentage points of the decline in overall industrial production in August reflected the effect of precautionary idling of production in late August along the Gulf of Mexico in anticipation of Hurricane Isaac, and part of the rise in September was a result of the subsequent resumption of activity at idled facilities. By major components, manufacturing rose 0.2 percent, following a drop of 0.9 percent in August. Motor vehicles production dipped 2.5 percent, following a 5.1 percent decrease in August. Manufacturing excluding motor vehicles rebounded 0.4 percent after a 0.6 percent decline the month before. Overall capacity utilization rose to 78.3 percent from 78.0 percent in August. Looking ahead, the manufacturing component of industrial production may be sluggish in October as aggregate production hours for manufacturing edged up only 0.1 percent.
Industrial production Consensus Forecast for October 12: +0.2 percent
Range: -0.1 to +0.5 percent
Manufacturing production component Consensus Forecast for October 12: +0.3 percent
Range: +0.1 to +0.5 percent
Capacity utilization Consensus Forecast for October 12: 78.4 percent
Range: 78.1 to 78.5 percent
R. Mark Rogers is the author of The Complete Idiot’s Guide to Economic Indicators, Penguin Books, 2009.
Econoday Senior Writer Mark Pender contributed to this article.
|
