|
The economy gained a little strength in the third quarter. Sector strength is mixed.
 Equities ended the week down moderately on concern about corporate revenue outlooks and worries about strength of the economy. Also, more investors are moving to safety ahead of the U.S. presidential election and the pending fiscal cliff. Equities ended the week down moderately on concern about corporate revenue outlooks and worries about strength of the economy. Also, more investors are moving to safety ahead of the U.S. presidential election and the pending fiscal cliff.
The week started basically flat as negative trade numbers from Japan were offset by positive earnings from Caterpillar although revenues fell short. Tuesday was down notably on disappointing corporate numbers, including DuPont and 3M among others. Stocks continued downward Wednesday despite a favorable house price gain in an accidental early release of FHFA data Tuesday night and a strong gain in new home sales. Traders were disappointed in the Fed’s FOMC statement which characterized the economy with modest growth. Policy was unchanged.
Stocks made modest gains Thursday on a decline in jobless claims and a better-than-expected rebound in durable goods orders. At week’s close, most major indexes were little changed as better-than-expected third quarter GDP was offset by somewhat disappointing consumer sentiment. Earnings were a concern with Goodyear standing out on disappointing profits.
Equities were down this past week. The Dow was down 1.8 percent; the S&P 500, down 1.5 percent; the Nasdaq, down 0.6 percent; the Russell 2000, down 0.9 percent; and the Wilshire 5000, down 1.4 percent.
For the year-to-date, major indexes are up as follows: the Dow, up 7.3 percent; the S&P 500, up 12.3 percent; the Nasdaq, up 14.7 percent; the Russell 2000, up 9.8 percent; and the Wilshire 5000, up 11.9 percent.
Weekly percent change column reflects percent changes for all components except interest rates. Interest rate changes are reflected in simple differences.
 Treasury rates were essentially flat for the week. Yields drifted up Monday on little economic news and uncertainty about the upcoming Fed policy decision on Wednesday of the week. Yields dipped Tuesday for essentially the same reasons—but a mild shift in trader sentiment. Treasury rates were essentially flat for the week. Yields drifted up Monday on little economic news and uncertainty about the upcoming Fed policy decision on Wednesday of the week. Yields dipped Tuesday for essentially the same reasons—but a mild shift in trader sentiment.
 At mid-week, bond traders interpreted economic events a little more favorably than equity traders. Yields rose modestly on stronger new home sales and unchanged Fed policy. Thursday, rates dipped moderately despite better-than-expected economic data. This was due to a disappointing auction of 7-year Treasuries. Flight to safety came into play at the end of the week on news of Spain’s unemployment rate jumping. At mid-week, bond traders interpreted economic events a little more favorably than equity traders. Yields rose modestly on stronger new home sales and unchanged Fed policy. Thursday, rates dipped moderately despite better-than-expected economic data. This was due to a disappointing auction of 7-year Treasuries. Flight to safety came into play at the end of the week on news of Spain’s unemployment rate jumping.
For this past week Treasury rates were little changed and mixed as follows: 3-month T-bill, up 2 basis points; the 2-year note, up 1 basis point; the 5-year note, up 1 basis point; the 7-year note, unchanged; the 10-year note, down 2 basis points; and the 30-year bond, down 4 basis points.
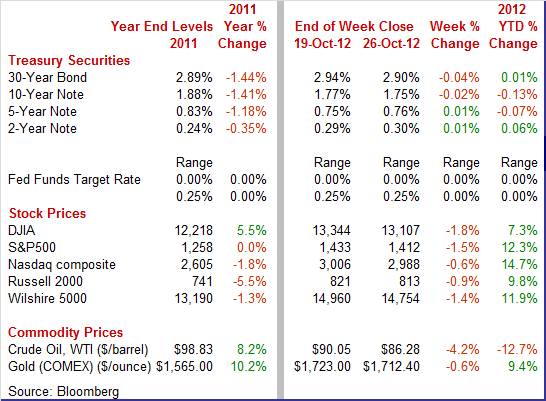
 The spot price of crude ended the week down significantly. Spot West Texas Intermediate dropped more than a dollar a barrel on news that TransCanada Corp. plans to restart the Keystone pipeline. Also, a drop in Japanese exports raised worries about slowing global growth. The sharpest daily decline was Tuesday with a drop of about $2.50 per barrel with disappointing earnings the reason. On Wednesday, crude dipped about a dollar on higher than expected crude inventories. The spot price of crude ended the week down significantly. Spot West Texas Intermediate dropped more than a dollar a barrel on news that TransCanada Corp. plans to restart the Keystone pipeline. Also, a drop in Japanese exports raised worries about slowing global growth. The sharpest daily decline was Tuesday with a drop of about $2.50 per barrel with disappointing earnings the reason. On Wednesday, crude dipped about a dollar on higher than expected crude inventories.
Marginal gains were seen Thursday and Friday.
Net for the week, the spot price for West Texas Intermediate declined $3.77 per barrel to settle at $3.77.
The recovery is improving but in an uneven pace by sector.
 The economy is gaining momentum but very gradually. At 2.0 percent, growth in third-quarter GDP came in fractionally higher than expected and above second-quarter growth of 1.3 percent. The problem is that 2.0 percent growth is still anemic. The economy is gaining momentum but very gradually. At 2.0 percent, growth in third-quarter GDP came in fractionally higher than expected and above second-quarter growth of 1.3 percent. The problem is that 2.0 percent growth is still anemic.
The modest good news was that the quarter was led by final demand which is a positive indication for improving momentum going into the fourth quarter. Final sales of domestic product rose 2.1 percent which marked acceleration from 1.7 percent in the second quarter. An alternate reading that excludes net exports is even stronger with final sales to domestic producers up 2.3 percent versus the prior quarter's 1.4 percent.
Personal consumption picked up in the quarter, led by consumer buying of durable goods which hints at consumer optimism to make large purchases. Business spending was flat.
A surprise positive in the quarter was a strong contribution from government spending led by Federal spending and specifically defense spending. Exports, as indicated by the special strength in the final sales reading that excludes exports, was a drag on the quarter and reflects weakness in global markets that's centered in Europe and includes Asia.
Inflation hawks have something to read in this report with the GDP price index, at 2.8 percent, coming in above high-end expectations. But when excluding food and energy, pressure slows to 1.3 percent from the second quarter's 1.7 percent.
While the latest GDP number is an improvement, it not enough to move unemployment down notably. So, the Fed will not be so excited about the latest reading and loose monetary policy will continue.
 The new factory orders for durables series has always been known as a volatile series. But the last two reports have been extraordinarily volatile. But on average, manufacturing still appears to be on a soft trend after sorting through the detail. New factory orders for durables rebounded a monthly 9.9 percent in September after a sharp 13.1 percent plunge in August The comeback was largely due to aircraft orders within the transportation component—where weakness was in August. Excluding transportation, orders rose 2.0 percent after decreasing 2.1 percent in August. The new factory orders for durables series has always been known as a volatile series. But the last two reports have been extraordinarily volatile. But on average, manufacturing still appears to be on a soft trend after sorting through the detail. New factory orders for durables rebounded a monthly 9.9 percent in September after a sharp 13.1 percent plunge in August The comeback was largely due to aircraft orders within the transportation component—where weakness was in August. Excluding transportation, orders rose 2.0 percent after decreasing 2.1 percent in August.
Civilian aircraft (Boeing) has really jerked around the total and especially the transportation component. The transportation component rebounded a monthly 31.7 percent after a 33.7 percent plummet in August. Next, civilian aircraft orders were “extremely” low in August due to cancellations, setting up an extremely low baseline for September. Now, the punch line—civilian aircraft orders surged a monthly 2,640.7 percent (that is not a typo). But the issue was an extraordinarily low baseline for August.
For other subcomponents in transportation, motor vehicles slipped 0.4 percent after falling 11.6 percent in August. Defense aircraft jumped 27.2 percent in September, following a 1.4 percent dip the prior month.
Outside of transportation, new orders were mixed. Gains were seen in primary metals, machinery, and “other.” Declines were seen in fabricated metals, computers & electronics, and electrical equipment.
Business investment is looking flat outside of aircraft. Orders for nondefense capital goods excluding aircraft were unchanged in September, following a 0.2 percent rise in August and a 5.6 percent drop in July. The equipment investment component in GDP for the third quarter is not looking good. Shipments for nondefense capital goods excluding aircraft slipped 0.3 percent in September, following a 1.2 percent decrease the prior month.
Overall, manufacturing remains soft and business investment in equipment appears to actually be slipping.
According to Markit Economics, the nation's manufacturing expanded in October but at no more than a marginal pace as the PMI flash index rose 2 tenths to 51.3 from September's final reading. Since July the index has been holding in a very tight four tenths range. Order readings were soft with new orders down 7 tenths to 51.6 for the slowest rate of monthly growth since July. Orders continue to be pulled down by weakness in overseas demand with new export orders, little changed at 48.1, below 50 for a fifth straight month.
On the positive side was output which rose nine tenths to 51.5 which is still very soft—just modestly above breakeven of 50. Manufacturers as still slightly positive looking forward an hiring is still net positive with the employment index up fractionally to 52.1.
However, the news is not so good from more recent Fed regional surveys.
 The Richmond Fed’s composite manufacturing index dropped to minus 7 in October from plus 4 the prior month, a reversal that points to outright contraction in monthly activity. This index first dipped into negative ground in June. The Richmond Fed’s composite manufacturing index dropped to minus 7 in October from plus 4 the prior month, a reversal that points to outright contraction in monthly activity. This index first dipped into negative ground in June.
New orders are once again contracting, to minus 6 from plus 7. Backlog orders remain in contraction while shipments, like new orders, are moving back into contraction. Manufacturers in the region continue to cut back their work forces.
 Manufacturing activity declined slightly in the Kansas City Fed District as the composite index declined to minus 4 in October from plus 2 in September. Manufacturing activity declined slightly in the Kansas City Fed District as the composite index declined to minus 4 in October from plus 2 in September.
Manufacturing slowed at most durable and nondurable goods-producing plants, particularly among producers of machinery and electronic equipment. Most other month-over-month indexes also fell in October. The production index eased further from minus 4 to minus 6, and the new orders and order backlog indexes also declined. The employment index moved into negative territory for the first time this year, while the shipments index inched higher but still remained negative.
While regional manufacturing surveys do not always move in tandem with national data on this sector, they are more timely and currently point to slippage in manufacturing in the near term.
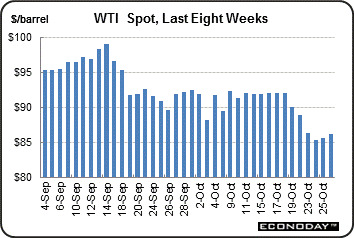
 The new home market is increasingly a source of strength for the economy with new home sales up a very sharp 5.7 percent in September to 389,000 which is the best annual rate since the stimulus efforts of mid-2010. September's gain is convincing and was led, with a 16.8 percent jump, by the South which is far larger than all other regions combined. Supply, at 4.5 months for the lowest reading since 2005, is very tight and actually is limiting sales. Prices for new homes, which have been going straight up, eased a bit last month, down 3.2 percent for the median to $242,400. But this price measure is not based on repeat sales and is affected by monthly shifts between low and high end sales. The new home market is increasingly a source of strength for the economy with new home sales up a very sharp 5.7 percent in September to 389,000 which is the best annual rate since the stimulus efforts of mid-2010. September's gain is convincing and was led, with a 16.8 percent jump, by the South which is far larger than all other regions combined. Supply, at 4.5 months for the lowest reading since 2005, is very tight and actually is limiting sales. Prices for new homes, which have been going straight up, eased a bit last month, down 3.2 percent for the median to $242,400. But this price measure is not based on repeat sales and is affected by monthly shifts between low and high end sales.
 The housing market has been on a modest uptrend this recent but it has been uneven. And pending home sales in September point to perhaps temporary softening in sales. Pending existing home sales rose a modest 0.3 percent in September, following a 2.6 percent drop the prior month. The housing market has been on a modest uptrend this recent but it has been uneven. And pending home sales in September point to perhaps temporary softening in sales. Pending existing home sales rose a modest 0.3 percent in September, following a 2.6 percent drop the prior month.
However, growth for existing homes has been lagging sales growth for new homes. Still, pending home sales were up 14.5 percent on a year-ago basis. Countervailing undercurrents for existing home sales include low mortgage rates on the positive side but on the negative side are still high unemployment, relatively tight credit standards, and now limited supply. And rising home prices suggest limited supply may be primary factor currently holding back sales.
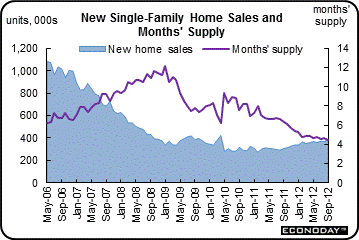
 The really good news in the housing sector is a slowly rebuilding of prices. According to the FHFA, home prices rose 0.7 percent in August, following a 0.1 percent rise in July. The really good news in the housing sector is a slowly rebuilding of prices. According to the FHFA, home prices rose 0.7 percent in August, following a 0.1 percent rise in July.
Year-on-year, the index is up 4.7 percent, compared to 3.7 percent in July.
Six of the nine Census regions posted rose in August with one down and two flat. For the nine census divisions, seasonally adjusted monthly price changes from July to August ranged from minus 0.5 percent in the East South Central division to plus 3.0 percent in the Pacific division.
Boosting asset prices is one of the key goals of the Fed currently. Operation Twist and QE3 are particularly focusing on the housing market. The latest home price data confirm that these Fed programs are having some impact, albeit from a low baseline.
 Consumer sentiment eased 5 tenths for the final October reading of 82.6 from mid-month but remained well above September's 78.3. Consumer sentiment eased 5 tenths for the final October reading of 82.6 from mid-month but remained well above September's 78.3.
Both the current conditions and the expectations components slipped 5 tenths from mid-month, to 88.1 and 79.0. Still, the 88.1 reading for current conditions was up a noticeable 2.4 points from September. The expectations index is up a sizable 5.5 points from September.
The big question is what is happening on the margin. Month end readings are up versus the prior month but down compared to mid-October. Combined with other news, there likely is still modest upward momentum for the consumer mood as gasoline prices have slipped, initial jobless claims have oscillated down, and auto sales are relatively healthy.
 At the latest FOMC meeting, the Fed left policy instruments unchanged. This includes the fed funds target remaining at a range of zero to 0.25 percent, Operation Twist continuing through the end of this year, guidance for exceptionally low rates is still through mid-2015, and QE3 is still in place. The Fed will continue its policy of reinvesting principal payments from its holdings of agency debt and agency mortgage-backed securities back into agency mortgage-backed securities. The Fed will continue purchasing additional agency mortgage-backed securities at a pace of $40 billion per month. These actions will increase the Committee’s holdings of longer-term securities by about $85 billion each month through the end of the year. QE3 still is open ended, however. At the latest FOMC meeting, the Fed left policy instruments unchanged. This includes the fed funds target remaining at a range of zero to 0.25 percent, Operation Twist continuing through the end of this year, guidance for exceptionally low rates is still through mid-2015, and QE3 is still in place. The Fed will continue its policy of reinvesting principal payments from its holdings of agency debt and agency mortgage-backed securities back into agency mortgage-backed securities. The Fed will continue purchasing additional agency mortgage-backed securities at a pace of $40 billion per month. These actions will increase the Committee’s holdings of longer-term securities by about $85 billion each month through the end of the year. QE3 still is open ended, however.
The Fed continues to focus on high unemployment as determining where policy is.
“Information received since the Federal Open Market Committee met in September suggests that economic activity has continued to expand at a moderate pace in recent months. Growth in employment has been slow, and the unemployment rate remains elevated. Household spending has advanced a bit more quickly, but growth in business fixed investment has slowed. The housing sector has shown some further signs of improvement, albeit from a depressed level. Inflation recently picked up somewhat, reflecting higher energy prices. Longer-term inflation expectations have remained stable.”
There were no surprises in the FOMC statement—the last prior to the presidential election. The bottom line is that the Fed is going to keep rates exceptionally low for some time. This will help housing, consumer de-leveraging but also auto sales, and business investment. Of course businesses have lost some enthusiasm for investment for other reasons, including fiscal uncertainty.
Economic growth is improving but the pace is still sluggish. While housing is gradually gaining ground, there are signs that manufacturing may be dipping marginally. The consumer sector is still moderately positive.
This week is mostly about the consumer—key to keeping the improvement in the recovery going. The highlight is the October employment situation report which will have not only trading implications but a possible political impact on the presidential election. Other important measures of consumer health are personal income, ADP employment, consumer confidence and motor vehicle sales. Home prices have been a positive and this week’s update is the Case-Schiller. Manufacturing has been soft so readings from ISM and Markit Economics are likely to get extra attention.
Personal income in August rose a modest 0.1 percent after a gain of 0.1 percent the month before. Reflecting weak growth in jobs and hourly earnings, the wages & salaries component was sluggish with also a 0.1 percent rise and following the same pace in July. Consumer spending continued to rise but this partly was due to higher gasoline prices. Personal consumption expenditures increased 0.5 percent in August, following a 0.4 percent boost in July. On the inflation front, a bump in energy costs lifted headline inflation with the PCE price index jumping 0.4 percent in August, following a flat reading in July. The core rate was more modest with a 0.1 percent rise, after a 0.1 percent gain in July. Looking ahead, aggregate earnings rose 0.4 percent in September, pointing to a healthy wages & salaries component in personal income.
Personal income Consensus Forecast for September 12: +0.4 percent
Range: +0.1 to +0.6 percent
Personal consumption expenditures Consensus Forecast for September 12: +0.6 percent
Range: +0.3 to +0.8 percent
PCE price index Consensus Forecast for September 12: +0.5 percent
Range: +0.2 to +0.5 percent
Core PCE price index Consensus Forecast for September 12: +0.1 percent
Range: 0.0 to +0.2 percent
The Dallas Fed general business activity index in September remained slightly negative but edged up from minus 1.6 to minus 0.9. However, the production index rose from 6.4 to 10.0, suggesting stronger output growth. Forward momentum may be picking up somewhat as the new orders index rose to 5.3 following a reading of zero last month, suggesting a pickup in demand.
Dallas Fed general business activity index Consensus Forecast for October 12: 2
Range: -5 to 2
The S&P/Case-Shiller 20-city home price index (SA) in July showed a 0.4 percent monthly gain for the 20 city index. This was the sixth straight monthly increase for the adjusted index though it was the slowest gain since February. Note that the index is a three-month average which points actually to very little change for July. The year-on-year rate for the 20 city index was up a solid five tenths to plus 1.1 percent which is the second straight positive reading and the sharpest gain in nearly two years. Unadjusted data, which are tracked closely in this report, showed a solid 1.6 percent monthly rise that, however, was down from gains of 2.3 percent and 2.4 percent in the two prior months.
The S&P/Case-Shiller 20-city HPI (SA, m/m) Consensus Forecast for August 12: +0.7 percent
Range: +0.4 to +1.0 percent
The S&P/Case-Shiller 20-city HPI (NSA, m/m) Consensus Forecast for August 12: +0.7 percent
Range: +0.4 to +1.4 percent
The S&P/Case-Shiller 20-city HPI (NSA, y/y) Consensus Forecast for August 12: +1.9 percent
Range: +1.7 to +2.1 percent
The Conference Board's consumer confidence index improved in September, jumping a very strong nine points to 70.3. This was the best reading since February and the third best reading of the whole recovery. This report stressed the consumer's improved assessment of the jobs market. Other readings include improvement in income expectations where, for the first time since June, optimists outnumber pessimists.
Consumer confidence Consensus Forecast for October 12: 74.0
Range: 68.5 to 76.0
The employment cost index in the second quarter rose 0.5 percent which was on the high side but the year-on-year rate was only plus 1.7 percent, down 2 tenths from the first quarter rate and the lowest rate since the first quarter of 2010. For the latest period, benefits gained 0.6 percent while the wages & salaries component was up 0.4 percent.
Employment cost index Consensus Forecast for Q3 12: +0.5 percent
Range: +0.4 to +0.5 percent
The Chicago PMI dropped 3.3 points in September to 49.7 which was the first sub-50 reading of the recovery. The previous recovery low was 52.7 in May. New orders in September fell a very steep 7.4 points to 47.4, also the lowest level of the recovery.
Chicago PMI Consensus Forecast for October 12: 51.0
Range: 49.5 to 52.0
Sales of total light motor vehicles hit a new recovery high in September, at 14.9 million for the highest annual rate since March 2008. This was 2.9 percent above August. All categories showed monthly strength.
Motor vehicle domestic sales Consensus Forecast for October 12: 11.4 million-unit rate
Range: 11.3 to 11.5 million-unit rate
Motor vehicle total sales Consensus Forecast for October 12: 14.8 million-unit rate
Range: 14.6 to 15.1 million-unit rate
ADP private payroll employment for September posted at 162,000. The BLS number for private payrolls in the employment situation report came in at 104,000.
ADP private payrolls Consensus Forecast for October 12: 155,000
Range: 109,000 to 180,000
Initial jobless claims fell 23,000 in the October 20 week, following a revised 46,000 surge in the prior week and a 27,000 fall the week before that. But the four-week average is tame, up very slightly for a second week to a 368,000 level that is nearly 10,000 below the month-ago trend.
Jobless Claims Consensus Forecast for 10/27/12: 369,000
Range: 361,000 to 380,000
Nonfarm business productivity for the second quarter was revised up, largely consistent with the upward revision to GDP but also due to a downward revision to hours worked. Nonfarm business productivity rose an annualized 2.2 percent in the second quarter, compared to the initial estimate of a 1.6 percent gain and compared to a 0.5 percent dip in the prior quarter. Unit labor costs were revised down to an annualized 1.5 percent increase, compared to the first estimate of 1.7 percent, and following a 6.4 percent surge in the first quarter.
Nonfarm Business Productivity Consensus Forecast for initial Q3 12: +2.0 percent annual rate
Range: +1.0 to +2.4 percent annual rate
Unit Labor Costs Consensus Forecast for initial Q3 12: +1.2 percent annual rate
Range: -0.5 to +2.2 percent annual rate
The Markit PMI manufacturing flash index in October rose 2 tenths to 51.3. Since July the index has been holding in a very tight four tenths range. Order readings were soft with new orders down 7 tenths to 51.6 for the slowest rate of monthly growth since July.
No consensus numbers are available for this month
The composite index from the ISM manufacturing survey in September rebounded to 51.5 from 49.6 in August, putting the latest reading back above 50 and into positive territory. The new orders index rebounded to 52.3 from 47.1 in August. But employment was the big plus in the September report, rising 3.1 points to a 54.7 level that indicated a surprisingly positive pace of hiring. However, new export orders remained in negative territory, although less so than in August.
ISM manufacturing composite index Consensus Forecast for October 12: 51.5
Range: 49.5 to 52.0
Construction spending declined 0.6 percent in August, following a 0.4 percent drop in July. The decrease in August was led by a 1.7 percent decline in private nonresidential outlays after a 0.5 percent dip the month before. Also, public outlays fell 0.8 percent, following a 0.5 percent decrease in July. On the positive side, private residential spending rebounded a notable 0.9 percent, following a 0.1 percent slip in July.
Construction spending Consensus Forecast for September 12: +0.6 percent
Range: -0.2 to +1.0 percent
Nonfarm payroll employment in September gained a modest 114,000, following a rise in August of 142,000 and an increase of 181,000 in July. Private payrolls advanced 104,000 in September after increasing 97,000 the month before. Average hourly earnings growth improved to 0.3 percent in September, following no change in August. The average workweek nudged up to 34.5 hours in September from 34.4 hours in August. Turning to the household survey, the unemployment rate unexpectedly dropped to 7.8 percent, following a decline to 8.1 percent in August.
Nonfarm payrolls Consensus Forecast for September 12: 125,000
Range: 30,000 to 168,000
Private payrolls Consensus Forecast for September 12: 120,000
Range: 104,000 to 167,000
Unemployment rate Consensus Forecast for September 12: 7.9 percent
Range: 7.8 to 8.0 percent
Average workweek Consensus Forecast for September 12: 34.5 hours
Range: 34.5 to 34.5 hours
Average hourly earnings Consensus Forecast for September 12: +0.2 percent
Range: +0.1 to +0.2 percent
Factory orders posted a 5.2 percent decline in August due to a temporary but massive drop in aircraft orders. But excluding transportation equipment, which is where aircraft is classified, orders actually rose in the month, up a second straight 0.7 percent. However, some of that strength was related to higher prices for oil. More recently, new factory orders for durables rebounded a monthly 9.9 percent in September.
Factory orders Consensus Forecast for September 12: +4.9 percent
Range: +3.0 to +7.0 percent
R. Mark Rogers is the author of The Complete Idiot’s Guide to Economic Indicators, Penguin Books, 2009.
Econoday Senior Writer Mark Pender contributed to this article.
|
