|
Equities were up last week despite Friday’s sag. Investors paid close attention to the slew of new economic data from both China and the U.S. along with earning reports. And data from the UK surprised on the upside as well. The EU summit at week’s end did little to enthuse investors. No progress was made on either Spain or Greece. Rather the discussions focused on establishing a single banking supervisor for Eurozone banks. For the week, only two indexes declined — the Taiex and Nasdaq. Gains ranged from the Dow (up 0.1 percent) to the Nikkei (up 5.5 percent). The Sensex was virtually unchanged.
|
|
2011 |
2012 |
% Change |
|
Index |
Dec 30 |
Oct 12 |
Oct 19 |
Week |
Year |
| Asia/Pacific |
|
|
|
|
|
|
| Australia |
All Ordinaries |
4111.0 |
4510.1 |
4593.5 |
1.8% |
11.7% |
| Japan |
Nikkei 225 |
8455.4 |
8534.1 |
9002.7 |
5.5% |
6.5% |
| Hong Kong |
Hang Seng |
18434.4 |
21136.4 |
21551.8 |
2.0% |
16.9% |
| S. Korea |
Kospi |
1825.7 |
1933.3 |
1943.8 |
0.5% |
6.5% |
| Singapore |
STI |
2646.4 |
3041.8 |
3048.9 |
0.2% |
15.2% |
| China |
Shanghai Composite |
2199.4 |
2104.9 |
2128.3 |
1.1% |
-3.2% |
|
|
|
|
|
|
|
| India |
Sensex 30* |
15454.9 |
18675.2 |
18682.3 |
0.0% |
20.9% |
| Indonesia |
Jakarta Composite |
3822.0 |
4311.4 |
4331.3 |
0.5% |
13.3% |
| Malaysia |
KLCI |
1530.7 |
1653.4 |
1666.4 |
0.8% |
8.9% |
| Philippines |
PSEi |
4372.0 |
5369.7 |
5432.4 |
1.2% |
24.3% |
| Taiwan |
Taiex |
7072.1 |
7437.0 |
7408.8 |
-0.4% |
4.8% |
| Thailand |
SET |
1025.3 |
1297.0 |
1307.7 |
0.8% |
27.5% |
|
|
|
|
|
|
|
| Europe |
|
|
|
|
|
|
| UK |
FTSE 100 |
5572.3 |
5793.3 |
5896.2 |
1.8% |
5.8% |
| France |
CAC |
3159.8 |
3389.1 |
3504.6 |
3.4% |
10.9% |
| Germany |
XETRA DAX |
5898.4 |
7232.5 |
7380.6 |
2.0% |
25.1% |
| Italy |
FTSE MIB |
15089.7 |
15511.9 |
15862.3 |
2.3% |
5.1% |
| Spain |
IBEX 35 |
8566.3 |
7652.4 |
7913.4 |
3.4% |
-7.6% |
| Sweden |
OMX Stockholm 30 |
987.9 |
1058.7 |
1064.6 |
0.6% |
7.8% |
| Switzerland |
SMI |
5936.2 |
6655.2 |
6756.1 |
1.5% |
13.8% |
|
|
|
|
|
|
|
| North America |
|
|
|
|
|
|
| United States |
Dow |
12217.6 |
13328.9 |
13343.5 |
0.1% |
9.2% |
|
NASDAQ |
2605.2 |
3044.1 |
3005.6 |
-1.3% |
15.4% |
|
S&P 500 |
1257.6 |
1428.6 |
1433.2 |
0.3% |
14.0% |
| Canada |
S&P/TSX Comp. |
11955.1 |
12202.0 |
12416.0 |
1.8% |
3.9% |
| Mexico |
Bolsa |
37077.5 |
41665.5 |
42386.8 |
1.7% |
14.3% |
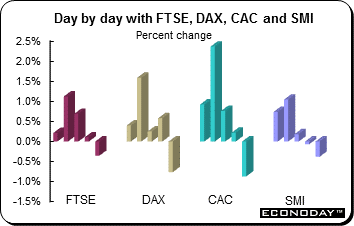 Despite Friday’s decline, equities in Europe and the UK advanced for the week. Investors divided their focus between Brussels as they awaited word from the EU summit taking place on Thursday and Friday as well as the slew of key new U.S. and Chinese economic indicators that were released during the week. Investors also evaluated the slew of earning reports from major U.S. corporations. Although European markets finished in negative territory on Friday, trading had been particularly strong during the week, so some profit taking should come as no surprise. The European summit in Brussels resulted in a bank deal, but overall failed to make much of an impression on the markets. The FTSE was up 1.8 percent, the DAX gained 2.0 percent and the CAC advanced 3.4 percent while the SMI was 1.5 percent higher on the week. Despite Friday’s decline, equities in Europe and the UK advanced for the week. Investors divided their focus between Brussels as they awaited word from the EU summit taking place on Thursday and Friday as well as the slew of key new U.S. and Chinese economic indicators that were released during the week. Investors also evaluated the slew of earning reports from major U.S. corporations. Although European markets finished in negative territory on Friday, trading had been particularly strong during the week, so some profit taking should come as no surprise. The European summit in Brussels resulted in a bank deal, but overall failed to make much of an impression on the markets. The FTSE was up 1.8 percent, the DAX gained 2.0 percent and the CAC advanced 3.4 percent while the SMI was 1.5 percent higher on the week.
European Union leaders agreed to establish a single supervisor for banks in the euro area. The EU will seek to agree on a framework that makes the ECB the main supervisor by January 1st. The new system, which is intended to break the link between banks and governments that is at the root of the region’s financial crisis, will phase in over the next year and could cover all 6,000 euro-area banks by January 1, 2014 — a year later than initially targeted. However, the move does not settle the question of when the European Stability Mechanism will be able to recapitalize banks directly.
French President Francois Hollande reportedly said Friday that the Brussels meeting did not discuss a potential aid request from Spain. Hollande warned against imposing more austerity on Spain, if the country were to ask for a bailout. He said that Spain is making all the necessary efforts to get its public finances back in order. Some market watchers continued to urge caution with Spain's debt crisis still unresolved and with Greece facing new deadlines for fulfilling conditions set by international creditors for the award of further financial support under its bailout deal.
German Chancellor Angela Merkel ruled out allowing Spain to shift bank bailout loans off its balance sheet if they are made before the new system starts operating. “The direct injection of capital into banks can now only happen once the supervisory framework has been put in place, which means now about sometime in 2013, which is different to the expectation of immediate recapitalization once the ESM was set up.” Many investors had been expecting Spain to officially ask for a bailout at some point during the EU summit but Prime Minister Mariano Rajoy said Friday that there had been no decision on a possible bailout request. He reiterated that Spain would ask for a bailout if it needed one.
Bank of England released minutes of its monetary policy committee held earlier this month. At that meeting the MPC left its key interest rate at 0.5 percent and kept the current size of asset purchases unchanged at £375 billion. However the MPC split over whether to add more stimulus in November. There was an agreement that there was little to be gained at this meeting in changing the current quantitative easing program. Some members said there was still considerable scope for asset purchases to provide further stimulus, while other members questioned the magnitude of the impact that lower long term yields on corporate debt and equity would have on the broader economy at the present juncture.
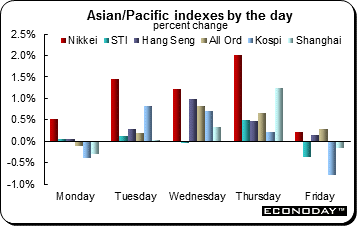 Equities were up on the week with the lone exception of the Taiwan Taiex which slipped 0.4 percent. Despite sagging on Friday, gains ranged from a healthy 5.5 percent (Nikkei) down to 0.2 percent (STI) on the week. Trading Friday was mixed as investors consolidated recent gains and reacted to several disappointing earnings reports including those from Google, Microsoft and Advanced Micro Devices. Equities advanced after a string of Chinese economic data beat estimates, raising hopes for a growth rebound. Fresh signs of recovery in the U.S. housing market also helped lift investor sentiment ahead of the EU summit midweek. Equities were up on the week with the lone exception of the Taiwan Taiex which slipped 0.4 percent. Despite sagging on Friday, gains ranged from a healthy 5.5 percent (Nikkei) down to 0.2 percent (STI) on the week. Trading Friday was mixed as investors consolidated recent gains and reacted to several disappointing earnings reports including those from Google, Microsoft and Advanced Micro Devices. Equities advanced after a string of Chinese economic data beat estimates, raising hopes for a growth rebound. Fresh signs of recovery in the U.S. housing market also helped lift investor sentiment ahead of the EU summit midweek.
Investors in Japan have been rejoicing over the yen’s decline and have bought exporters’ stocks. Japanese shares were up for a fifth straight session, boosted by signs of economic recovery in China and the yen's continued decline against the dollar and the euro on expectations that the Bank of Japan would ease its monetary policy further at its policy meeting on October 30th. The Shanghai Composite was up 1.1 percent for the week but remains the only index tracked here to be down so far in 2012. However, Australian shares rallied last week after China’s September data showed signs that the economy is stabilizing.
Reserve Bank of Australia released minutes of its meeting earlier this month. At that time they lowered their key interest rate by 25 basis points to 3.25 percent. RBA watchers scoured the minutes for guidance to future policy actions but came up empty handed.
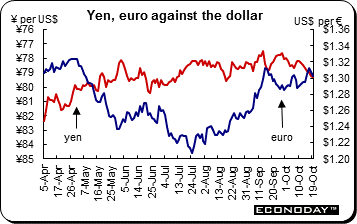 The euro was up against the U.S. dollar last week even though it eased on both Thursday and Friday. The currency was up on bets that the sovereign debt crisis was easing. It declined after Spanish Prime Minister Mariano Rajoy said his nation does not feel under any pressure to ask for a bailout, fueling concern the debt crisis will be prolonged. The euro was down against the yen on speculation that the European Union summit in Brussels will fail to provide clarity on potential financial aid for Spain. The pound gained against the euro after the UK budget deficit narrowed. However, Canada’s dollar weakened to an eight week low against its U.S. counterpart after the September consumer price index data trailed forecasts, putting little pressure on the Bank of Canada to increase interest rates when it meets on Tuesday. The euro was up against the U.S. dollar last week even though it eased on both Thursday and Friday. The currency was up on bets that the sovereign debt crisis was easing. It declined after Spanish Prime Minister Mariano Rajoy said his nation does not feel under any pressure to ask for a bailout, fueling concern the debt crisis will be prolonged. The euro was down against the yen on speculation that the European Union summit in Brussels will fail to provide clarity on potential financial aid for Spain. The pound gained against the euro after the UK budget deficit narrowed. However, Canada’s dollar weakened to an eight week low against its U.S. counterpart after the September consumer price index data trailed forecasts, putting little pressure on the Bank of Canada to increase interest rates when it meets on Tuesday.
China’s yuan advanced for an 11th week as factory output and spending data fueled optimism that the economic slowdown is coming to an end. The currency touched a 19-year high after reports showed growth in industrial production, retail sales and fixed-asset investment accelerated in September. The yen slipped to the weakest level in almost two months against the dollar as speculation that the Bank of Japan will boost stimulus measures when it meets on October 30th sapped demand for the nation’s assets as a haven. At that meeting, the BoJ will release updated economic projections for the 2012 and 2013 fiscal years along with the first set of forecasts for the 12 months beginning in April 2014.
Selected currencies — weekly results
|
|
2011 |
2012 |
% Change |
|
|
Dec 30 |
Oct 12 |
Oct 19 |
Week |
2012 |
| U.S. $ per currency |
|
|
|
|
|
|
| Australia |
A$ |
1.023 |
1.023 |
1.032 |
0.9% |
0.9% |
| New Zealand |
NZ$ |
0.778 |
0.817 |
0.815 |
-0.2% |
4.8% |
| Canada |
C$ |
0.982 |
1.021 |
1.006 |
-1.4% |
2.5% |
| Eurozone |
euro (€) |
1.294 |
1.295 |
1.302 |
0.5% |
0.6% |
| UK |
pound sterling (£) |
1.554 |
1.607 |
1.601 |
-0.4% |
3.0% |
|
|
|
|
|
|
|
| Currency per U.S. $ |
|
|
|
|
|
|
| China |
yuan |
6.295 |
6.267 |
6.254 |
0.2% |
0.7% |
| Hong Kong |
HK$* |
7.767 |
7.752 |
7.750 |
0.0% |
0.2% |
| India |
rupee |
53.065 |
52.875 |
54.025 |
-2.1% |
-1.8% |
| Japan |
yen |
76.975 |
78.430 |
79.290 |
-1.1% |
-2.9% |
| Malaysia |
ringgit |
3.168 |
3.057 |
3.056 |
0.0% |
3.7% |
| Singapore |
Singapore $ |
1.297 |
1.222 |
1.221 |
0.1% |
6.2% |
| South Korea |
won |
1152.450 |
1111.080 |
1104.630 |
0.6% |
4.3% |
| Taiwan |
Taiwan $ |
30.279 |
29.220 |
29.252 |
-0.1% |
3.5% |
| Thailand |
baht |
31.580 |
30.730 |
30.730 |
0.0% |
2.8% |
| Switzerland |
Swiss franc |
0.939 |
0.934 |
0.928 |
0.6% |
1.2% |
| *Pegged to U.S. dollar |
|
|
|
|
|
|
| Source: Bloomberg |
|
|
|
|
|
|
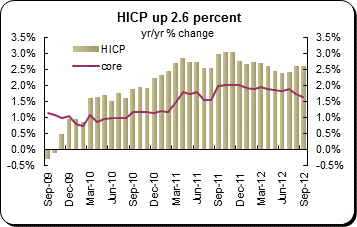 September harmonized index of consumer prices climbed 0.7 percent on the month and 2.6 percent on the year. The underlying picture was once again little changed. Excluding food, drink, tobacco & petrol, the HICP was 1.5 percent higher on the year, matching its mid-quarter result, and without just seasonal goods & petrol, 1.7 percent firmer, also in line with August. Omitting unprocessed food & petrol, the rate was 1.6 percent. Regionally annual inflation slipped 0.2 percentage points in France to 2.2 percent and 0.1 percentage point in Germany to 2.1 percent. However, Italy saw its rate creep up 0.1 percentage points to 3.4 percent and in Spain, where VAT was increased at the start of the month, inflation surged 0.8 percentage points to 3.5 percent. September harmonized index of consumer prices climbed 0.7 percent on the month and 2.6 percent on the year. The underlying picture was once again little changed. Excluding food, drink, tobacco & petrol, the HICP was 1.5 percent higher on the year, matching its mid-quarter result, and without just seasonal goods & petrol, 1.7 percent firmer, also in line with August. Omitting unprocessed food & petrol, the rate was 1.6 percent. Regionally annual inflation slipped 0.2 percentage points in France to 2.2 percent and 0.1 percentage point in Germany to 2.1 percent. However, Italy saw its rate creep up 0.1 percentage points to 3.4 percent and in Spain, where VAT was increased at the start of the month, inflation surged 0.8 percentage points to 3.5 percent.
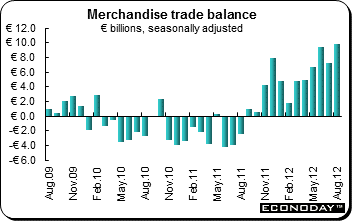 August merchandise trade balance was €9.9 billion following a smaller revised €7.2 billion surplus in July. The unadjusted excess was €6.6 billion after a deficit of €5.7 billion in August 2011. The adjusted August outcome was a record high and reflected a 3.7 percent monthly rebound in exports that more than offset a 2.1 percent increase in imports. Annual growth of the former now stands at 10.0 percent but at just 1.0 percent for the latter. August merchandise trade balance was €9.9 billion following a smaller revised €7.2 billion surplus in July. The unadjusted excess was €6.6 billion after a deficit of €5.7 billion in August 2011. The adjusted August outcome was a record high and reflected a 3.7 percent monthly rebound in exports that more than offset a 2.1 percent increase in imports. Annual growth of the former now stands at 10.0 percent but at just 1.0 percent for the latter.
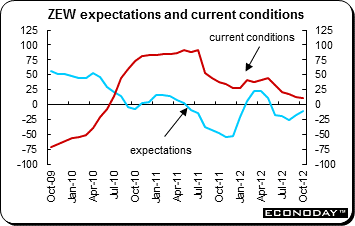 October ZEW survey current conditions balance was down 1.6 points on the month to 10.0, its fifth consecutive decline and also its lowest level since June 2010. However, the drop was the smallest during that period and it may be that the measure is starting to stabilize. Meantime, expectations climbed 6.7 points to minus 11.5, the second consecutive increase and the highest reading since May. The improvement in expectations was attributed to reduced uncertainty in the financial markets in the wake of the ECB's recent actions although the outlook for Eurozone stability as a whole remains a serious potential threat. October ZEW survey current conditions balance was down 1.6 points on the month to 10.0, its fifth consecutive decline and also its lowest level since June 2010. However, the drop was the smallest during that period and it may be that the measure is starting to stabilize. Meantime, expectations climbed 6.7 points to minus 11.5, the second consecutive increase and the highest reading since May. The improvement in expectations was attributed to reduced uncertainty in the financial markets in the wake of the ECB's recent actions although the outlook for Eurozone stability as a whole remains a serious potential threat.
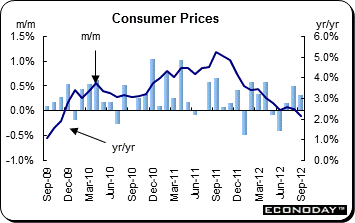 September consumer price index was up 0.4 percent on the month and 2.2 percent on the year. The annual rate is its slowest rate since November 2009. Headline annual inflation benefitted from a sizeable increase in utility bills in September 2011 which saw the rate in this sector slide 0.6 percentage points to 1.7 percent. There was also a drop of almost a full percentage point in communication (3.4 percent from 4.3 percent) and a nearly 2 percentage point drop in education (3.2 percent from 5.1 percent). Furniture & household equipment (1.7 percent from 2.3 percent) similarly biased the headline rate lower. However, it was not all good news as the 12-month rate climbed appreciably in recreation & culture (1.2 percent from 0.6 percent) and higher petrol prices boosted inflation in transportation (2.5 percent from 1.7 percent). The core CPI was up 0.3 percent from mid-quarter and was 2.1 percent higher on the year. September consumer price index was up 0.4 percent on the month and 2.2 percent on the year. The annual rate is its slowest rate since November 2009. Headline annual inflation benefitted from a sizeable increase in utility bills in September 2011 which saw the rate in this sector slide 0.6 percentage points to 1.7 percent. There was also a drop of almost a full percentage point in communication (3.4 percent from 4.3 percent) and a nearly 2 percentage point drop in education (3.2 percent from 5.1 percent). Furniture & household equipment (1.7 percent from 2.3 percent) similarly biased the headline rate lower. However, it was not all good news as the 12-month rate climbed appreciably in recreation & culture (1.2 percent from 0.6 percent) and higher petrol prices boosted inflation in transportation (2.5 percent from 1.7 percent). The core CPI was up 0.3 percent from mid-quarter and was 2.1 percent higher on the year.
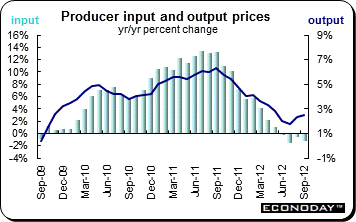 September producer output prices were up 0.5 percent and 2.5 percent on the year. Input prices were 0.2 percent lower and were down 1.3 percent on the year. Output prices were hit by a 2.0 percent monthly advance in the cost of petroleum products which alone accounted for more than half of the headline gain. Elsewhere prices were quite restrained although chemical & pharmaceuticals (0.8 percent) were relatively firm too. As a result, core output prices were up a more modest 0.3 percent on the month and just 1.2 percent on the year for the third month running. Input costs were lifted by a 1.3 percent monthly increase in fuel charges but other areas were generally in negative territory. September producer output prices were up 0.5 percent and 2.5 percent on the year. Input prices were 0.2 percent lower and were down 1.3 percent on the year. Output prices were hit by a 2.0 percent monthly advance in the cost of petroleum products which alone accounted for more than half of the headline gain. Elsewhere prices were quite restrained although chemical & pharmaceuticals (0.8 percent) were relatively firm too. As a result, core output prices were up a more modest 0.3 percent on the month and just 1.2 percent on the year for the third month running. Input costs were lifted by a 1.3 percent monthly increase in fuel charges but other areas were generally in negative territory.
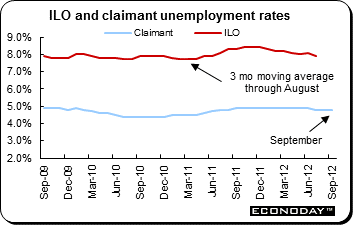 September claimant count joblessness dropped 4,000 on the month and while this followed a slightly smaller revised decline of 14,200 in August, it still constituted the third decline in as many months. Indeed, with the Olympics now safely out of the way, the risk was for a rebound as temporary hiring was run down. The jobless rate held steady at 4.8 percent, its third successive month at this level and so equaled its lowest level since June 2011. The ILO measure of unemployment posted a 50,000 drop over the three months to August, enough to reduce the jobless rate on this definition by 0.2 percentage points to 7.9 percent, its weakest level since the March-May period last year. The latest decline followed a 57,000 drop in May-July and reduced the number of people out of work to 2.528 million, its lowest reading since April-June 2011. The ILO data were almost certainly influenced by the Olympics — part time employment was up 125,000 over the period. However, full time positions also climbed 88,000 suggesting that there was a real improvement in the underlying position too. Headline average earnings grew 1.7 percent on the year, while regular pay was up 2.0 percent. September claimant count joblessness dropped 4,000 on the month and while this followed a slightly smaller revised decline of 14,200 in August, it still constituted the third decline in as many months. Indeed, with the Olympics now safely out of the way, the risk was for a rebound as temporary hiring was run down. The jobless rate held steady at 4.8 percent, its third successive month at this level and so equaled its lowest level since June 2011. The ILO measure of unemployment posted a 50,000 drop over the three months to August, enough to reduce the jobless rate on this definition by 0.2 percentage points to 7.9 percent, its weakest level since the March-May period last year. The latest decline followed a 57,000 drop in May-July and reduced the number of people out of work to 2.528 million, its lowest reading since April-June 2011. The ILO data were almost certainly influenced by the Olympics — part time employment was up 125,000 over the period. However, full time positions also climbed 88,000 suggesting that there was a real improvement in the underlying position too. Headline average earnings grew 1.7 percent on the year, while regular pay was up 2.0 percent.
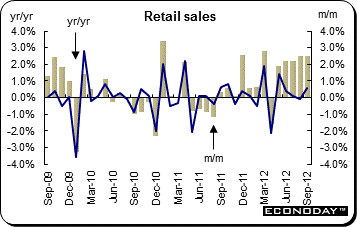 September retail sales were up 0.6 percent and 2.5 percent on the year. Excluding fuel, sales were also 0.6 percent stronger on the month and 2.9 percent above their year ago level. Fuel advanced 0.5 percent from August. September's bounce would have been stronger still but for weakness in the foods sector where purchases slipped 0.2 percent from mid-quarter. Excluding fuel, non-food demand climbed a very respectable 1.2 percent and was 4.3 percent higher on the year. Solid monthly gains were seen in most areas, notably clothing & footwear (2.0 percent) and non-store retailing (1.4 percent). Household goods and the other stores category (both 1.1 percent) advanced while non-specialized stores reported a more modest increase (0.4 percent). September retail sales were up 0.6 percent and 2.5 percent on the year. Excluding fuel, sales were also 0.6 percent stronger on the month and 2.9 percent above their year ago level. Fuel advanced 0.5 percent from August. September's bounce would have been stronger still but for weakness in the foods sector where purchases slipped 0.2 percent from mid-quarter. Excluding fuel, non-food demand climbed a very respectable 1.2 percent and was 4.3 percent higher on the year. Solid monthly gains were seen in most areas, notably clothing & footwear (2.0 percent) and non-store retailing (1.4 percent). Household goods and the other stores category (both 1.1 percent) advanced while non-specialized stores reported a more modest increase (0.4 percent).
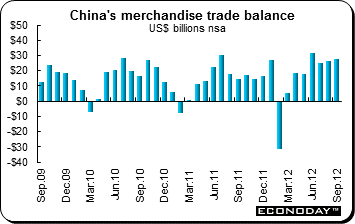 September merchandise trade surplus was 27.67 billion, up from $26.57 in August. Exports rose a better than anticipated 9.9 percent from a year ago and August’s weak 2.7 percent increase. Imports were up 2.4 percent after sinking 2.6 percent the month before. For the nine months through September, exports were up 7.4 percent while imports increased 4.8 percent compared with the same months a year ago. The year to date surplus was $148.31 billion. September merchandise trade surplus was 27.67 billion, up from $26.57 in August. Exports rose a better than anticipated 9.9 percent from a year ago and August’s weak 2.7 percent increase. Imports were up 2.4 percent after sinking 2.6 percent the month before. For the nine months through September, exports were up 7.4 percent while imports increased 4.8 percent compared with the same months a year ago. The year to date surplus was $148.31 billion.
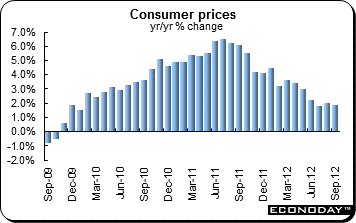 September consumer prices were up 0.3 percent on the month and 1.9 percent from a year ago. For the first nine months the CPI was up 2.8 percent when compared with the same months a year ago. Food prices were up 2.5 percent after climbing 3.4 percent in August from a year ago. Non-food prices were up 1.7 percent on the year after increasing 1.4 percent. All categories were up on the year with the lone exception of transportation & communication which was down for the fifth consecutive month, this time declining 0.2 percent. Increases included clothing which was up 3.4 percent, tobacco & alcohol was up 2.4 percent and housing which was 2.3 percent higher. The urban CPI was up 2.0 percent while the rural index was up 1.7 percent. September consumer prices were up 0.3 percent on the month and 1.9 percent from a year ago. For the first nine months the CPI was up 2.8 percent when compared with the same months a year ago. Food prices were up 2.5 percent after climbing 3.4 percent in August from a year ago. Non-food prices were up 1.7 percent on the year after increasing 1.4 percent. All categories were up on the year with the lone exception of transportation & communication which was down for the fifth consecutive month, this time declining 0.2 percent. Increases included clothing which was up 3.4 percent, tobacco & alcohol was up 2.4 percent and housing which was 2.3 percent higher. The urban CPI was up 2.0 percent while the rural index was up 1.7 percent.
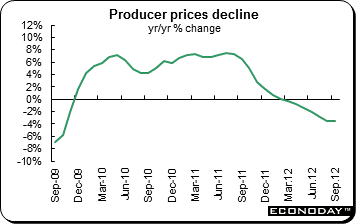 September producer price index dropped 3.6 percent from a year ago. On the month, the PPI edged down 0.1 percent. For the nine months through September, the PPI was down 1.5 percent. Prices were down for all categories with the exception of consumer goods (up 0.1 percent from a year ago) which recorded gains. Within consumer goods, only prices for durables were down 1.1 percent while clothing & related products were up 1.6 percent on the year. Other consumer goods categories recorded minimal gains. Production material prices dropped 4.7 percent while raw materials procurement swooned 4.1 percent from a year ago for a second month. Ferrous metals and non-ferrous metals dropped 12.0 percent and 8.3 percent respectively. September producer price index dropped 3.6 percent from a year ago. On the month, the PPI edged down 0.1 percent. For the nine months through September, the PPI was down 1.5 percent. Prices were down for all categories with the exception of consumer goods (up 0.1 percent from a year ago) which recorded gains. Within consumer goods, only prices for durables were down 1.1 percent while clothing & related products were up 1.6 percent on the year. Other consumer goods categories recorded minimal gains. Production material prices dropped 4.7 percent while raw materials procurement swooned 4.1 percent from a year ago for a second month. Ferrous metals and non-ferrous metals dropped 12.0 percent and 8.3 percent respectively.
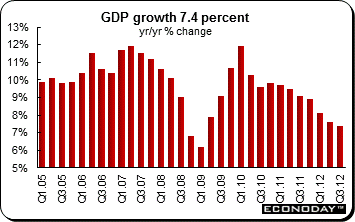 Third quarter gross domestic product was up 7.4 percent from the same quarter a year ago and down from the second quarter’s increase of 7.6 percent. GDP was up 2.2 percent from the previous quarter after a revised 2.0 percent increase in the second quarter. For the nine months in 2012, GDP was up 7.7 percent after growing 7.8 percent in the first half of the year. Third quarter gross domestic product was up 7.4 percent from the same quarter a year ago and down from the second quarter’s increase of 7.6 percent. GDP was up 2.2 percent from the previous quarter after a revised 2.0 percent increase in the second quarter. For the nine months in 2012, GDP was up 7.7 percent after growing 7.8 percent in the first half of the year.
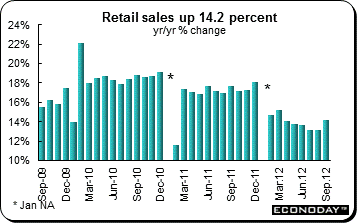 September retail sales were up 14.2 percent from a year ago after increasing 13.2 percent in August. Sales increased 1.46 percent on the month after a 1.36 percent climb in August. For the first nine months of the year, sales increased 14.1 percent. On the year, urban retail sales increased 14.2 percent while rural sales were up 14.7 percent. All sub-categories advanced with the largest gains being recorded by closing (up 20.3 percent), furniture (up 31.4 percent), building & decoration materials (up 26.9 percent) and sports & recreation (up 19.3 percent). September retail sales were up 14.2 percent from a year ago after increasing 13.2 percent in August. Sales increased 1.46 percent on the month after a 1.36 percent climb in August. For the first nine months of the year, sales increased 14.1 percent. On the year, urban retail sales increased 14.2 percent while rural sales were up 14.7 percent. All sub-categories advanced with the largest gains being recorded by closing (up 20.3 percent), furniture (up 31.4 percent), building & decoration materials (up 26.9 percent) and sports & recreation (up 19.3 percent).
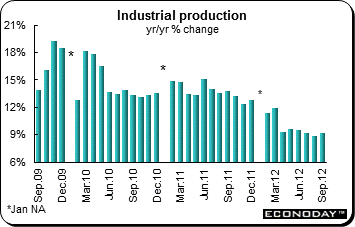 September industrial production was up 9.2 percent on the year after increasing 8.9 percent in August. On the month output was 0.79 percent higher than August. For the year to date, production was up 10.0 percent, slightly down from 10.1 percent in August. Output advanced in all sub-categories. Among the categories that gained 10 percent or more from a year ago were textiles (10.1 percent), chemicals (10.8 percent0, nonferrous minerals (10.0 percent), communication (10.0 percent) and cement (12.0 percent). Transport equipment was up 4.8 percent, motor vehicles gained 6.3 percent and machinery was 8.1 percent higher. September industrial production was up 9.2 percent on the year after increasing 8.9 percent in August. On the month output was 0.79 percent higher than August. For the year to date, production was up 10.0 percent, slightly down from 10.1 percent in August. Output advanced in all sub-categories. Among the categories that gained 10 percent or more from a year ago were textiles (10.1 percent), chemicals (10.8 percent0, nonferrous minerals (10.0 percent), communication (10.0 percent) and cement (12.0 percent). Transport equipment was up 4.8 percent, motor vehicles gained 6.3 percent and machinery was 8.1 percent higher.
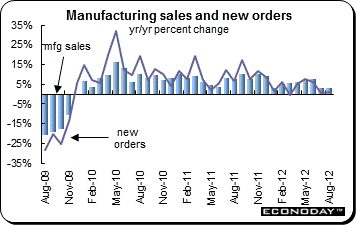 August manufacturing sales rebounded 1.5 percent and were up 3.2 percent on the year. Despite the headline gain, only 11 of the 21 reporting industries posted monthly rises. Among these, petroleum & coal (8.6 percent) led the way ahead of transportation (2.7 percent). Within the latter, motor vehicles (4.4 percent) were especially robust. The other main winner was computer & electronic products (2.3 percent) and non-metallic minerals (2.0 percent). On the downside, primary metals dropped 3.1 percent and fabricated metals were off 1.2 percent. The rest of the survey made generally positive reading. New orders were up a solid 1.4 percent from July and inventories fell 0.1 percent. August manufacturing sales rebounded 1.5 percent and were up 3.2 percent on the year. Despite the headline gain, only 11 of the 21 reporting industries posted monthly rises. Among these, petroleum & coal (8.6 percent) led the way ahead of transportation (2.7 percent). Within the latter, motor vehicles (4.4 percent) were especially robust. The other main winner was computer & electronic products (2.3 percent) and non-metallic minerals (2.0 percent). On the downside, primary metals dropped 3.1 percent and fabricated metals were off 1.2 percent. The rest of the survey made generally positive reading. New orders were up a solid 1.4 percent from July and inventories fell 0.1 percent.
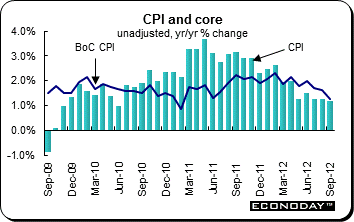 September consumer price index was up 0.2 percent and 1.2 percent from a year ago. Core Bank of Canada CPI which excludes eight volatile items matched the headline's 0.2 percent monthly increase and was up 1.3 percent on the year while excluding just food & energy, the core advanced 0.3 percent and 0.8 percent. Seasonal factors are not particularly marked in September and the adjusted CPI also rose a modest 0.2 percent on the month. Within the adjusted basket, the main upward pressure came from transportation were prices climbed 0.9 percent on the month. Household operations increased 0.2 percent and clothing & footwear, 0.1 percent. However, elsewhere prices were very subdued and there were declines in food and shelter (both 0.2 percent) as well as in health & personal care (0.8 percent), recreation, education & reading (0.3 percent) and alcohol & tobacco (0.1 percent). September consumer price index was up 0.2 percent and 1.2 percent from a year ago. Core Bank of Canada CPI which excludes eight volatile items matched the headline's 0.2 percent monthly increase and was up 1.3 percent on the year while excluding just food & energy, the core advanced 0.3 percent and 0.8 percent. Seasonal factors are not particularly marked in September and the adjusted CPI also rose a modest 0.2 percent on the month. Within the adjusted basket, the main upward pressure came from transportation were prices climbed 0.9 percent on the month. Household operations increased 0.2 percent and clothing & footwear, 0.1 percent. However, elsewhere prices were very subdued and there were declines in food and shelter (both 0.2 percent) as well as in health & personal care (0.8 percent), recreation, education & reading (0.3 percent) and alcohol & tobacco (0.1 percent).
China’s slew of economic data was in traders’ focus during the market week. Investors also awaited developments from the EU summit which took place on Thursday and Friday. U.S. data provided the usual mixed bag but were generally positive, especially on housing.
This week, traders will focus on the FOMC meeting announcement. Also on tap are the Bank of Canada and the Reserve Bank of New Zealand policy decisions. The data highlight of the week will be the sundry flash PMI indexes from Europe and the U.S. The UK will provide its first estimate of third quarter gross domestic product.
| Central Bank activities |
|
| October 23 |
Canada |
Bank of Canada Monetary Policy Announcement |
| October 24 |
United States |
FOMC Monetary Policy Announcement |
|
United States |
Fed Chairman Ben Bernanke Press Conference |
| October 25 |
New Zealand |
Reserve Bank of New Zealand Monetary Policy Announcement |
| |
|
|
| The following indicators will be released this week... |
| Europe |
|
|
| October 24 |
Eurozone |
PMI Manufacturing, Services, Composite (October, flash) |
|
Germany |
PMI Manufacturing, Services, Composite (October, flash) |
|
France |
PMI Manufacturing, Services, Composite (October, flash) |
| October 25 |
Eurozone |
M3 Money Supply (September) |
|
UK |
Gross Domestic Product (Q3.2012 preliminary) |
| |
|
|
| Asia Pacific |
|
|
| October 22 |
Japan |
Merchandise Trade Balance (September) |
| October 24 |
Australia |
Consumer Price Index (Q3.2012) |
| |
|
|
| Americas |
|
|
| October 23 |
Canada |
Retail Sales (August) |
Anne D Picker is the author of International Economic Indicators and Central Banks.
|
