|
The unemployment rate unexpectedly dropped sharply in September. The big question is how reliable is that number' Looking at all possibilities, the answer actually is that earlier numbers may have been too high or that the latest number is too low or really is somewhere in between recent estimates. There is much uncertainty with unemployment data which are based on a relatively small survey sample. Meanwhile, payroll jobs continued modest gains but with upward revisions to prior data.
 Equities posted moderate gains this past week. Stocks were mostly up Monday on a positive and better-than-expected ISM manufacturing report. But gains eased after afternoon comments by Fed Chairman Ben Bernanke that the economy is too sluggish to bring down unemployment significantly. On Tuesday, motor vehicle sales showed strength but the focus was on Europe. Equities were mixed after Spanish Prime Minister Mariano Rajoy said a bailout request is "not imminent." Equities posted moderate gains this past week. Stocks were mostly up Monday on a positive and better-than-expected ISM manufacturing report. But gains eased after afternoon comments by Fed Chairman Ben Bernanke that the economy is too sluggish to bring down unemployment significantly. On Tuesday, motor vehicle sales showed strength but the focus was on Europe. Equities were mixed after Spanish Prime Minister Mariano Rajoy said a bailout request is "not imminent."
At mid-week, most stocks were up after a relatively strong ADP payroll report and gain in ISM non-manufacturing. On Thursday, better-than-forecast initial jobless claims and factory orders led equities up. Also, ECB President Mario Draghi said the bank is ready to start buying government bonds as soon as the necessary conditions are fulfilled. Stocks initially were lifted Friday on a surprise drop in the unemployment rate but equities ended mixed after traders discounted the unemployment rate and focused more on a modest gain in payroll jobs.
Equities were up this past week. The Dow was up 1.3 percent; the S&P 500, up 1.4 percent; the Nasdaq, up 0.6 percent; the Russell 2000, up 0.6 percent; and the Wilshire 5000, up 1.4 percent.
For the year-to-date, major indexes are up as follows: the Dow, up 11.4 percent; the S&P 500, up 16.2 percent; the Nasdaq, up 20.4 percent; the Russell 2000, up 13.8 percent; and the Wilshire 5000, up 15.6 percent.
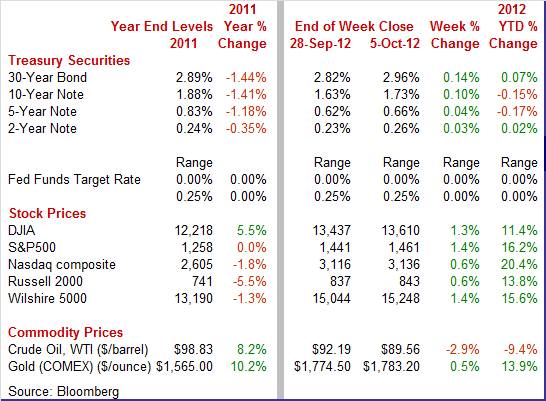
Weekly percent change column reflects percent changes for all components except interest rates. Interest rate changes are reflected in simple differences.
 Treasury rates were little changed the first three days of trading. On Thursday, yields rose on better-than-expected jobless claims and on Fed FOMC minutes that indicated that the Fed is going to focus on job creation and will remain loose until jobs pick up. Treasury rates were little changed the first three days of trading. On Thursday, yields rose on better-than-expected jobless claims and on Fed FOMC minutes that indicated that the Fed is going to focus on job creation and will remain loose until jobs pick up.
Rates rose further Friday on a drop in the U.S. unemployment rate.
For this past week Treasury rates were up as follows: 3-month T-bill, up 1 basis point; the 2-year note, up 3 basis points; the 5-year note, up 4 basis points; the 7-year note, up 7 basis points; the 10-year note, up 10 basis points; and the 30-year bond, up 14 basis points.
 The spot price of crude fell notably this past week with significant daily movement the last three days of trading. On Wednesday, the spot price of West Texas Intermediate fell somewhat under $4 per barrel on disappointing PMI reports from China and Europe. But the spot price rebounded by 3-1/2 dollars on Thursday on a weaker dollar and on increased tensions in the Middle East between Syria and Turkey. Spot crude dipped $2 per barrel Friday on belief that supply was increasing. The spot price of crude fell notably this past week with significant daily movement the last three days of trading. On Wednesday, the spot price of West Texas Intermediate fell somewhat under $4 per barrel on disappointing PMI reports from China and Europe. But the spot price rebounded by 3-1/2 dollars on Thursday on a weaker dollar and on increased tensions in the Middle East between Syria and Turkey. Spot crude dipped $2 per barrel Friday on belief that supply was increasing.
Net for the week, the spot price for West Texas Intermediate declined $2.63 per barrel to settle at $89.56.
The big news of the week was a drop in the September unemployment rate. There are mixed signs on the recovery but it still appears to be soft with the lower unemployment rate still elevated.
 The September jobs report included a surprise drop in the unemployment rate—but it is statistically questionable. Payroll numbers continued modest improvement. The unemployment rate unexpectedly dropped to 7.8 percent, following a decline to 8.1 percent in August. In contrast, payroll jobs in September gained about as expected with a modest 114,000 increase, following a rise in August of 142,000 (originally up 96,000) and an increase of 181,000 in July (previous estimate of 141,000). The net revisions for July and August were up 86,000. The September jobs report included a surprise drop in the unemployment rate—but it is statistically questionable. Payroll numbers continued modest improvement. The unemployment rate unexpectedly dropped to 7.8 percent, following a decline to 8.1 percent in August. In contrast, payroll jobs in September gained about as expected with a modest 114,000 increase, following a rise in August of 142,000 (originally up 96,000) and an increase of 181,000 in July (previous estimate of 141,000). The net revisions for July and August were up 86,000.
 Private payrolls advanced 104,000 in September after increasing 97,000 the month before. The consensus projected a 130,000 increase. So, the private sector actually was softer than total employment. Private payrolls advanced 104,000 in September after increasing 97,000 the month before. The consensus projected a 130,000 increase. So, the private sector actually was softer than total employment.
Private sector strength was in services while goods-producing declined. Private service-providing jobs rose 114,000 in September after a 119,000 increase in August. For the latest month, notable gains were in health care (up 44,000), transportation & warehousing (up 17,000), and financial activities (up 13,000).
The goods-producing sector was down with a 10,000 decrease in September after a 22,000 decline the month before. For the latest month, manufacturing jobs shrank 16,000, construction gained 5,000, and mining was unchanged.
Interestingly, the public sector has been revised up. Government jobs actually rose 10,000 in September after a 45,000 jump in August.
The latest payroll data includes semi-annual benchmark revisions. According to more complete data, payrolls were reportedly undercounted by 386,000 over the April 2011 through March 2012 period, resulting in an average 32,000 higher gain per month than earlier estimated.
Wage inflation has been volatile and the latest number was on the up side. Average hourly earnings growth improved to 0.3 percent in September, following no change in August. Analysts forecast a 0.2 percent rise. The average workweek nudged up to 34.5 hours in September from 34.4 hours in August. Expectations were for 34.4 hours.
Turning to the household survey, the unemployment rate drop reflected an 873,000 spike in household employment versus a 368,000 drop in August. The 873,000 surge in household employment is considered by many as not a credible estimate. The labor force rebounded 418,000 after a 368,000 decrease in August. The 7.8 percent rate is the first time below 8 percent since January 2009.
The household survey is much smaller than the payroll survey and is more volatile. The survey for household employment (and the unemployment rate) is based on about 60,000 households. Each month the survey for the payroll employment data covers about 141,000 businesses and government agencies, representing approximately 486,000 individual worksites. The smaller sample for the household survey can lead to notable swings in the unemployment rate.
Looking ahead, the employment detail is favorable toward personal income but not for manufacturing. Aggregate earnings rose 0.4 percent in September, pointing to a healthy wages & salaries component in personal income. In contrast, production worker hours in manufacturing slipped 0.1 percent, suggesting softness in the manufacturing component of industrial production.
The September jobs report was mixed. The unemployment rate looks better but “may” be a statistical fluke. There are equal possibilities that the August rate was too high and that the September number is too low. More clearly, payroll job growth was modest in September but somewhat better than earlier believed for prior months. However, the September drop in manufacturing jobs is disconcerting. Net, the report was a little better than expected at headline levels but has some caveats.
 Unit sales of cars and trucks hit a new recovery high in September, at 14.9 million for the highest annual rate since March 2008. This is 2.9 percent above August which itself was a multi-year high. Led by import cars, all categories show monthly strength to indicate that consumers, despite soft income and soft expectations for income, are right now willing to make major purchases. Unit data does not always correlate to dollar totals in the monthly retail sales report, but the latest numbers point to a second month of noticeable strength for the September motor vehicle component in retail sales. Unit sales of cars and trucks hit a new recovery high in September, at 14.9 million for the highest annual rate since March 2008. This is 2.9 percent above August which itself was a multi-year high. Led by import cars, all categories show monthly strength to indicate that consumers, despite soft income and soft expectations for income, are right now willing to make major purchases. Unit data does not always correlate to dollar totals in the monthly retail sales report, but the latest numbers point to a second month of noticeable strength for the September motor vehicle component in retail sales.
 According to the ISM September survey, manufacturing is growing again, albeit slowly. The ISM composite index rebounded to 51.5 from 49.6 in August, putting the latest reading back above 50 and into positive territory. According to the ISM September survey, manufacturing is growing again, albeit slowly. The ISM composite index rebounded to 51.5 from 49.6 in August, putting the latest reading back above 50 and into positive territory.
The report showed a number of improvements in the detail. Notably, the new orders index rebounded to 52.3 from 47.1 in August. But employment was the big plus in the September report, rising 3.1 points to a 54.7 level that indicates a surprisingly positive pace of hiring. Negatives include a fourth month of contraction for new export orders, which reflects weak global markets, and a sixth straight contraction in total backlog orders. The ISM report is notably more positive than manufacturing data in the September jobs report.
Another national survey indicates still positive growth in manufacturing. While down for the month, the latest Markit Economics manufacturing index pointed to modest growth in manufacturing. The Markit Economics Purchasing Managers’ Index was down four tenths in September to 51.1 to indicate that business conditions are growing slightly though at a slightly slower rate than August. In fact, this is the slowest rate of monthly growth for this index of the whole recovery.
But a big positive in the report was steady and respectable growth in new orders which are at 52.3. Domestic orders for the sample appear to be even stronger, judging by a fifth month of contraction for new export orders which were at 48.0.
 Construction spending declined 0.6 percent in August, following a 0.4 percent drop in July. The drop August was led by a 1.7 percent decrease in private nonresidential outlays after a 0.5 percent dip the month before. Also, public outlays fell 0.8 percent, following a 0.5 percent decrease in July. Construction spending declined 0.6 percent in August, following a 0.4 percent drop in July. The drop August was led by a 1.7 percent decrease in private nonresidential outlays after a 0.5 percent dip the month before. Also, public outlays fell 0.8 percent, following a 0.5 percent decrease in July.
On the positive side, private residential spending rebounded a notable 0.9 percent, following a 0.1 percent slip in July.
On a year-ago basis, overall construction gained 6.5 percent in August, compared to 10.3 percent the month before.
Basically, housing is still on an uptrend while other components have weakened. Nonresidential outlays may have softened due to uncertainty over the economy, notably fiscal policy. And public outlays clearly have weakened due to revenue shortfalls at the state and local government levels. Housing is being supported by extremely low mortgage rates.
 There is another sign that the growth rate of the economy may be picking up in late 2012. The ISM non-manufacturing index advanced to 55.1 in September from 53.7 the prior month. Notably, the new orders index increased to 57.7 from 53.7 in August. This indicates acceleration in monthly orders to a healthy level. Export orders also show a monthly increase, though just barely, while total backlog orders contracted slightly. There is another sign that the growth rate of the economy may be picking up in late 2012. The ISM non-manufacturing index advanced to 55.1 in September from 53.7 the prior month. Notably, the new orders index increased to 57.7 from 53.7 in August. This indicates acceleration in monthly orders to a healthy level. Export orders also show a monthly increase, though just barely, while total backlog orders contracted slightly.
Another big gain in the report was in business activity which means that non-manufacturers are very busy filling orders. Unfortunately, though, employment isn't very strong, at 51.1 for a 2.7 point drop to indicate a slowing rate of hiring. The sample reports price pressures for raw materials and a slowing in the supply chain, one that's consistent with the increased activity.
The Federal Reserve released the minutes of the September 12 and 13 FOMC meeting. At that time, they implemented a third round of quantitative easing which was seen as a flexible way to respond to the lackluster economy. QE3 is open-ended — that is there is no date specified for its end. Fed staff economists indicated that additional quantitative easing would have a positive impact while some District bank presidents were skeptical. However, the extension of guidance was also controversial. At the meeting, the Fed also extended its guidance to mid-2015 with the intent to provide confidence to financial markets and others that the Fed is committed to low rates and that financial decisions can be made on this commitment. The bottom line is that the Fed implemented QE3 to try to boost asset prices (stocks and home prices) while keeping financing easy-notably in the mortgage market.
The big debate within the Fed was on how effective another round of quantitative easing might be. Not all participants believed additional QE would have benefits exceeding costs. Since the FOMC meeting, at least one non-voting member made public opposition to further QE. The bottom line is that the Fed is in an extremely accommodative mode for quite some time. There will be downward pressure not just on the usual short end of rates during easing but also on the long end. It eventually will be an academic debate on whether QE3 made much difference beyond QE2 since QE2 actually is still in effect with the Fed's reinvestment plan.
The latest economic news has been mixed—a common theme for a while. Although the headline unemployment rate dropped notably, payroll job growth slowed. And again, other indicators were mixed. The recovery continues but at a slow pace.
The first major release is midweek with the Beige Book. The Fed is focusing on the labor market and comments on that sector will be highlighted. The next major mover is international trade with the export component the key focus as growth has been wavering in Asia and Europe. Bond traders will pay special attention to the producer price report as headline inflation has bounced in recent months on volatile energy costs. Finally, we get a reading on consumer sentiment for early October. Various surveys recently have indicated modest improvement in the mood of the consumer.
U.S. Holiday: Columbus Day. Banks & bond market closed. Stocks open.
The NFIB Small Business Optimism Index rose 1.7 points in August to 92.9. Improvement in the economic outlook led the August report followed by a rise in sales expectations and in employment plans. Capital spending plans were also up as were current job openings. On the downside was the assessment of credit conditions and of earnings trends.
NFIB Small Business Optimism Index Consensus Forecast for September 12: 93.3
Range: 92.0 to 93.8
Wholesale inventories jumped 0.7 percent in July against a 0.1 percent decline for wholesale sales. This was the third straight decline for wholesale sales. The inventory-to-sales ratio for the sector was up for a third straight month, to 1.21 which is the highest level of the recovery.
Wholesale inventories Consensus Forecast for August 12: +0.4 percent
Range: 0.0 to +0.7 percent
The Beige Book is being prepared for the October 23-24 FOMC meeting. The labor market is the key focus of the Fed and traders will be parsing for updates on this sector—especially after the latest drop in the unemployment rate combined with slower payroll jobs.
The U.S. Treasury monthly budget report showed a deficit of $190.5 billion in August, compared to a shortfall of $69.6 billion the month before. Eleven months into the fiscal year, the government's deficit slowed further in August and was down 5.6 percent versus this time last year. The biggest improvement was in corporate taxes which were up 31 percent. Individual taxes, which are a much larger source of income for the Treasury, were also higher, up 3.9 percent. Looking ahead, the month of September typically shows a moderate surplus for the month. Over the past 10 years, the average surplus for the month of September has been $20.0 billion and $3.2 billion over the past 5 years. For September 2011, the budget actually was a deficit of $62.8 billion.
Treasury Statement Consensus Forecast for September 12: $0.0 billion
Range: -$2.0 billion to +$77.0 billion.
The U.S. international trade gap in July edged up but much less than expected—largely on a downward revision to June and a July narrowing in the petroleum deficit. The trade deficit widened slightly to $42.0 billion from $41.9 billion in June. But global trade shrank in the latest report. Exports declined 1.0 percent, following a 1.2 percent boost in June. Imports shrank 0.8 percent after a 1.5 percent fall in June. The slight increase in the trade gap was led by the non-petroleum goods gap which expanded to $35.8 billion from $34.2 billion in June. The petroleum deficit decreased to $20.9 billion in July from $22.5 billion the month before. The services surplus eased to $15.3 billion from $15.5 billion in June.
International trade balance Consensus Forecast for August 12: -$44.0 billion
Range: -$46.5 billion to -$41.2 billion
Initial jobless claims edged back up 4,000 in the September 29 week to 367,000, following a 22,000 drop the prior week. The four-week average was unchanged for the week at 375,000 which was 3,000 to 4,000 thousand above late August. Continuing claims showed slight improvement from a month ago with the four-week average down another 13,000 to 3.285 million.
Jobless Claims Consensus Forecast for 10/6/12: 370,000
Range: 362,000 to 375,000
Import prices jumped 0.7 percent in August but it was mostly petroleum related. Import prices excluding petroleum fell 0.2 percent in August which was a 4th straight decline. Prices of imported finished goods continued to edge downward with consumer goods down 0.3 percent for a third straight decline and capital goods down 0.1 percent for the fourth decline in five months. These are the weakest readings of the recovery and point to a lack of pricing power for producers. Export prices, lifted by rising prices for agricultural products, jumped 0.9 percent in August on top of a revised 0.4 percent rise in July.
Import prices Consensus Forecast for September 12: +0.7 percent
Range: 0.0 to +2.2 percent
Export prices Consensus Forecast for September 12: +0.4 percent
Range: +0.1 to +0.9 percent
The producer price index in August jumped 1.7 percent, following a 0.3 percent rise in July. The core rate, which excludes both food and energy, rose 0.2 percent in August after spiking 0.4 percent the prior month. Food inflation posted at 0.9 percent in August after a 0.5 percent boost the month before. Energy spiked a monthly 6.4 percent, following a 0.4 percent dip in July. Gasoline increased 13.6 percent after slipping 3.1 percent in July. Within the core, passenger cars eased 0.2 percent while light trucks jumped 0.6 percent in August.
PPI Consensus Forecast for September 12: +0.8 percent
Range: +0.2 to +1.5 percent
PPI ex food & energy Consensus Forecast for September 12: +0.2 percent
Range: +0.1 to +0.3 percent
The Reuter's/University of Michigan's consumer sentiment index for the final reading for September fell to 78.3 from 79.2 at mid-month. Still, the final September reading compared very well with 74.3 in August as well as July's 72.3. Softness of the last two weeks was centered entirely in the assessment of current conditions which fell 2.6 points from mid-month to a final September reading of 85.7. This was three points below the final August reading which does not generally bode well for monthly economic data in September. But expectations were a big positive, improving one tenth from mid-month to end at 73.5 which was up an extremely strong 8.4 points from August.
Consumer sentiment Consensus Forecast for preliminary October 12: 78.3
Range: 75.0 to 81.0
R. Mark Rogers is the author of The Complete Idiot’s Guide to Economic Indicators, Penguin Books, 2009.
Econoday Senior Writer Mark Pender contributed to this article.
|
