|
The Fed this past week went to the well for one more dip of quantitative easing and another dose of extended guidance. Equities were quite happy with the policy moves but the big questions are will the Fed actions make much difference and will there be any changes in fiscal policy to help' And how soon will the Fed well run dry' Economic news was generally negative.
 Stocks ended the week up notably on euphoria after the Fed’s latest decision to ease further, including QE3. But the week started the other way as traders nervously awaited both the Fed decision on Thursday and a Wednesday decision by Germany's constitutional court on the legality of the Eurozone’s permanent financial rescue fund. Worry was that favorable decisions on both counts had already been priced in. But equities gained Tuesday on increased speculation of further easing by the Fed. Stocks ended the week up notably on euphoria after the Fed’s latest decision to ease further, including QE3. But the week started the other way as traders nervously awaited both the Fed decision on Thursday and a Wednesday decision by Germany's constitutional court on the legality of the Eurozone’s permanent financial rescue fund. Worry was that favorable decisions on both counts had already been priced in. But equities gained Tuesday on increased speculation of further easing by the Fed.
Stocks rose at mid-week after Germany’s Federal Constitutional Court dismissed motions that sought to stop the government from contributing to the European Stability Mechanism rescue facility. However, the judges ruled that the German parliament must approve any increase of the country’s €190 billion of liabilities.
Equities jumped Thursday despite a rise in initial jobless claims as traders reacted enthusiastically to the Fed’s FOMC decision to implement a third round of quantitative easing and to extend guidance that policy rates will remain exceptionally low through mid-2015. The positive mood from the Fed action continued into Friday even though core retail sales and industrial production were disappointing. However, consumer sentiment unexpectedly gained and provided some lift.
Equities were up this past week. The Dow was up 2.2 percent; the S&P 500, up 1.9 percent; the Nasdaq, up 1.5 percent; the Russell 2000, up 2.7 percent; and the Wilshire 5000, up 2.1 percent.
For the year-to-date, major indexes are up as follows: the Dow, up 11.3 percent; the S&P 500, up 16.6 percent; the Nasdaq, up 22.2 percent; the Russell 2000, up 16.7 percent; and the Wilshire 5000, up 16.4 percent.

Weekly percent change column reflects percent changes for all components except interest rates. Interest rate changes are reflected in simple differences.
 The Fed’s latest move did not help the Treasuries market. Basically, traders stayed on the sidelines for most of the week, waiting on the Fed decision on Thursday. Treasury rates eased a little Thursday on a gain in initial jobless claims and on initial reaction to the Fed’s policy moves. But a strong headline number for the CPI on Friday made traders think about inflation implications of QE3 (potentially higher inflation down the road)—and Treasury rates jumped Friday. Also, it became clearer that the Fed’s balance sheet purchases would be in mortgage-backed securities instead of Treasuries. The Fed’s latest move did not help the Treasuries market. Basically, traders stayed on the sidelines for most of the week, waiting on the Fed decision on Thursday. Treasury rates eased a little Thursday on a gain in initial jobless claims and on initial reaction to the Fed’s policy moves. But a strong headline number for the CPI on Friday made traders think about inflation implications of QE3 (potentially higher inflation down the road)—and Treasury rates jumped Friday. Also, it became clearer that the Fed’s balance sheet purchases would be in mortgage-backed securities instead of Treasuries.
For this past week Treasury rates were up as follows: the 5-year note, up 7 basis points; the 7-year note, up 13 basis points; the 10-year note, up 19 basis points; and the 30-year bond, up 27 basis points. The 3-month T-bill and the 2-year note were unchanged.
 The spot price of West Texas Intermediate advanced moderately this past week. After a flat Monday, crude rose somewhat over a half a dollar a barrel on increased speculation of further Fed easing later in the week. WTI nudged down at mid-week on an unexpected rise in crude inventories. The big move was Thursday after the Fed’s FOMC announcement with spot WTI up more than a dollar a barrel (the Fed move had already been partially built in). Crude drifted up the last day of the week on expectations that the Fed’s quantitative easing would boost commodity prices. Also, the dollar declined significantly Thursday and Friday, boosting the cost of oil in dollars. The spot price of West Texas Intermediate advanced moderately this past week. After a flat Monday, crude rose somewhat over a half a dollar a barrel on increased speculation of further Fed easing later in the week. WTI nudged down at mid-week on an unexpected rise in crude inventories. The big move was Thursday after the Fed’s FOMC announcement with spot WTI up more than a dollar a barrel (the Fed move had already been partially built in). Crude drifted up the last day of the week on expectations that the Fed’s quantitative easing would boost commodity prices. Also, the dollar declined significantly Thursday and Friday, boosting the cost of oil in dollars.
Net for the week, the spot price for West Texas Intermediate gained $2.58 per barrel to settle at $99.00.
The big news this past week was that the Fed voted to implement QE3. The Fed’s focus is clearly on reducing unemployment—especially with core inflation soft (and higher headline inflation ignored).
 At the September 12-13 FOMC meeting, the Fed left policy rates unchanged but engaged in other policy measures. Guidance has been extended to at least through mid-2015 for keeping policy rates exceptionally low. The Fed did move into another round of quantitative easing with so-called QE3. The Fed will purchase additional agency mortgage-backed securities at a pace of $40 billion per month. No end date was stated. Essentially, we do not know when QE3 will end. Another interesting issue is that the Fed is not buying Treasuries. There may have been concern that further purchases of Treasuries would have been disruptive of credit markets—and the key focus is lifting the housing market. At the September 12-13 FOMC meeting, the Fed left policy rates unchanged but engaged in other policy measures. Guidance has been extended to at least through mid-2015 for keeping policy rates exceptionally low. The Fed did move into another round of quantitative easing with so-called QE3. The Fed will purchase additional agency mortgage-backed securities at a pace of $40 billion per month. No end date was stated. Essentially, we do not know when QE3 will end. Another interesting issue is that the Fed is not buying Treasuries. There may have been concern that further purchases of Treasuries would have been disruptive of credit markets—and the key focus is lifting the housing market.
The Fed continues to reinvest pay down on agency debt and mortgage-backed securities. Operation Twist also continues as earlier planned through December of this year.
The FOMC pointed to problems in the labor market and implicitly Europe for its latest policy moves. Inflation was seen as benign but that may not last.
“The Committee is concerned that, without further policy accommodation, economic growth might not be strong enough to generate sustained improvement in labor market conditions. Furthermore, strains in global financial markets continue to pose significant downside risks to the economic outlook. The Committee also anticipates that inflation over the medium term likely would run at or below its 2 percent objective.”
Richmond Fed President Jeffrey M. Lacker voted against the statement. He opposed additional asset purchases and preferred to omit the description of the time period over which exceptionally low levels for the federal funds rate are likely to be warranted.
What can the Fed accomplish with new policy' Despite the typical response that interest rates are going to remain low, there is more to it. Rates have been extraordinarily low since late 2008. The Fed’s balance sheet has tripled since late 2008. There is no shortage of liquidity as excess reserves have tracked the balance sheet up. There will be a little help for those seeking to refinance or start a new mortgage—but not really much more than prior to the September 13 policy announcement. In fact, the latest decision lowers the urgency to make a move in the real estate market.
The area of possible impact is on asset prices. There is little reason to hold fixed income assets in terms of rate of return. Of course, there is still the issue of safety. But the Fed’s latest move creates somewhat greater incentive to move into riskier assets—including housing, equities, and even commodities. An immediate effect of the statement was a boost in gold prices. But many wonder whether there will be enough change in mortgage rates from already low rates to make a difference in housing.
Nonetheless, fiscal policy likely is still the main question. The Fed already was extremely accommodative and it is hard to tell much difference from the latest policy decision.
The latest FOMC is one of the quarterly meetings in which the Fed chairman conducts a post-FOMC press conference to discuss changes in Fed forecasts and policy. Emphasis was on the labor market. Chairman Bernanke began his press conference by focusing on weakness in the labor market and indicating that inflation expectations are stable. He stated that the Fed is focusing on quickening the recovery and boosting jobs. Bernanke said that the Fed is not going to be premature in removing policy accommodation and to make sure that the recovery has strengthened. According to the Fed chief, further policy moves will depend on changes in the economy.
Bernanke vaguely referred to “other policy makers”—meaning Congress and the Administration—as being needed to solve the unemployment problem. Bernanke stated that he would like to see a declining unemployment rate over a sustained period, but at the same time he said that he is not sure that Fed tools are that strong now. Bernanke stated that Fed policy cannot cure all ills but new policy is expected to nudge the economy in the right direction.
The bottom line is that the Fed has been extremely accommodative for quite some time and each round of quantitative easing has helped the economy but to a lesser degree the second time and with Operation Twist. The third time may not be the charm and the Fed well is starting to run dry (apologies for the mixed metaphors—but they fit). The pending fiscal cliff is the next big issue for the economy and Fed officials have politely been pointing that out.
 The retail sector is showing signs of softness. Despite a strong headline number, underlying retail sales turned soft in August. Total retail sales in August gained 0.9 percent after a 0.6 percent boost the prior month. The retail sector is showing signs of softness. Despite a strong headline number, underlying retail sales turned soft in August. Total retail sales in August gained 0.9 percent after a 0.6 percent boost the prior month.
Motor vehicle sales jumped 1.3 percent after a 0.1 percent rise in July.
Ex-auto sales increased 0.8 percent, following a 0.8 percent advance in July. Gasoline prices played a big role in lifting retail sales. Gasoline station sales surged 5.5 percent in August, following a 0.4 percent rise in July. However, excluding both autos and gasoline components, sales edged up only 0.1 percent, following a 0.8 percent spike in July (originally up 0.9 percent).
Core components were mixed with strength in building materials and food services & drinking places. Weakness was led by electronics & appliance stories and general merchandise.
After taking into account price effects, retail sales were soft in August. However, some of the sluggish may be simply coming off a strong July. But to keep spending healthy, it still is going to take stronger job growth.
 The consumer's mood brightened substantially in early September according to the consumer sentiment index which was up a very sharp 4.9 points to 79.2. This is just about the best reading of the year. The consumer's mood brightened substantially in early September according to the consumer sentiment index which was up a very sharp 4.9 points to 79.2. This is just about the best reading of the year.
The gain was concentrated entirely in the expectations component which is up 8.3 points to 73.4 which is also just about the best reading of the year. A separate reading on the 12-month outlook is also jumping, up 15 points to 88.
The current conditions component showed little change, edging four tenths lower to an 88.3 level that is also, despite the dip, just about the best level of the year.
Rising gas prices and the prospect of rising food prices do not seem to be a concern right now for the consumer with 1-year inflation expectations slipping one tenth to 3.5 percent and 5-year inflation expectations down 2 tenths to 2.8 percent.
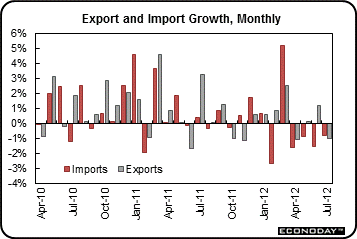
 The U.S. trade balance in July edged up but much less than expected—largely on a downward revision to June and a July narrowing in the petroleum deficit. But consumer demand may be holding up in the U.S. The trade deficit widened slightly to $42.0 billion from $41.9 billion in June (originally $42.9 billion). The U.S. trade balance in July edged up but much less than expected—largely on a downward revision to June and a July narrowing in the petroleum deficit. But consumer demand may be holding up in the U.S. The trade deficit widened slightly to $42.0 billion from $41.9 billion in June (originally $42.9 billion).
But global trade shrank in the latest report. Exports declined 1.0 percent, following a 1.2 percent boost in June. Imports shrank 0.8 percent after a 1.5 percent fall in June.
 The slight increase in the trade gap was led by the non-petroleum goods gap which expanded to $35.8 billion from $34.2 billion in June. The petroleum deficit decreased to $20.9 billion in July from $22.5 billion the month before. The services surplus eased to $15.3 billion from $15.5 billion in June. The slight increase in the trade gap was led by the non-petroleum goods gap which expanded to $35.8 billion from $34.2 billion in June. The petroleum deficit decreased to $20.9 billion in July from $22.5 billion the month before. The services surplus eased to $15.3 billion from $15.5 billion in June.
The decline in exports was led by a $2.4 billion drop in industrial supplies which included a $1.0 billion decrease in exports of nonmonetary gold. This gold subcomponent has been very volatile in recent months and likely represents international financial transactions. Also decreasing were automotive exports (down $0.6 billion) and consumer goods (down $0.4 billion). Food, feeds & beverages gained $1.8 billion and capital goods advanced $0.1 billion, led by civilian aircraft (up $1.4 billion).
Import detail was mixed. Industrial supplies fell $2.1 billion with $1.4 billion of this attributed to crude oil falling. Businesses are being cautious about equipment investment as capital goods excluding autos dipped $0.6 billion. But businesses may be a little optimistic about consumer demand. Auto imports gained $0.5 billion while consumer goods rose $0.4 billion.
Overall, manufacturers are dealing with recession in Europe and slower growth in Asia. But the U.S. economy increasingly is being supported by the consumer. And it is almost certain that the deficit will widen the next report on higher oil prices.
 Industrial production declined in August but it was not quite as ugly as at the headline level. The manufacturing component fell in August weakness was led by mining and utilities. Overall industrial production fell 1.2 percent, following a 0.5 percent jump in July. Industrial production declined in August but it was not quite as ugly as at the headline level. The manufacturing component fell in August weakness was led by mining and utilities. Overall industrial production fell 1.2 percent, following a 0.5 percent jump in July.
By major components, manufacturing declined 0.7 percent, following an increase of 0.4 percent in July (previously estimated at up 0.5 percent). Expectations were for a 0.2 percent dip for the manufacturing component.
Motor vehicles production tugged down on manufacturing, decreasing 4.0 percent in August, following a 2.7 percent rebound in July. But other components were soft as manufacturing excluding motor vehicles dipped 0.4 percent, following a 0.2 percent gain the prior month.
But weakness was greatest outside of manufacturing. In August, mining output fell 1.8 percent after a 1.0 percent gain in July. The August drop was partially tied to hurricane related shutdowns in the oil industry. Utilities output decreased 3.6 percent after a 1.3 percent gain in July.
Overall capacity utilization slipped to 78.2 percent from 79.2 percent in July.
The bottom line is that non-manufacturing components were mainly behind the sharp drop in overall industrial production. But manufacturing also has lost steam.
 Higher gasoline prices led to a surge in consumer prices in August. The consumer price index in August jumped 0.6 percent, following no change the prior month. Excluding food and energy, the CPI gained a more modest 0.1 percent, matching a 0.1 percent rise in July. Expectations were for a 0.2 percent rise. Higher gasoline prices led to a surge in consumer prices in August. The consumer price index in August jumped 0.6 percent, following no change the prior month. Excluding food and energy, the CPI gained a more modest 0.1 percent, matching a 0.1 percent rise in July. Expectations were for a 0.2 percent rise.
By major components, energy jumped a monthly 5.6 percent after declining 0.3 percent in July. Gasoline on a seasonally adjusted basis jumped 9.0 percent, following a 0.3 percent increase the prior month. Food prices rose 0.2 percent after edging up 0.1 percent in July.
 Year-on-year, overall CPI inflation rose to 1.7 percent in August from 1.4 percent the month before (seasonally adjusted). The core rate eased to 1.9 percent from a 2.1 percent in July on a year-ago basis. On an unadjusted year-ago basis, the headline CPI was up 1.7 percent, compared to 1.4 percent in July. The core was up 1.9 percent versus 2.1 percent in July, not seasonally adjusted. Year-on-year, overall CPI inflation rose to 1.7 percent in August from 1.4 percent the month before (seasonally adjusted). The core rate eased to 1.9 percent from a 2.1 percent in July on a year-ago basis. On an unadjusted year-ago basis, the headline CPI was up 1.7 percent, compared to 1.4 percent in July. The core was up 1.9 percent versus 2.1 percent in July, not seasonally adjusted.
There is something for both wings of the Fed in the report. Headline is strong and a concern for hawks while the core is soft for the doves.
 Food and energy costs led to a surge in producer prices in August. Overall PPI inflation jumped 1.7 percent, following a 0.3 percent rise in July. The core rate, which excludes both food and energy, rose 0.2 percent in August after spiking 0.4 percent the prior month. Food and energy costs led to a surge in producer prices in August. Overall PPI inflation jumped 1.7 percent, following a 0.3 percent rise in July. The core rate, which excludes both food and energy, rose 0.2 percent in August after spiking 0.4 percent the prior month.
Food inflation posted at 0.9 percent in August after a 0.5 percent boost the month before. Energy spiked a monthly 6.4 percent, following a 0.4 percent dip in July. Gasoline increased 13.6 percent after slipping 3.1 percent in July.

Within the core, passenger cars eased 0.2 percent while light trucks jumped 0.6 percent in August.
For the overall PPI, the year-ago rate in August was 2.0 percent, up sharply from 0.5 percent the month before (seasonally adjusted). The core rate in August held steady at 2.6 percent. On a not seasonally adjusted basis for August, the year-ago headline PPI was up 2.0 percent, while the core was up 2.5 percent.
The consumer sector was mixed this past week while manufacturing slipped further. Inflation numbers were mixed with headline numbers bumped up by energy. The Fed took an aggressive policy stance, but the big questions are whether the moves will have much impact and whether the Fed gets any help from fiscal policy.
Manufacturing and housing are the key points of focus. After a decline in August industrial production, the September numbers for Philly Fed and Empire State are going to get extra attention. Housing in recent months has been on a moderate uptrend. The economy needs this new source of growth and updates come with NAHB housing market index, housing starts, and existing home sales. We will see summary numbers on the direction of the economy with leading and coincident indicators on Thursday.
The Empire State manufacturing index fell a sharp 13.24 points to minus 5.85 in August from July's plus 7.39. The negative reading for August indicates monthly contraction in general business conditions. This was the first negative figure since minus 7.22 for October 2011. The new orders index’s rate of contraction worsened somewhat, slipping to minus 5.50 from minus 2.69 in July.
Empire State Manufacturing Survey Consensus Forecast for September 12: -2.00
Range: -10.00 to 5.00
The U.S. current account deficit deepened to $137.3 billion in the first quarter from a revised deficit of $118.7 billion in the fourth quarter and $108.2 billion deficit in the third quarter. The first-quarter deficit was the largest since early on in the recession in fourth-quarter 2008. A wider trade deficit on goods & services, especially on the goods side, deepened the first quarter's red ink though the biggest negative factor is a lower surplus on investment income. The current account as a percentage of GDP is at 3.6 percent, up 5 tenths from the fourth quarter and up 7 tenths from the third.
Current account Consensus Forecast for Q2 12: -$125.0 billion
Range: -$130.0 billion to -$120.0 billion
NAHB housing market index in August rose another 2 points to 37. This was the fourth straight month of significant improvement that puts the index at its best level since early 2007. Current sales and traffic show the strongest gains of the report's three components. The monthly gain for six-month sales is incremental but the level is the highest of all components.
NAHB housing market index Consensus Forecast for September 12: 38
Range: 35 to 40
Housing starts in July eased 1.1 percent but followed a 6.8 percent rebound the month before. After a strong June, the minor slippage in July looks good relative to what it might have been. The July pace of 0.746 million units was up 21.5 percent on a year-ago basis. In July, the dip was led by the single-family component which decreased 6.5 percent after a 4.7 percent rise in June. The multifamily component, however, increased 12.4 percent, coincidentally matching the gain in June. Housing permits rebounded 6.8 percent in July after a 3.1 percent decline in June. The July rate of 0.812 million units was up 29.5 percent on a year-ago basis.
Housing starts Consensus Forecast for August 12: 0.768 million-unit rate
Range: 0.740 million to 0.780 million-unit rate
Housing permits Consensus Forecast for August 12: 0.802 million-unit rate
Range: 0.760 million to 0.844 million-unit rate
Existing home sales rebounded 2.3 percent in July to a 4.47 million annual rate in a gain that partially reversed a 5.4 percent decline in June. The annual rate hit its recovery peak in January this year as warm weather spurred counter-seasonal buying. The rate has since been choppy, but hopefully the July gain was be the beginning of a new upswing. Supply relative to the sales rate was at 6.4 months, down from 6.5 months in June and compared against 9.3 months a year ago when distressed properties were flooding the market.
Existing home sales Consensus Forecast for August 12: 4.55 million-unit rate
Range: 4.45 to 4.61 million-unit rate
Initial jobless claims for the September 8 week were up 15,000 to 382,000, thanks in part to Tropical Storm Isaac. The Labor Department indicated that, because of the storm, several states reported in the week increased claims totaling an unadjusted 9,000. Distortions add importance to the four-week average, which at 375,000, was noticeably above the month-ago trend which was in the mid to high 360,000 area. Another factor clouding this report was the holiday shortened September 8 week for initial claims. This magnifies the impact of adjustments.
Jobless Claims Consensus Forecast for 9/15/12: 373,000
Range: 365,000 to 390,000
The Markit PMI manufacturing flash index posts this week for September activity. The final manufacturing PMI from Markit Economics for August was revised 4 tenths lower from the flash estimate to a 51.5 level that indicated modest monthly growth in business activity at just about the same level of growth as July's 51.4 reading. But unfortunately, the downward revision to the final reading in August was centered in new orders which were at a final 51.9 which is 7 tenths slower than the flash reading. New orders for this report are showing the slowest rate of monthly growth of the recovery.
Markit PMI manufacturing flash index Consensus Forecast for September 12: 51.5
Range: 51.0 to 52.5
The general business conditions index of the Philadelphia Fed's Business Outlook Survey improved to minus 7.1 for its August reading versus minus 12.9 in July. A minus reading indicates monthly contraction and, in this case, a less severe pace than the monthly contraction in July. New orders also showed improvement but remained in negative territory, rising to minus 5.5 from July's minus 6.9. This was the best reading since May when new orders first began to contract.
Philadelphia Fed survey Consensus Forecast for September 12: -4.0
Range: -10.0 to -0.2
The Conference Board's index of leading indicators in July rebounded 0.4 percent, offsetting the June decline of 0.4 percent. Improvement in jobless claims and in building permits led the increase in the overall index with each component having a contribution of 0.18 percentage points. Also with positive contributions were the report's credit reading, the stock market, and the report's imputed readings for new orders on both consumer and capital goods. In a rare showing, the rate spread, though a positive contributor, is back in the pack a bit which reflects the very low levels of long Treasury rates (low rates imply low borrowing demand). One glaring negative was the new orders reading from the ISM's manufacturing report which has been signaling monthly contraction for two months running. Another negative was consumer expectations. The manufacturing workweek was neutral.
Leading indicators Consensus Forecast for August 12: 0.0 percent
Range: -0.3 to +0.3 percent
Quadruple Witching
R. Mark Rogers is the author of The Complete Idiot’s Guide to Economic Indicators, Penguin Books, 2009.
Econoday Senior Writer Mark Pender contributed to this article.
|
