|
This past week, news from economic indicators was mixed but mostly on the disappointing side. In contrast to the prior week, company earnings and revenues generally beat lowered expectations, more than offsetting indicator news.
 Equity indexes were mostly up modestly for the past week. But there were headwinds at week’s open with an unexpected decline in retail sales and a downgrade in the global economic outlook by the International Monetary Fund. But gains in Visa and other financials and a rally in oil prices helped to limit losses. Equities rebounded Tuesday on testimony by Fed Chairman Ben Bernanke that the Fed is prepared to act to boost growth if unemployment does not improve. Equity indexes were mostly up modestly for the past week. But there were headwinds at week’s open with an unexpected decline in retail sales and a downgrade in the global economic outlook by the International Monetary Fund. But gains in Visa and other financials and a rally in oil prices helped to limit losses. Equities rebounded Tuesday on testimony by Fed Chairman Ben Bernanke that the Fed is prepared to act to boost growth if unemployment does not improve.
Equities gained further at mid-week on unexpectedly healthy housing starts and better than anticipated earnings reports. Notable and favorable company news came from Bank of America, Bank of New York Mellon, and Honeywell International. Equities were mostly up Thursday despite a jump in initial jobless claims, a fall in existing home sales, and a weak Philly Fed report. The claims rebound was seen as a technical offset to the prior week’s sharp drop. But upward lift came largely from technology companies' outlooks and earnings—including IBM, eBay, and Textron. Other sectors also had favorable reports.
But the week’s gains—and a three-day rally--for equities were bumped down at week’s end. Corporate news was mixed with notables GE up but Advanced Micro Devices and Chipotle Mexican Grill disappointing. Also, a deal by Eurozone finance ministers for an initial phase of a bailout for Spanish banks left investors mostly out in the cold with little relief. Spanish yields hit a euro-era high. Finally, China indicated that it would not relax property control policies, raising concern of slower growth.
Overall, investors had largely lowered expectations for second quarter earnings season and most numbers this past week topped the downgraded projections. But basically the bar has been lowered due to soft economic data.
Equities were mostly up this past week. The Dow was up 0.4 percent; the S&P 500, up 0.4 percent; the Nasdaq, up 0.6 percent; and the Wilshire 5000, up 0.3 percent. The Russell 2000 declined 1.2 percent.
For the year-to-date, major indexes are up as follows: the Dow, up 5.0 percent; the S&P 500, up 8.4 percent; the Nasdaq, up 12.3 percent; the Russell 2000, up 6.8 percent; and the Wilshire 5000, up 8.1 percent.
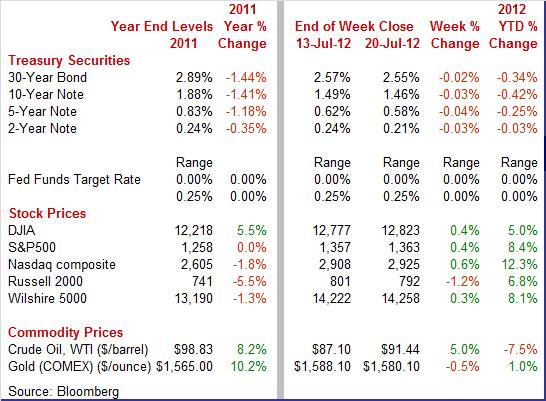
Weekly percent change column reflects percent changes for all components except interest rates. Interest rate changes are reflected in simple differences.
 Treasury yields fell modestly this past week with mostly little daily volatility. Slight standouts were on Tuesday and Friday. But yields are extremely low due to continued flight to safety over European sovereign debt worries and on expectations that the Fed will continue to be a strong buyer at least through 2014. Treasury yields fell modestly this past week with mostly little daily volatility. Slight standouts were on Tuesday and Friday. But yields are extremely low due to continued flight to safety over European sovereign debt worries and on expectations that the Fed will continue to be a strong buyer at least through 2014.
Rates firmed slightly Tuesday on stronger-than-expected industrial production. But the biggest move (though still modest) was on Friday with a dip in rates after Spanish officials indicated that the recession in that country would continue into 2013 and as Spanish yields climbed to a Eurozone era high.
 Though movement was modest, 5-year Treasury yields hit record lows, reaching down as much to 0.57 percent. The 10-year note slipped to just above its record low. Though movement was modest, 5-year Treasury yields hit record lows, reaching down as much to 0.57 percent. The 10-year note slipped to just above its record low.
For this past week Treasury rates were down as follows: the 2-year note, down 3 basis points; the 5-year note, down 4 basis points; the 7-year note, down 3 basis points; the 10-year note, down 3 basis points; and the 30-year bond, down 2 basis points. The 3-month T-bill was unchanged.
 The big moves for oil were Monday, Thursday, and Friday. The spot price of West Texas Intermediate rose more than a dollar a barrel Monday on a better-than-expected headline number for Empire State manufacturing. For no apparent reason, oil traders ignored the negative orders index in the report. Favorable industrial production and housing starts reports nudged up crude on Tuesday and Wednesday. But on Thursday, WTI jumped somewhat under $3 a barrel on increased tension in the Middle East as an Israeli official blamed Lebanon’s Iranian-backed Hezbollah organization for the killing of Israeli tourists in Bulgaria and on further rebellion in Syria. Crude dipped a little over a dollar a barrel on Friday on worries that European debt problems are slowing economic growth. The big moves for oil were Monday, Thursday, and Friday. The spot price of West Texas Intermediate rose more than a dollar a barrel Monday on a better-than-expected headline number for Empire State manufacturing. For no apparent reason, oil traders ignored the negative orders index in the report. Favorable industrial production and housing starts reports nudged up crude on Tuesday and Wednesday. But on Thursday, WTI jumped somewhat under $3 a barrel on increased tension in the Middle East as an Israeli official blamed Lebanon’s Iranian-backed Hezbollah organization for the killing of Israeli tourists in Bulgaria and on further rebellion in Syria. Crude dipped a little over a dollar a barrel on Friday on worries that European debt problems are slowing economic growth.
Net for the week, the spot price for West Texas Intermediate rose $4.34 per barrel to settle at $91.44.
The recovery clearly is not as robust as it had been even though it never was really robust. The big question mark is the health of the consumer sector. Separately, manufacturing may or may not be slowing and housing may or may not be continuing a mild uptrend.
 Retail sales in June were much softer than expected, including auto sales which contradicted manufacturers' numbers for the month. Retail sales in June fell 0.5 percent, following a 0.2 percent decrease in May. Retail sales in June were much softer than expected, including auto sales which contradicted manufacturers' numbers for the month. Retail sales in June fell 0.5 percent, following a 0.2 percent decrease in May.
Motor vehicle sales dropped 0.6 percent, following a 0.8 boost in May. In the latest month, unit new auto sales posted a moderate gain, which should show up in personal consumption expenditures later this month.
Excluding motor vehicles, retail sales decreased 0.4 percent after declining 0.4 percent in May. Market expectations were for a 0.1 percent gain. Gasoline sales were a big factor, dropping 1.8 percent, following a 2.0 percent fall in May.
Sales excluding autos and gasoline in June slipped 0.2 percent, following a 0.1 percent dip in May (originally down 0.1 percent). Core sales showed widespread weakness in June.
The consumer sector has lost momentum with total sales excluding autos and gasoline in negative territory for three months in a row. Personal consumption numbers in the personal income report are likely to be a little better for June after the Commerce Department swaps out survey numbers for autos with actual numbers from manufacturers. Still, the consumer is not carrying as much of the burden of the recovery as earlier with job growth so sluggish.
 Housing starts in June rebounded 6.9 percent after dropping 4.8 percent in May. The June pace of 0.760 million units was up 23.6 percent on a year-ago basis. For the latest month the single-family and multifamily components both gained. Single-family starts increased 4.7 percent after a 2.2 percent in May. The multifamily component-which is volatile-rebounded 12.8 percent, following an 19.3 percent drop in May. Housing starts in June rebounded 6.9 percent after dropping 4.8 percent in May. The June pace of 0.760 million units was up 23.6 percent on a year-ago basis. For the latest month the single-family and multifamily components both gained. Single-family starts increased 4.7 percent after a 2.2 percent in May. The multifamily component-which is volatile-rebounded 12.8 percent, following an 19.3 percent drop in May.
By region, starts in June were led by a 36.9 percent jump in the West Census region with the Northeast gaining 22.2 percent. The Midwest declined 7.3 percent while the South decreased 4.2 percent.
 Housing permits have been bumped around recently by volatility in the multifamily component but also appear to be on a modest uptrend. Permits slipped 3.7 percent in June but followed a sharp 8.4 percent surge the prior month. Permits in June posted at an annualized pace of 0.755 million units. Housing permits have been bumped around recently by volatility in the multifamily component but also appear to be on a modest uptrend. Permits slipped 3.7 percent in June but followed a sharp 8.4 percent surge the prior month. Permits in June posted at an annualized pace of 0.755 million units.
There are signs of mixed momentum for housing. On the plus side, the housing market "has turned the corner" according to the nation's home builders whose housing market index surged 6 points in July to 35. The monthly gain was the largest in nearly 10 years while the level, which has been moving higher all year, is now at its highest of the recovery, since March 2007. On the negative side, existing home sales slipped in the latest report.
 Existing home sales fell a surprising 5.4 percent in June to a 4.37 million annual rate which was the lowest of the year. Declines appeared for both single-family homes and condos and declines sweep all regions. But prices are higher, at least the median for this series which is up a strong 5.0 percent from May for a year-on-year plus 7.9 percent. The median price, at $189,400, was the highest in 2 years. Existing home sales fell a surprising 5.4 percent in June to a 4.37 million annual rate which was the lowest of the year. Declines appeared for both single-family homes and condos and declines sweep all regions. But prices are higher, at least the median for this series which is up a strong 5.0 percent from May for a year-on-year plus 7.9 percent. The median price, at $189,400, was the highest in 2 years.
June's weak sales total raised supply on the market to 6.6 months at the current sales rate from 6.4 months. The report notes that distressed properties are still weighing down the markets in the Midwest and Northeast. This report marks a step backwards for the housing sector which had been enjoying a small run of positive news. Nonetheless, there has been notable progress on the housing front as the June sales number is 28.9 percent higher than the recent low seen in July 2010 for 3.39 million units.
 Overall industrial production rebounded 0.4 percent in June, following a 0.2 percent decline in May. Overall industrial production rebounded 0.4 percent in June, following a 0.2 percent decline in May.
By major components, manufacturing gained 0.7 percent after falling 0.7 percent in May. Motor vehicles output added significantly to manufacturing, rebounding 1.9 percent in June after a 2.2 percent decline in May. Manufacturing excluding motor vehicles was quite strong also gaining 0.6 percent in June, following a 0.5 percent drop in May.
In June, mining output gained 0.7 percent, following no change the prior month. Utilities output declined 1.9 percent, following a 2.8 percent boost in May.
Overall capacity utilization improved to 78.9 percent from 78.7 percent in May. Analysts expected 79.2 percent.
 The gains in manufacturing were widespread by industry. The production index for durable goods rose 0.8 percent in June after having declined 0.6 percent in May. In June, most durable goods industries exhibited gains, with the largest increases registered by machinery, which advanced 2.3 percent, and motor vehicles and parts, which rose 1.9 percent. The production of nondurables advanced 0.5 percent in June after having fallen 0.7 percent in May. Among the major components of nondurables, sizable increases were recorded in June by the indexes for textile and product mills, printing and support, petroleum and coal products, chemicals, and plastics and rubber products. The gains in manufacturing were widespread by industry. The production index for durable goods rose 0.8 percent in June after having declined 0.6 percent in May. In June, most durable goods industries exhibited gains, with the largest increases registered by machinery, which advanced 2.3 percent, and motor vehicles and parts, which rose 1.9 percent. The production of nondurables advanced 0.5 percent in June after having fallen 0.7 percent in May. Among the major components of nondurables, sizable increases were recorded in June by the indexes for textile and product mills, printing and support, petroleum and coal products, chemicals, and plastics and rubber products.
The good news is that manufacturing had a better-than-expected month in June. But the big question mark remains whether demand is slowing as reflected in softer numbers for new orders in many manufacturing surveys for June and July. The Empire State and Philly Fed reports were the most recent and disappointing manufacturing surveys.
 The headline index for Empire State in July rose more than 5 points to 7.39 to indicate monthly growth in general business conditions. But this was offset by a decline in new orders. Weakness in orders points to slowing activity ahead for the New York region's manufacturing sector and undercuts a rise in the report's headline as the new orders index fell to minus 2.69 to indicate monthly contraction from what was no more than very soft growth in June at plus 2.18. Unfilled orders also contracted at a very steep minus 13.58. The headline index for Empire State in July rose more than 5 points to 7.39 to indicate monthly growth in general business conditions. But this was offset by a decline in new orders. Weakness in orders points to slowing activity ahead for the New York region's manufacturing sector and undercuts a rise in the report's headline as the new orders index fell to minus 2.69 to indicate monthly contraction from what was no more than very soft growth in June at plus 2.18. Unfilled orders also contracted at a very steep minus 13.58.
 The latest Philly Fed report was not pretty but at least it was not as ugly as the prior month. That is, the rate of contraction eased in the Mid-Atlantic manufacturing sector in July. General business conditions improved to minus 12.9 from June's minus 16.6. Forward momentum is still not good even though the new orders index rose to minus 6.9 from June's minus 18.8. New orders are declining—just not as rapidly. The latest Philly Fed report was not pretty but at least it was not as ugly as the prior month. That is, the rate of contraction eased in the Mid-Atlantic manufacturing sector in July. General business conditions improved to minus 12.9 from June's minus 16.6. Forward momentum is still not good even though the new orders index rose to minus 6.9 from June's minus 18.8. New orders are declining—just not as rapidly.
The two most recent Fed regional manufacturing surveys are not encouraging. However, a caveat is that these two surveys—especially Philly Fed—have over the last year or so reported weaker conditions than national data on manufacturing.
 In June, consumer prices were soft on a decline in energy. Meanwhile, the core rate was still stubbornly on the warm side. The consumer price index was unchanged in June after falling 0.3 percent in May. Excluding food and energy, the CPI rose 0.2 percent, following a 0.2 percent increase in May. In June, consumer prices were soft on a decline in energy. Meanwhile, the core rate was still stubbornly on the warm side. The consumer price index was unchanged in June after falling 0.3 percent in May. Excluding food and energy, the CPI rose 0.2 percent, following a 0.2 percent increase in May.
By major components, energy declined 1.4 percent after falling a sharp 4.3 percent in May. Gasoline fell 2.0 percent, following a plunge of 6.8 percent the prior month. Food prices in June gained 0.2 percent after no change in May.
 Within the core, the shelter index posted its smallest increase since September, the index for used cars and trucks was unchanged after a series of increases, and the index for airline fares declined. However, the index for medical care posted its largest increase since 2010 and the indexes for apparel and recreation both rose substantially in June. Within the core, the shelter index posted its smallest increase since September, the index for used cars and trucks was unchanged after a series of increases, and the index for airline fares declined. However, the index for medical care posted its largest increase since 2010 and the indexes for apparel and recreation both rose substantially in June.
Year-on-year, overall CPI inflation held steady at 1.7 percent in June (seasonally adjusted). The core rate nudged down to 2.2 percent from at 2.3 in May percent on a year-ago basis.
The June inflation report was good news for the consumer wallet-spending power was not eroded by inflation. In fact, released the same morning as the CPI, real average hourly earnings for all employees rose 0.2 percent in June. This change resulted from a 0.3 percent increase in average hourly earnings combined with an unchanged CPI. Real average weekly earnings rose 0.5 percent over the month due to the increase in real average hourly earnings combined with a 0.3 percent increase in the average workweek.
But the latest CPI report likely did not change Fed officials' varying views on the risk of higher inflation. The doves will point to headline numbers while the hawks will see little progress on the core rate and with upward pressure showing up in food price inflation.
 The Conference Board's index of leading indicators is adding to the view that the economy is sluggish. The index fell 0.3 percent in June after a 0.4 percent boost the prior month. Weighing down on the June number were the new orders index (minus 0.16 percentage contribution), consumer expectations (minus 0.13 percent contribution), building permits (minus 0.10 percentage contribution), jobless claims, stock prices, and new orders for nondefense capital goods excluding aircraft. The Conference Board's index of leading indicators is adding to the view that the economy is sluggish. The index fell 0.3 percent in June after a 0.4 percent boost the prior month. Weighing down on the June number were the new orders index (minus 0.16 percentage contribution), consumer expectations (minus 0.13 percent contribution), building permits (minus 0.10 percentage contribution), jobless claims, stock prices, and new orders for nondefense capital goods excluding aircraft.
On the positive side, the leader continued to be the rate spread between the 10-year Treasury and fed funds rate (0.16 percent contribution). Also slightly positive were the leading credit index, and new orders for consumer goods.
But the economy is still growing, according to the coincident index which rose 0.2 percent in June, matching May's pace.
Surprisingly, the latest Beige Book was a little more optimistic than recent government and private sector reports, although it was still somewhat subdued. Autos and housing were the notable positives.
The Beige Book characterized the economy as expanding at a "modest to moderate pace."
Retail sales increased slightly in most Districts. Autos and housing were the notable positives. Tourism activity remained strong. Housing markets were largely positive with increases in sales and construction while home inventories declined. Rental markets continued to strengthen. Loan demand grew modestly.
However, the manufacturing sector got a downgrade as manufacturing activity continued to expand slowly in most Districts.
Inflation pressures were seen as easing overall due to declining energy costs. Wage pressures remained modest, except for highly skilled workers in information technology, health care, transportation, and manufacturing. However, it was noted that corn prices have been pushed up by drought conditions in some Districts.
Overall, the Beige Book was mostly consistent with the story that the recovery has slowed. The bottom line is that the economy is still too sluggish and the lack of broad inflation gives the Fed room for additional easing. However, the key question for additional easing at the July 31-August 1 FOMC will be the cost/benefit analysis of the FOMC members. And the benefits are declining while the costs are rising.
This past week, Federal Reserve Chairman Ben Bernanke gave his semi-annual Congressional update on monetary policy to the Senate Banking Committee and then to the House of Representatives Financial Services Committee. Bernanke warned about increased risks to economic growth, namely the European sovereign debt crisis and the US fiscal situation also known as the pending fiscal cliff. He warned Congress that the fiscal cliff may push the US economy into recession unless addressed. The fragile recovery will be severely damaged by spending cuts and tax increases that will automatically begin on January 1, 2013. Bernanke still called for long-term reform of fiscal policy but on a gradual basis.
Although the recovery continues, the Fed chief noted that it has decelerated in the first half. Bernanke expects unemployment reduction to be frustratingly slow. He sees headwinds from the continuing tight lending conditions and fiscal uncertainty. The Fed chief repeated that the FOMC sees exceptionally low rates through 2014. On policy Bernanke repeated that the Fed is prepared to act if needed and that additional tools are available. However, he also indicated that the Fed will look at the costs and benefits of additional policy actions. Bernanke made a point of sticking to the June 20 FOMC announcement script.
Recent indicator news was mixed. The consumer has retrenched somewhat. Housing may still be on a mild uptrend. Manufacturing appears to have softened but likely is still growing. Inflation has eased on lower gasoline prices. Finally, the Fed is still debating further policy moves and whether they will actually make a difference. Regardless, monetary policy likely will remain extremely easy through 2014.
For the big event on Friday, investors nerves will be tested as they await to see if Q2 GDP tops or falls short of the Q1 sluggish pace. But earlier there will be updates on manufacturing and housing. Whether manufacturing has softened will be updated with the Markit flash PMI, Richmond Fed, durables orders, and Kansas City reports. Housing news includes FHFA house price index, new home sales, and pending existing home sales.
The Chicago Fed National Activity Index fell to minus 0.45 in May from a slightly revised plus 0.08 in April. The index was pulled down by its production & housing component while the employment component and the sales/orders/inventories component were neutral.
Chicago Fed National Activity Index Consensus Forecast for June 12: -0.33
Range: -0.60 to -0.10
The PMI manufacturing flash index is due out for July. The Markit Economics' PMI for the US slowed to 52.5 in June final versus the flash estimate for 52.9 and was down from 54.0 in May. The report showed the weakest rate of growth in 18 months.
PMI manufacturing index Consensus Forecast for July 12: 52.6
Range: 51.5 to 53.0
The FHFA purchase only house price index in April advanced 0.8 percent, following a 1.6 percent boost in March. The year-on-year rate is up 3.0 percent, compared to up 2.4 percent in March. Six of the 9 Census Divisions posted gains in December, led by a 2.2 percent rise for the Pacific region. Declines were led by a 1.2 percent decrease in the New England region.
FHFA purchase only house price index Consensus Forecast for May 12: +0.3 percent
Range: 0.0 to +0.7 percent
The Richmond Fed manufacturing index contracted in June to minus 3 versus plus 4 and plus 14 in the prior two months. With the exception of employment and wages, details showed significant declines especially the critical areas of new orders and backlog orders. The new orders index dropped sharply to minus 12 in June from plus 1 in May and 13 in April.
Richmond Fed manufacturing index Consensus Forecast for July 12: 0.0
Range: -6 to 1
New home sales rose a very solid 7.6 percent in May, following declines of 1.2 percent in April and 5.2 percent in March. Sales came in at a higher-than-expected annual rate of 369,000 in May. The surge of buying in May brought down months’ supply to 4.7 months from 5.0 in April and the recession high of 12.2 for January 2009. However, the latest existing home sales number showed a decline of 5.4 percent for June, indicating that new home sales also might be soft for the month.
New home sales Consensus Forecast for June 12: 370 thousand-unit annual rate
Range: 358 thousand to 389 thousand-unit annual rate
Durable goods orders rebounded 1.3 percent in May after a 0.3 percent dip the month before. Overall durables got sizeable lift from aircraft orders. Excluding transportation, durables rose 0.7 percent after a 0.7 percent drop in April. The transportation component was notably strong, jumping 2.7 percent after a 0.8 percent rise in April. Outside of transportation, component strength was in machinery and in electrical. On the downside were primary metals, fabricated metals, and computers & electronics. "Other" was little changed.
Numbers reflect revisions from the more recent total factory orders report.
New orders for durable goods Consensus Forecast for June 12: +0.6 percent
Range: -1.4 percent to +2.1 percent
New orders for durable goods, ex-trans., Consensus Forecast for June 12: +0.2 percent
Range: -0.7 percent to +1.7 percent
Initial jobless claims surged 34,000 in the July 14 week to 386,000. But the 4-week average, reflecting the prior week's large downswing, is actually lower, down 1,500 to a 375,500 level that compares favorably to the month-ago level of 387,500. Recently large swings in the numbers appear to be due to seasonal adjustment issues related to the timing of summer retooling in the auto industry.
Jobless Claims Consensus Forecast for 7/21/12: 380,000
Range: 375,000 to 400,000
The pending home sales index in May bounced back a sharp 5.9 percent, following a drop of 5.5 percent in April and a gain of 3.8 percent in March. On a year-ago basis, pending home sales were up 13.3 percent in May.
Pending home sales Consensus Forecast for June 11: +0.9 percent
Range: -2.9 to +4.0 percent
The Kansas City Fed manufacturing index in June slipped to 3 from 9 in May, but remained in positive territory. Growth was positive but slower. The production index followed the same pattern, easing to 12 in June from 17 the month before. But production was still at a moderately strong pace. The notable negatives in the report were for orders. The new orders index dropped notably to minus 7 from plus 10 in May.
Kansas City Fed manufacturing index Consensus Forecast for July 12: 4
Range: 0 to 5
GDP for the third estimate for the first quarter showed the economy growing at the same sluggish pace as previously believed. First quarter GDP growth posted a still slow 1.9 percent annualized pace, compared to the prior estimate of 1.9 percent and the fourth quarter pace of 3.0 percent, annualized. There were modest component revisions. Upward revisions were seen in nonresidential fixed investment, residential investment, and net exports. Downward revisions also were seen in personal consumption and inventory investment. Final sales of domestic product were revised up slightly to 1.8 percent, compared to the prior estimate of 1.7 percent and 1.1 percent for the fourth quarter. Final sales to domestic purchasers (excludes net exports) were revised down slightly to 1.6 percent, compared to the prior estimate of 1.7 percent and 1.3 percent for the fourth quarter. Economy-wide inflation according to the GDP price index was revised to 2.0 percent from the prior estimate for the first quarter of 1.7 percent and followed 0.9 percent for the fourth quarter.
Real GDP Consensus Forecast for advance estimate Q2 12: +1.2 percent annual rate
Range: +0.9 to +2.4 percent annual rate
GDP price index Consensus Forecast for advance estimate Q2 12: +1.6 percent annual rate
Range: +1.2 to +2.2 percent annual rate
The Reuter's/University of Michigan's consumer sentiment index in early July dipped 2 tenths to 72.0. Strength was in the current conditions component which was up 1.7 points over the last two weeks to 83.2. This was still lower than the 87 readings through May but was better than April and most importantly, again, was better than June which offered an early indication of month-to-month consumer strength for July. The weakness in the report was in the expectations component which was down 3 points to 64.8 and which unfortunately was the weakest reading of the year. This may reflect lowered expectations about job growth and concern about how problems in Europe may impact U.S. growth.
Consumer sentiment Consensus Forecast for final July 12: 72.0
Range: 71.0 to 75.0
R. Mark Rogers is the author of The Complete Idiot’s Guide to Economic Indicators, Penguin Books, 2009.
Econoday Senior Writer Mark Pender contributed to this article.
|
