|
Amid light economic news on the home front, markets focused on earnings season for the second quarter.
 Equities ended the week mixed. Traders largely worried about a potentially lackluster earnings season with slowing global growth a key concern. Stocks dipped Monday on weak Japanese and Chinese economic data and climbing Spanish and Italian bond yields. Spanish yields topped 7 percent, which are seen as unsustainable for Spain to pay off debt. Stocks declined Tuesday after several profit warnings from the technology sector added to concerns that the economy was losing steam. After close Monday, Alcoa reported in line with earlier estimates but traders had hoped for more. A number of companies missed on the downside during trading on Tuesday, including Advanced Micro Devices, Applied Materials, and Cummins. Equities ended the week mixed. Traders largely worried about a potentially lackluster earnings season with slowing global growth a key concern. Stocks dipped Monday on weak Japanese and Chinese economic data and climbing Spanish and Italian bond yields. Spanish yields topped 7 percent, which are seen as unsustainable for Spain to pay off debt. Stocks declined Tuesday after several profit warnings from the technology sector added to concerns that the economy was losing steam. After close Monday, Alcoa reported in line with earlier estimates but traders had hoped for more. A number of companies missed on the downside during trading on Tuesday, including Advanced Micro Devices, Applied Materials, and Cummins.
At mid-week, the Fed was the key focus with the release of the latest FOMC minutes. Traders hoped for hints of another round of quantitative easing. When no such hints appeared, stocks dropped notably.
An unexpected and sharp drop in initial jobless claims did not stop the downturn in stock prices. Seasonality issues related to summer retooling by auto manufacturing led to discounting of the face value good news in the labor market. Instead, traders continued to be disappointed over lack of hints of further Fed ease and worried over the earnings picture. Also the lack of the Bank of Japan adding to its stimulus package and a drop in employment in Australia weighed on markets.
At week’s close, stocks posted a sizeable rebound on news from the banking sector and from China. Despite increased estimates of losses by JPMorgan from its “London whale” trading fiasco (reporting a $4.4 billion trading loss in the second quarter), the investment bank said it expected record earnings for the year. Due to a report showing sluggish GDP growth in China (by Chinese standards), traders decided that China will have to implement a new stimulus package to boost growth in the second half of the year. Late in the trading day, short covering also added lift to equities.
Equities were mixed this past week. The Dow was fractionally up, rounded to 0.0 percent; the S&P 500, up 0.2 percent; the Nasdaq, down 1.0 percent; the Russell 2000, down 0.8 percent; and the Wilshire 5000, down fractionally but rounded to 0.0 percent.
For the year-to-date, major indexes are up as follows: the Dow, up 4.6 percent; the S&P 500, up 7.9 percent; the Nasdaq, up 11.6 percent; the Russell 2000, up 8.1 percent; and the Wilshire 5000, up 7.8 percent.
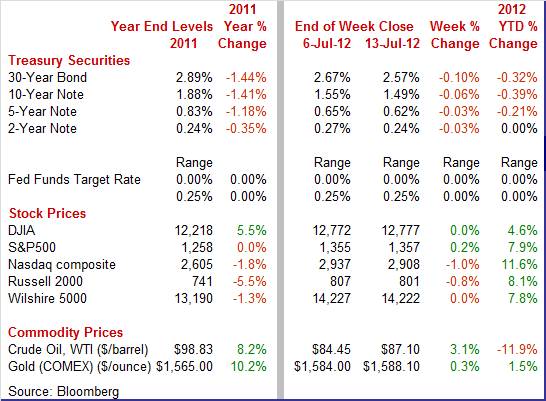
Weekly percent change column reflects percent changes for all components except interest rates. Interest rate changes are reflected in simple differences.
 Except on the short end, Treasury yields ended the week down moderately. However, only two days had notable moves—Monday and Thursday. Except on the short end, Treasury yields ended the week down moderately. However, only two days had notable moves—Monday and Thursday.
The second round of Operation Twist bumped rates down moderately at week’s open as primary dealers reduced their tender of securities for the Fed operation, forcing the Fed to pay higher prices. Demand for Treasuries was high for the overall market due to concern about Spanish and Italian sovereign debt.
Despite disappointment over the Fed’s FOMC minutes not hinting at QE3, rates were little changed Wednesday.
Yields dipped Thursday despite a sharp drop in initial jobless claims. This news was discounted as a seasonal adjustment issue. Rates eased, however, due to increased expectations that the Fed and foreign central banks will ease further. Safe haven demand also lowered yields with the 30-year bond selling at auction for a record low of 2.580 percent. Rates were little changed Friday.
For this past week Treasury rates were mostly down as follows: the 2-year note, down 3 basis points; the 5-year note, down 3 basis points; the 7-year note, down 4 basis points; the 10-year note, down 6 basis points; and the 30-year bond, down 10 basis points. The 3-month T-bill firmed 2 basis points.
 There was moderately strong daily volatility in crude prices this past week. Prices for WTI rose a buck and half on Monday as a Norwegian labor strike threatened to stop oil production in that country. But prices dropped $2 per barrel on Tuesday on the end of the oil workers’ strike. Norway’s government ordered mandatory arbitration to resolve the labor dispute. Norway is western Europe’s largest exporter of oil. Also, the U.S. Energy Department lowered its demand projections for 2012 and 2013. There was moderately strong daily volatility in crude prices this past week. Prices for WTI rose a buck and half on Monday as a Norwegian labor strike threatened to stop oil production in that country. But prices dropped $2 per barrel on Tuesday on the end of the oil workers’ strike. Norway’s government ordered mandatory arbitration to resolve the labor dispute. Norway is western Europe’s largest exporter of oil. Also, the U.S. Energy Department lowered its demand projections for 2012 and 2013.
At mid-week, the spot price of West Texas Intermediate gained almost $2 per barrel on a government reported drop in crude inventories and an unexpectedly high rate of operation for refineries.
After little change Thursday, WTI rose somewhat over a dollar a barrel on speculation that China will be implementing new stimulus policies to spur its economy.
Net for the week, the spot price for West Texas Intermediate gained $2.65 per barrel to settle at $87.10. Crude has traded in a range of just over $82 and somewhat under $88 per barrel over the last two week.
The international trade sector improved in the latest report while consumer news was mixed. Inflation numbers were soft.
 The latest international trade report showed improvement but it was not all good news. The U.S. trade balance in May narrowed, thanks largely to lower oil prices. Exports made a partial comeback. The trade deficit narrowed to $48.7 billion from $50.6 billion in April (originally $50.1 billion). Exports rose 0.2 percent, following a 0.9 percent decline in April. Imports fell 0.7 percent after a 1.6 percent drop the prior month. The latest international trade report showed improvement but it was not all good news. The U.S. trade balance in May narrowed, thanks largely to lower oil prices. Exports made a partial comeback. The trade deficit narrowed to $48.7 billion from $50.6 billion in April (originally $50.1 billion). Exports rose 0.2 percent, following a 0.9 percent decline in April. Imports fell 0.7 percent after a 1.6 percent drop the prior month.
The narrowing in the trade gap was led by the petroleum goods gap which shrank sharply to $24.9 billion from $28.1 billion in April. In contrast, the non-petroleum goods deficit expanded a little to $37.9 billion in May from $36.7 billion the month before. The services surplus improved to $14.8 billion from $14.6 billion.
 Looking specifically at goods (Census basis), exports rose 0.3 percent, following a 1.4 percent fall in April. The May improvement in goods exports was led by a $0.9 billion gain in foods, feeds & beverages. Capital goods excluding autos rebounded $0.7 billion—and it was non-aircraft. Industrial supplies fell $0.8 billion and likely was price related. Also declining slightly were automotive and consumer goods. Looking specifically at goods (Census basis), exports rose 0.3 percent, following a 1.4 percent fall in April. The May improvement in goods exports was led by a $0.9 billion gain in foods, feeds & beverages. Capital goods excluding autos rebounded $0.7 billion—and it was non-aircraft. Industrial supplies fell $0.8 billion and likely was price related. Also declining slightly were automotive and consumer goods.
Goods imports fell 0.8 percent in May after a 1.8 percent drop the prior month. The drop in goods imports in May was led by a $3.6 billion fall in industrial supplies—primarily oil. Consumer goods dipped $0.4 billion. On the plus side were capital goods excluding autos (up $1.4 billion) and automotive *up $0.7 billion).
The latest data are mildly encouraging to a degree but there is a notable caveat. The smaller trade gap indicates that more U.S. income is staying in the U.S. to help boost domestic demand—that is good news. Exports rebounded partially—at least indicating that exports are not in a free fall. This is more good news. But both exports and imports after discounting prices are on the soft side. The recent trend is that demand is less robust overall but at least still growing. Businesses appear to be back investing in equipment but are cautious about consumer demand, ordering fewer consumer goods to put on store shelves. That is the big negative, that there is a growing view that consumer demand will remain soft in coming months.
 The initial reading for consumer sentiment in July dipped. But there were two basic stories in the report—a perceived better economy now and lowered expectations ahead. The initial reading for consumer sentiment in July dipped. But there were two basic stories in the report—a perceived better economy now and lowered expectations ahead.
 The headline number in July (the composite) dipped 2 tenths to 72.0. Strength was in the current conditions component which was up 1.7 points over the last two weeks to 83.2. This was still lower than the 87 readings through May but was better than April and most importantly, again, was better than June which offers an early indication of month-to-month consumer strength for July. And lower gasoline prices are likely improving the view of the current economy. The headline number in July (the composite) dipped 2 tenths to 72.0. Strength was in the current conditions component which was up 1.7 points over the last two weeks to 83.2. This was still lower than the 87 readings through May but was better than April and most importantly, again, was better than June which offers an early indication of month-to-month consumer strength for July. And lower gasoline prices are likely improving the view of the current economy.
The weakness in the report was in the expectations component which was down 3 points to 64.8 and which unfortunately is the weakest reading of the year. This may reflect lowered expectations about job growth and concern about how problems in Europe may impact U.S. growth.
One factor that's definitely helping the US consumer is the moderation underway in gas prices. One-year inflation expectations were down a big 3 tenths to 2.8 percent. Five-year expectations were unchanged at the same 2.8 percent.
 Consumer credit jumped $17.1 billion in May for the largest increase since the $19.1 billion boost seen in November 2011. Gains for the latest month were seen in both revolving and nonrevolving credit. Consumer credit jumped $17.1 billion in May for the largest increase since the $19.1 billion boost seen in November 2011. Gains for the latest month were seen in both revolving and nonrevolving credit.
Nonrevolving credit, which is being driven higher by strong demand for student loans including in the latest month, rose $9.1 billion. Auto loans also played a supporting role.
Revolving credit jumped a giant $8.0 billion which is by far the strongest gain of the recovery. A key question is why revolving credit rose so much. Are consumers more confident about jobs and are more willing to spend' Are consumers using credit cards to fill in for slumping income' The data do not directly answer those questions. Odds are it is a combination of both. Consumers with jobs are less worried about a layoff. And consumers that are underemployed may be resorting to credit cards. But on a clearly positive note, credit card issuers indeed have returned to the practice of extending credit. Overall, the boost in credit outstanding is helping to sustain the recovery.
 The headline PPI unexpectedly edged up instead declining as expected. Seasonally adjusted gasoline prices actually rose along with food prices. The producer price index in June edged up 0.1 percent, following a sharp 1.0 percent plunge the prior month. The consensus called for a 0.4 percent decrease for the latest month. The core PPI rose 0.2 percent, following a 0.2 percent gain in May. The headline PPI unexpectedly edged up instead declining as expected. Seasonally adjusted gasoline prices actually rose along with food prices. The producer price index in June edged up 0.1 percent, following a sharp 1.0 percent plunge the prior month. The consensus called for a 0.4 percent decrease for the latest month. The core PPI rose 0.2 percent, following a 0.2 percent gain in May.
 By major components, energy dropped 0.9 percent after falling 4.3 percent in May. Pulling energy down were the subcomponents for liquified petroleum gas, diesel, home heating oil and residential electric prices. Electricity fell a record monthly 2.1 percent on a SA basis, though up slightly on an unadjusted basis. Gasoline prices rose 1.9 percent after plunging a monthly 8.9 percent in May. Basically, May’s huge drop precluded the typical June dip on an unadjusted basis. Food costs rebounded 0.5 percent, following a 0.6 percent decline. By major components, energy dropped 0.9 percent after falling 4.3 percent in May. Pulling energy down were the subcomponents for liquified petroleum gas, diesel, home heating oil and residential electric prices. Electricity fell a record monthly 2.1 percent on a SA basis, though up slightly on an unadjusted basis. Gasoline prices rose 1.9 percent after plunging a monthly 8.9 percent in May. Basically, May’s huge drop precluded the typical June dip on an unadjusted basis. Food costs rebounded 0.5 percent, following a 0.6 percent decline.
Within the core, accounting for 70 percent of the June increase, the index for light motor trucks moved up 1.4 percent. Higher prices for major household appliances and pet food also contributed to the rise in the finished core index.
For the overall PPI, the year-ago rate in June was 0.8 percent, matching the pace the month before (seasonally adjusted). The core rate in June eased to 2.6 percent from 2.8 percent in May.
The latest report was more about seasonal adjustment procedures than anything else. Gasoline was down on an unadjusted basis and the seasonal factor anticipated more of a decline than actually occurred. For such a volatile commodity, it is not disconcerting that most analysts missed this month—especially after such a big drop in May. The near-term trend for energy costs is still down. Food, however, is a concern, given the drought in the corn belt. But the core is showing slight deceleration. Overall, there are few signs of inflation at the producer level feeding into consumer price inflation.
 There is no inflation pressure being imported to the U.S. In fact, it now is the opposite—deflation (in part) is being imported. The drop underway in fuel prices together with strength in the dollar and a general easing in global demand are pulling prices of imported goods lower. For the first time of the recovery, import prices have fallen for three months in a row, falling a very steep 2.7 percent in June following a downwardly revised 1.2 percent plunge in May and a 0.1 percent decline in April. There is no inflation pressure being imported to the U.S. In fact, it now is the opposite—deflation (in part) is being imported. The drop underway in fuel prices together with strength in the dollar and a general easing in global demand are pulling prices of imported goods lower. For the first time of the recovery, import prices have fallen for three months in a row, falling a very steep 2.7 percent in June following a downwardly revised 1.2 percent plunge in May and a 0.1 percent decline in April.
 The decline in June was the steepest of the recovery. Minus signs, for a second month in a row, sweep almost every component with prices for imported petroleum products down 10.5 percent which is yet another steepest drop of the recovery. Finished goods prices show a decline for capital goods, down two of the last three months, and a second straight decline for imported consumer goods. The decline in June was the steepest of the recovery. Minus signs, for a second month in a row, sweep almost every component with prices for imported petroleum products down 10.5 percent which is yet another steepest drop of the recovery. Finished goods prices show a decline for capital goods, down two of the last three months, and a second straight decline for imported consumer goods.
The export side, where the headline in minus 1.7 percent, is very similar with a 4.0 percent monthly plunge in agricultural exports a heavy negative. Finished prices show a slight decline for exported capital goods but a moderate increase for consumer goods where however the year-on-year rate is only plus 0.5 percent.
The softness in import prices is good news for the U.S. consumer (increased purchasing power) and also allows the Fed to continue extremely easy monetary policy. But are the latest numbers a sign of pending overall deflation in the U.S.—something the Fed wants to avoid' Several factors suggest that weaker import prices are only damping U.S. inflation, not turning U.S. inflation into deflation. Import prices only cover goods. CPI services inflation has been on an uptrend since 2010 with housing, medical care, and education being key subcomponents providing upward pressure. And now, food prices are seeing upward pressure from spikes in key food commodities such as corn. The recent weakness in import prices is a blessing for the U.S. consumer, helping to offset rising inflation elsewhere, and not the harbinger of overall deflation.
The latest FOMC minutes for the June 19th to June 20th focused on the conditional with the word ‘if’ implicitly the key focus. According to the minutes, the Fed will take additional action as appropriate. A few participants said additional accommodation is needed to boost job growth and price stability (prevent deflation). The minutes show no additional inclination toward another round of quantitative easing. Several members stated that ‘operation twist’ had only a modest impact. However, at the meeting, the FOMC did take a very modest step in easing policy — it extended ‘operation twist’ through December 2012 instead of concluding it at the end of June as originally planned. Policy rates were unchanged at zero to 0.25% and guidance was unchanged with rates expected to remain exceptionally low through 2014.
FOMC participants did take note of slowing economic conditions. In their discussion, they noted that the economy had continued to expand moderately, though several members noted that some economic indicators’ gains were smaller than anticipated. For example, they noted that growth in employment in particular appeared to have slowed in recent months and the unemployment rate remained elevated — and this was before the very disappointing June employment data were released. However, ‘FedSpeak’ since the employment report has changed little. Rather those speaking focused on the costs and benefits of additional quantitative ease. Several FOMC members indicated that there would be little benefit from a third round of quantitative easing.
The recovery continues with modest forward momentum. International trade is expanding but at a slower pace than some months ago. The consumer sector is still positive but also less robust than earlier in the recovery. Inflation is not a threat except at the dinner table. The Fed still has plenty of room to maneuver but many on the FOMC are skeptical, doubting that additional policy moves would do much good and, in the worst case, would create inflation risks down the road.
Investors will be on heightened alert given the many market movers slated to hit the wires. The updates include consumer, housing and production data including retail sales, housing starts and existing home sales. Regional manufacturing data from the Empire State and Philadelphia Fed plus national industrial output data will update the manufacturing outlook. Additional hints—or not—on QE3 could come via the Fed’s Beige Book on Wednesday.
Retail sales in May declined 0.2 percent, following a 0.2 percent dip in April. The drop in the latest month was led by gasoline sales. Motor vehicle sales actually added to sales, gaining 0.8 percent, following a 0.1 percent rise in April. Excluding motor vehicles, retail sales fell 0.4 percent, following a 0.3 percent decline in April. Gasoline sales dropped a sharp 2.2 percent after declining 1.4 percent in April. Sales excluding autos and gasoline in May posted a modest 0.1 percent dip, matching the decline in April. Core components were mixed but mostly down.
Retail sales Consensus Forecast for June 12: +0.2 percent
Range: -0.2 to +0.4 percent
Retail sales excluding motor vehicles Consensus Forecast for June 12: +0.1 percent
Range: -0.3 to +0.2 percent
Less motor vehicles & gasoline Consensus Forecast for June 12: +0.3 percent
Range: +0.3 to +0.5 percent
The Empire State manufacturing index in June slowed to 2.29, a level however well below May's very strong pace of 17.09. Details showed slowing growth this month for new orders, shipments, and employment as well as a slip in the six-month outlook.
Empire State Manufacturing Survey Consensus Forecast for July 12: 4.50
Range: -8.00 to 6.00
Business inventories in April rose 0.4 percent, higher than the 0.2 percent rise in sales but not high enough to drive up the stock-to-sales ratio which remained at a healthy 1.26. Retail inventories in April showed a large build against a contraction in sales but the accumulation was centered at auto dealerships where sales have since been strong, according to auto manufacturers.
Business inventories Consensus Forecast for May 12: +0.3 percent
Range: 0.0 to +0.5 percent
The consumer price index fell 0.3 percent in May, following no change the month before. Excluding food and energy, the CPI gained 0.2 percent, compared to 0.2 percent in April. By major components, energy dropped a monthly 4.3 percent after falling 1.7 percent the prior month. Gasoline declined a sharp 6.8 percent, following a drop of 2.6 percent in April. Food prices were unchanged in May, following a 0.2 percent gain in April. Within the core, the indexes contributing to the increase were largely the same ones as in April: shelter, medical care, used cars and trucks, apparel, airline fares, and new vehicles. The indexes for household furnishings and operations and for tobacco declined.
CPI Consensus Forecast for June 12: 0.0 percent
Range: -0.4 to +0.1 percent
CPI ex food & energy Consensus Forecast for June 12: +0.2 percent
Range: +0.1 to +0.2 percent
Industrial production in May slipped 0.1 percent, following a rebound of 1.0 percent in April. By major components, manufacturing fell 0.4 percent, following a 0.7 percent jump in April. Motor vehicles output declined 1.5 percent after a 4.0 percent surge in April. Manufacturing excluding motor vehicles declined 0.3 percent after a 0.5 percent boost the prior month. In May, mining output rebounded 0.9 percent, following a 0.6 percent drop the month before. Utilities output rose 0.8 percent, following a 5.3 percent surge in April. Overall capacity utilization eased to 79.0 percent from 79.2 percent in April. Looking ahead, production worker hours gained 0.6 percent in June, suggesting a strong manufacturing component in industrial production. .
Industrial production Consensus Forecast for June 12: +0.3 percent
Range: -0.1 to +0.5 percent
Manufacturing production component Consensus Forecast for June 12: +0.2 percent
Range: +0.1 to +0.5 percent
Capacity utilization Consensus Forecast for June 12: 79.2 percent
Range: 78.9 to 79.4 percent
The NAHB housing market index in June rose 1 point to 29 from a revised 28 in May. Current sales of new homes were at their highest level of the recovery, according to the single-family sales component from the June home builders' report. The component was up 2 points this month to a recovery high of 32.
NAHB housing market index Consensus Forecast for July 12: 30
Range: 29 to 32
Housing starts declined in May by 4.8 percent after rebounding 5.4 percent in April. The May pace of 0.708 million units was up 28.5 percent on a year-ago basis. For the latest month the single-family component gained 3.2 percent after a 4.0 percent rise in April. The multifamily component—which is volatile—fell 21.3 percent, following an 8.4 percent boost in April. The biggest positive in the report was for permits. Permits rebounded 7.9 percent, following a decline of 6.0 percent in April. Both single-family and multifamily components rose in May.
Housing starts Consensus Forecast for June 12: 0.745 million-unit rate
Range: 0.720 million to 0.800 million-unit rate
Housing permits Consensus Forecast for June 12: 0.775 million-unit rate
Range: 0.750 million to 0.850 million-unit rate
The Beige Book being prepared for the July 31-August 1 FOMC meeting is released this afternoon. Traders likely will be focusing on whether there are any signs of improvement in the labor market. Inflation currently is not a worry but lack of progress on unemployment is. Hence, labor market news could tip the balance on whether there is additional Fed ease.
Initial jobless claims for the July 7 week dropped a sharp 26,000 to 350,000 with the 4-week average down roughly 10,000 to 376,500. But seasonal adjustment issues may have impacted the data due to a shift back in the retooling schedule for auto manufacturers. As summer shutdowns do begin, this improvement will presumably reverse to some degree. Continuing claims in data for the June 30 week fell slightly to 3.304 million with the 4-week average up slightly to 3.309 million which is the highest level in 2-1/2 months.
Jobless Claims Consensus Forecast for 7/14/12: 365,000
Range: 360,000 to 375,000
Existing home sales dipped 1.5 percent in May to a 4.55 million annual rate. This followed a 3.4 percent boost the prior month. However, the rate opened the year at 4.63 million in January but has not netted any gain. The unseasonably warm weather at the beginning of the year, when sales were at their highest, likely pulled sales into the winter from the spring. Supply was a positive, rising only slightly at the current sales rate to 6.6 months.
Existing home sales Consensus Forecast for June 12: 4.65 million-unit rate
Range: 4.60 to 4.73 million-unit rate
The general business conditions index of the Philadelphia Fed's Business Outlook Survey in June showed contraction for a second month and, at a minus 16.6 level, was much more severe than May's minus 5.8. High mid-teen negative readings swept the details including new orders, unfilled orders, shipments, deliveries, and the workweek. The new orders index fell to minus 18.8 in June from minus 1.2 in May.
Philadelphia Fed survey Consensus Forecast for July 12: -8.0
Range: -15.0 to -2.0
The Conference Board's index of leading indicators posted a 0.3 percent gain for May after 0.1 percent dip in April and 0.2 percent gain in March. Strength in the latest month was in building permits (+0.21 percent contribution), the Treasury/fed funds spread (+0.18 percent contribution), and in the ISM new orders index (+0.10 percent contribution). The key negatives were the factory workweek (-0.13 percentage contribution) and stock prices (-0.13 percentage contribution). The coincident index rose 0.2 percent, matching the pace in April, indicating that current economic activity is moderately positive.
Leading indicators Consensus Forecast for June 12: -0.1 percent
Range: -0.2 to +0.2 percent
R. Mark Rogers is the author of The Complete Idiot’s Guide to Economic Indicators, Penguin Books, 2009.
Econoday Senior Writer Mark Pender contributed to this article.
|
