|
It seems there has been a little bit of a role reversal. Several housing indicators picked up strength this past week while manufacturing was mixed and sluggish overall. And the consumer sector lost steam. But it was progress in Europe that led to notable gains for equities o the week.
 There were sharp swings in stocks during the week but equities were unexpectedly up net. On Monday, worries over Europe were the main factor pushing equities down. Traders were concerned that this past week’s European Union summit would not ease their sovereign debt and bank crises. Adding to worries, Spain requested help for its banks and Cyprus became the fourth Eurozone country to seek a financial bailout from its European partners. New home sales posted Monday and were unexpectedly strong but more than offset by Europe. There were sharp swings in stocks during the week but equities were unexpectedly up net. On Monday, worries over Europe were the main factor pushing equities down. Traders were concerned that this past week’s European Union summit would not ease their sovereign debt and bank crises. Adding to worries, Spain requested help for its banks and Cyprus became the fourth Eurozone country to seek a financial bailout from its European partners. New home sales posted Monday and were unexpectedly strong but more than offset by Europe.
Hope about the housing sector outweighed slippage in the consumer sector Tuesday, bumping up equities. The Case-Shiller home price index rose for the third month in a row (SA) while consumer confidence edged down. At mid-week, durables orders and pending home sales were significantly higher than expected, lifting stocks sharply. Also, a news story out of China indicated that country may implement more pro-active policies to boost growth. Equity gains were limited by worries that the European Union summit would end with little progress on European debt.
 Equities were mostly down Thursday with the downdraft starting with higher-than-expected initial jobless claims. Later in the morning, the decline accelerated after the Supreme Court upheld most facets of President Barack Obama’s health care overhaul, lowering most healthcare stocks. Adding to the downturn was a report that JPMorgan’s trading losses from credit derivatives may total as much as US$9 billion, bumping down financials. Equities were mostly down Thursday with the downdraft starting with higher-than-expected initial jobless claims. Later in the morning, the decline accelerated after the Supreme Court upheld most facets of President Barack Obama’s health care overhaul, lowering most healthcare stocks. Adding to the downturn was a report that JPMorgan’s trading losses from credit derivatives may total as much as US$9 billion, bumping down financials.
At week’s close, it was all about Europe even though there was other news. European leaders cut a deal to help re-capitalize struggling banks in the Eurozone. Partially offsetting were disappointing reports on personal income, consumer sentiment, and Chicago PMI.
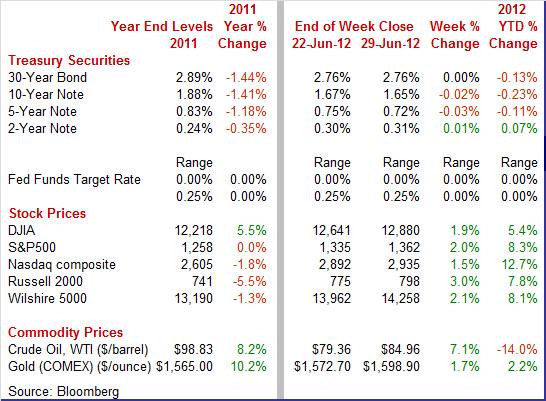
Equities were up this past week. The Dow was up 1.9 percent; the S&P 500, up 2.0 percent; the Nasdaq, up 1.5 percent; the Russell 2000, up 3.0 percent; and the Wilshire 5000, up 2.1 percent.
 Equities were up significantly in June. The Dow was up 3.9 percent; the S&P 500, up 4.0 percent; the Nasdaq, up 3.8 percent; the Russell 2000, up 4.8 percent; and the Wilshire 5000, up 3.8 percent. These were the largest monthly gains for the Dow and S&P500 since October. Equities were up significantly in June. The Dow was up 3.9 percent; the S&P 500, up 4.0 percent; the Nasdaq, up 3.8 percent; the Russell 2000, up 4.8 percent; and the Wilshire 5000, up 3.8 percent. These were the largest monthly gains for the Dow and S&P500 since October.
Equities were down for the second quarter. The Dow was down 2.5 percent; the S&P 500, down 3.3 percent; the Nasdaq, down 5.1 percent; the Russell 2000, down 3.8 percent; and the Wilshire 5000, down 3.7 percent.
For the year-to-date, major indexes are up as follows: the Dow, up 5.4 percent; the S&P 500, up 8.3 percent; the Nasdaq, up 12.7 percent; the Russell 2000, up 7.8 percent; and the Wilshire 5000, up 8.1 percent.
Weekly percent change column reflects percent changes for all components except interest rates. Interest rate changes are reflected in simple differences.
 Treasury yields were little-changed for the week but slightly on the down side. Daily swings were marginal to very moderate. At the start of the week, rates fell moderately despite positive surprises on new home sales and Dallas Fed manufacturing. Flight to safety held sway on belief that European leaders would not make progress on the Eurozone’s debt crisis. Treasury yields were little-changed for the week but slightly on the down side. Daily swings were marginal to very moderate. At the start of the week, rates fell moderately despite positive surprises on new home sales and Dallas Fed manufacturing. Flight to safety held sway on belief that European leaders would not make progress on the Eurozone’s debt crisis.
Between the bookends, there was minimal daily movement. Rates nudged up Tuesday and nudged down Wednesday and again Thursday. The mild firming on Tuesday was due to hope for progress in Europe and a favorable Case-Shiller home price report. Easing on Wednesday resulted from renewed worry about lack of progress from the European Union summit and despite strong economic data for the U.S. Rates bumped down slightly Thursday to continued worries about European leaders possibly not agreeing on a plan to shore up banks in Spain and Italy. Bond market reaction to the Supreme Court decision on health care reform was muted.
Rates rose moderately on Friday despite disappointing economic news in the U.S. The big mover was an agreement by European leaders to assist banks in Spain and Italy. There also was associated movement of funds to equities.
For this past week Treasury rates were mostly down as follows: the 5-year note, down 3 basis points; the 7-year note, down 3 basis points; and the 10-year note, down 2 basis points. The 3-month T-bill and the 30-year bond were unchanged while the 2-year note firmed 1 basis point.
 The spot price of crude unexpectedly rose sharply this past week. The first three days of trading were relatively quiet. On Thursday, the spot price of West Texas Intermediate fell about $2-1/2 per barrel on disappointing initial jobless claims in the U.S. and on a rise in German unemployment, adding to worries about global growth. The spot price of crude unexpectedly rose sharply this past week. The first three days of trading were relatively quiet. On Thursday, the spot price of West Texas Intermediate fell about $2-1/2 per barrel on disappointing initial jobless claims in the U.S. and on a rise in German unemployment, adding to worries about global growth.
But at week’s end, crude surged a whopping $7 per barrel on euphoria over an agreement by European Union leaders to prop up banks in Spain and Italy, giving hope that financial markets will be soothed and European growth can resume.
Net for the week, the spot price for West Texas Intermediate jumped $5.60 per barrel to settle at $84.96.
The economy ended up significantly less robust than hoped for the first quarter. And the improvement in the second quarter also is somewhat disappointing. But progress is being made with pleasant upside surprises coming from the housing sector.
 For the third estimate for first quarter GDP, the economy grew at the same sluggish pace as previously believed. First quarter GDP growth posted a still slow 1.9 percent annualized pace, compared to the prior estimate of 1.9 percent and the fourth quarter pace of 3.0 percent, annualized. For the third estimate for first quarter GDP, the economy grew at the same sluggish pace as previously believed. First quarter GDP growth posted a still slow 1.9 percent annualized pace, compared to the prior estimate of 1.9 percent and the fourth quarter pace of 3.0 percent, annualized.
There were modest component revisions. Upward revisions were seen in nonresidential fixed investment, residential investment, and net exports. Within net exports import growth was bumped down, more than offsetting a downward revision to export growth. Downward revisions also were seen in personal consumption and inventory investment.
Overall demand numbers were only marginally revised. Final sales of domestic product were revised up slightly to 1.8 percent, compared to the prior estimate of 1.7 percent and 1.1 percent for the fourth quarter. Final sales to domestic purchasers (excludes net exports) were revised down slightly to 1.6 percent, compared to the prior estimate of 1.7 percent and 1.3 percent for the fourth quarter.
Economy-wide inflation according to the GDP price index was revised to 2.0 percent from the prior estimate for the first quarter of 1.7 percent and followed 0.9 percent for the fourth quarter.
Overall, first quarter growth was very soft and improvement in the second quarter is gradual at best, according to the latest monthly indicators.
 The housing sector is showing signs of finally starting to heal, although it still at a low level of activity. New home sales rose a very solid 7.6 percent in May, following declines of 1.2 percent in April and 5.2 percent in March. Sales came in at a higher-than-expected annual rate of 369,000 in May. The housing sector is showing signs of finally starting to heal, although it still at a low level of activity. New home sales rose a very solid 7.6 percent in May, following declines of 1.2 percent in April and 5.2 percent in March. Sales came in at a higher-than-expected annual rate of 369,000 in May.
Earlier, it was believed (and appears to be the case) that an atypically warm winter boosted sales as sales spiked 8.0 percent in February. But with the May data, the numbers are past the seasonality issue and show a modest net gain year to date.
Price concessions from home builders may be behind some of the sales strength. Both the median and average price readings show low single digit monthly contraction with year-on-year comparisons holding in the positive mid-single range. But the price data are not based on repeat transactions (new homes have not been sold before) and shifts in sales by price range may affect the median and average prices.
Given that the May surge in sales was beyond the earlier seasonality issue, housing may become a rising positive for the economic outlook. The decline in supply adds to this argument. The surge of buying in May brought down months’ supply to 4.7 months from 5.0 in April and the recession high of 12.2 for January 2009. While home builders remain cautious, these numbers suggest modest gains ahead for new construction.
 Adding to the argument that housing is on a slow mend, pending existing home sales in May bounced back a sharp 5.9 percent, following a drop of 5.5 percent in April and a gain of 3.8 percent in March. Adding to the argument that housing is on a slow mend, pending existing home sales in May bounced back a sharp 5.9 percent, following a drop of 5.5 percent in April and a gain of 3.8 percent in March.
Yes, the numbers are volatile but the trend appears to be up. On a year-ago basis, pending home sales were up 13.3 percent in May.
Questions over credit and appraisal values had been pulling closings lower but the National Association of Realtors, which compiles the report, says closings are up. This improves the likelihood that the May surge in pending existing home sales actually translates into final sales.
 Not only are sales showing improvement, but more reliable measures indicate some healing on the home price front. Price traction is appearing in the home sector, the result of declining competition from distressed properties and also perhaps rising demand. Case-Shiller's seasonally adjusted composite index for 20 of the nation's largest markets surged 0.7 percent. This is an unusually large gain, last exceeded in April 2010 and before that in August 2009. Importantly, April's gain was also the third in a row which is the longest streak since early 2010. Not only are sales showing improvement, but more reliable measures indicate some healing on the home price front. Price traction is appearing in the home sector, the result of declining competition from distressed properties and also perhaps rising demand. Case-Shiller's seasonally adjusted composite index for 20 of the nation's largest markets surged 0.7 percent. This is an unusually large gain, last exceeded in April 2010 and before that in August 2009. Importantly, April's gain was also the third in a row which is the longest streak since early 2010.
City by city data show wide strength with 17 of 20 posting monthly gains. Gains are especially strong in the West and in Florida. Evidence is building that the housing sector, which has been dead flat for several years, is finally showing signs of life.
Recent indicators for housing have broadly shown improvement. Existing homes sales, which slipped 1.5 percent in May in a report released in the prior week, were really the only disappointment in the latest set of monthly housing data. Positive reports were seen for new home sales, pending existing home sales, FHFA house prices, and Case-Shiller home prices.
While housing is improving, softening is showing up in the consumer sector. Manufacturing is mixed but less robust than earlier in the recovery.
 Personal income was modestly positive in May but held back largely by earnings. Spending was even weaker on declines in auto sales and gasoline prices. Personal income in May rose 0.2 percent, matching the pace in April. The key wages & salaries component was unchanged, following a 0.1 percent increase in April. Personal income was modestly positive in May but held back largely by earnings. Spending was even weaker on declines in auto sales and gasoline prices. Personal income in May rose 0.2 percent, matching the pace in April. The key wages & salaries component was unchanged, following a 0.1 percent increase in April.
The gain in personal income was led by a rise in personal interest income, dividends, proprietors’ income, and rental income.
Consumer spending in May was unchanged, after edging up 0.1 percent the prior month. Analysts forecast a flat reading. By components, durables fell 0.4 percent, following a 0.1 percent decrease in April. The May dip in durables reflected a drop in motor vehicle sales to a large degree. Nondurables fell again on lower gasoline prices. This subcomponent decreased 0.4 percent, following a 0.1 percent decline in April. Services grew 0.3 percent, following 0.4 percent boost the prior month.
 Turning to inflation, lower oil prices are weighing on the numbers. The headline PCE price index declined 0.2 percent, following no change in April. Expectations were for a 0.1 percent dip. The core rate rose 0.1 percent in both May and April. The median market forecast was for a 0.2 percent increase. Turning to inflation, lower oil prices are weighing on the numbers. The headline PCE price index declined 0.2 percent, following no change in April. Expectations were for a 0.1 percent dip. The core rate rose 0.1 percent in both May and April. The median market forecast was for a 0.2 percent increase.
Year-on-year, headline prices were up 1.5 percent, compared to 1.9 percent in April. The core was up 1.8 percent versus 2.0 percent in April.
Personal income in May was held back by anemic employment growth. Income is going to be sluggish until jobs growth picks up. Spending in May was slowed by perhaps temporary factors. A healthy services PCEs number was encouraging. The slowing in inflation gives the Fed more latitude for additional policy moves if it chooses to do so. Mainly, better jobs data are becoming increasingly important to restart the recovery in the consumer sector.
 You would think that the recent and notable drop in gasoline prices would have consumers in a better mood, but that is not the case. The Conference Board’s consumer confidence index fell 2.4 points in June to 62.0, the lowest reading since January. This was the fourth straight decline for the longest losing streak of the recovery. You would think that the recent and notable drop in gasoline prices would have consumers in a better mood, but that is not the case. The Conference Board’s consumer confidence index fell 2.4 points in June to 62.0, the lowest reading since January. This was the fourth straight decline for the longest losing streak of the recovery.
Weakness was centered in the consumer's view of the future with substantially more, 16.2 percent versus 12.9 percent in May, saying business conditions will worsen over the next six months. Fewer consumers see job availability improving over the next months and fewer see an increase ahead for their income. This last reading is a big negative for retailers which may begin to plan for less business during the holiday season. The assessment of current conditions was steady and soft.
And the same story was repeated in the latest Reuters/University of Michigan reading on the consumer sentiment index. Consumer sentiment fell to a new low for this year, slipping to 73.2 for the final June reading which, given a 74.1 reading at mid-month, points to a low 72 reading for the final two weeks. The index opened the year at 75.0.
Weakness was seen in both expectations, down 1.1 points to 67.8, and in currents conditions which is 6 tenths lower to 81.5.
The good news for both measures of the consumer mood is that they are still notably above very low readings seen in mid- to late 2011. Still, a little help on the jobs front would go a long way to improving the consumer mood and boost spending.
 The latest round of manufacturing data is mixed. However, the biggest market mover this week from the manufacturing sector was positive, although most of the strength was narrowly based. The latest round of manufacturing data is mixed. However, the biggest market mover this week from the manufacturing sector was positive, although most of the strength was narrowly based.
New factory orders for durables rebounded 1.1 percent in May after a 0.2 percent dip the month before. Overall durables got sizeable lift from aircraft orders. Excluding transportation, durables rose 0.4 percent after a revised 0.6 percent drop in April.
The transportation component was notably strong, jumping 2.7 percent after a 0.8 percent rise in April. By subcomponents, nondefense aircraft gained 4.9 percent, following a 0.1 percent rise in April. Auto manufacturers should be happy-new orders for motor vehicles advanced 0.5 percent even after a strong 5.7 percent boost in April. Defense aircraft made a partial comeback, rising 6.9 percent in May after dropping 36.1 percent the month before.
Outside of transportation, component strength was in machinery and in electrical. On the downside were primary metals, fabricated metals, and computers & electronics. "Other" was flat.
The outlook for investment in business equipment is mixed, according to new orders. While the outlook for the aircraft components of equipment investment has been strong, the non-aircraft component has weakened in recent months. Nondefense capital goods orders excluding aircraft rose 1.6 percent in May, following a 1.4 percent decline the prior month. Shipments for this series rose 0.4 percent in May after decreasing 1.5 percent in April.
Overall, manufacturing in recent months has been sluggish but the May durables report indicates that there is still growth. But more recent regional surveys from the Fed point more to softening than to strengthening.
 Regional Fed readings have moved in both directions. Regional Fed readings have moved in both directions.
But news from the second largest manufacturing state indicates that activity is picking back up. The Dallas Fed general business activity index rebounded to plus 5.8 in June from minus 5.1 the month before.
Other measures of current activity generally improved in the latest month. The production index jumped to 15.5 from 5.5 in in May. Also, gaining were capacity utilization, new orders, unfilled orders, shipments, delivery time, number of employees, and average workweek. Specifically, the new orders index rose to plus 7.9 from minus 0.6 in May.
Overall, the Dallas numbers suggest that manufacturing in the U.S. is improving modestly.
In contrast, the news from Richmond was negative for June.
Activity in the Richmond Fed's manufacturing sector contracted in June, to minus 3 versus readings of plus 4 and plus 14 in the prior two months. With the exception of employment and wages, details showed significant declines especially the critical areas of new orders and backlog orders. The new orders index dropped sharply to minus 12 in June from plus 1 in May and 13 in April.
 Manufacturing activity in the Kansas City Fed District decelerated in June but some measures remained relatively strong. The composite index slipped to 3 from 9 in May, but remained in positive territory. Growth was positive but slower. The production index followed the same pattern, easing to 12 in June from 17 the month before. But production is still at a moderately strong pace. Manufacturing activity in the Kansas City Fed District decelerated in June but some measures remained relatively strong. The composite index slipped to 3 from 9 in May, but remained in positive territory. Growth was positive but slower. The production index followed the same pattern, easing to 12 in June from 17 the month before. But production is still at a moderately strong pace.
The notable negatives in the report were for orders. The new orders index dropped notably to minus 7 from plus 10 in May. The sluggish global economy is hurting orders as the new export orders index fell to minus 7 from plus 3 in May. Overall backlogs dropped to minus 18 from minus 3. However, plant managers remain slightly optimistic as the employment index remained positive though easing to 3 from 8 in May.
 Overall, the Kansas City Fed report indicates that manufacturing has softened but for now is still mildly net positive. Forward momentum is questionable, however. Overall, the Kansas City Fed report indicates that manufacturing has softened but for now is still mildly net positive. Forward momentum is questionable, however.
In summary for the latest Fed surveys, Dallas was broadly and moderately stronger; Richmond was broadly slowing; and Kansas City was still relatively high on production but notably down on orders. In the prior week, Philly Fed was unexpectedly negative while Empire State decelerated but remained positive.
The bottom line for manufacturing is that the news is mixed and growth is less robust than earlier in the recovery.
The latest indicators were mixed with the biggest positives coming from housing. The consumer sector was very sluggish—mostly tied to modest employment growth and special factors on spending. And consumer sentiment slipped. Manufacturing is mixed to net positive but is not seeing the strength it did many months ago. Overall, the recovery is improving but at a low trajectory and slower than hoped. Should this past week’s progress in Europe turn out to be real, that likely will boost global confidence and growth. But as a caveat, we’ve been there before.
Other than Independence Day at mid-week, the highlight is Friday’s employment report which needs to show improvement after the near flat increase in payrolls last month. Consumer spending slowed in May, giving motor vehicle sales (Tuesday) increased importance. After recently mixed regional Fed surveys, traders will look for a stronger ISM manufacturing number (Monday).
The composite index from the ISM manufacturing survey slipped to 53.5 in May from 54.8 the prior month. The latest was still well within positive territory, indicating moderate growth. But details were even better. The ISM's new order index was up 1.9 points to 60.1 for the strongest rate of monthly growth since April of last year. This portends an improvement in manufacturing overall. More recently, the Markit flash PMI for manufacturing in June eased to 52.9 from 54.0 in May.
ISM manufacturing composite index Consensus Forecast for June 12: 52.0
Range: 51.0 to 53.4
Construction spending posted a 0.3 percent gain in April, following an upwardly revised 0.3 percent boost the month before (originally up 0.1 percent). The gain in April was led by private residential outlays which increased 2.8 percent after a 0.4 percent rise in March. For the latest month, new multifamily outlays jumped 4.1 percent while new single-family spending rose 1.8 percent. Public outlays fell 1.4 percent while private nonresidential outlays dipped 0.2 percent in April. Looking ahead, the 4.8 percent drop in May housing starts points to weakness in the private residential component of outlays.
Construction spending Consensus Forecast for May 12: +0.2 percent
Range: -0.1 to +1.0 percent
Sales of total light motor vehicles in May fell a sizable 4.4 percent from April to an annual rate of 13.8 million which was the lowest rate of the year. May was a disappointment especially given industry and press reports that the month's sales were strong. Nonetheless, the May pace was quite a bit healthier than the recession low of 6.7 million for April 2009 and even a recent low of 11.6 million seen in June 2011.
Motor vehicle domestic sales Consensus Forecast for June 12: 10.0 million-unit rate
Range: 10.8 to 11.0 million-unit rate
Motor vehicle total sales Consensus Forecast for June 12: 13.9 million-unit rate
Range: 13.7 to 14.3 million-unit rate
Factory orders stumbled noticeably during April and March with April orders down 0.6 percent on top of March's downward 2.1 percent decline. This was the third back-to-back decline of the recovery and the steepest. Orders for commercial aircraft gave April a substantial boost. If this volatile component had swung the other way, the April decline would have been severe. More recently, new factory orders for durables rebounded 1.1 percent in May.
Factory orders Consensus Forecast for May 12: +0.1 percent
Range: -0.7 to +0.5 percent
NYSE Early Close.
SIFMA Recommended Early Close 2:00 ET
U.S. Holiday: Independence Day. Bond, Equity Markets Closed
ADP private payroll employment posted a 133,000 gain in May. This compared to the later estimate by BLS for private payrolls at 82,000.
ADP private payrolls Consensus Forecast for June 12: 95,000
Range: 60,000 to 167,000
Initial jobless claims fell 6,000 in the June 23 week to a slightly higher-than-expected 386,000. The prior week was revised 5,000 higher to 392,000. The 4-week average inched 750 lower to a 386,750 level that is 10,000 higher than a month ago. Continuing claims fell 15,000 to 3.296 million in data for the June 16 week but the 4-week average was up 9,000 to 3.306 million.
Jobless Claims Consensus Forecast for 6/30/12: 386,000
Range: 375,000 to 395,000
The composite index from the ISM non-manufacturing survey in May rose to 53.7 from 53.5 the month before. New orders rose 2 points to 55.5 to indicate accelerating monthly growth. The backlogs index was the same as in April, at 53.0 which was a solid rate for this reading. Business activity also picked up further in May.
ISM non-manufacturing composite index Consensus Forecast for June 12: 53.0
Range: 51.5 to 54.0
Nonfarm payroll employment in May rose only 69,000, following increases of 77,000 in April and 143,000 in March. Private payrolls gained 82,000 in April after an 87,000 advance the prior month. The unemployment rate rose to 8.2 percent in May from 8.1 percent the prior month. Average hourly earnings edged up 0.1 percent, matching the pace in April. The average workweek slipped to 34.4 hours from 34.5 in April.
Nonfarm payrolls Consensus Forecast for June 12: 90,000
Range: 35,000 to 167,000
Private payrolls Consensus Forecast for June 12: 100,000
Range: 45,000 to 176,000
Unemployment rate Consensus Forecast for June 12: 8.2 percent
Range: 8.1 to 8.3 percent
Average workweek Consensus Forecast for June 12: 34.4 hours
Range: 34.4 to 34.5 hours
Average hourly earnings Consensus Forecast for June 12: +0.2 percent
Range: +0.1 to +0.2 percent
R. Mark Rogers is the author of The Complete Idiot’s Guide to Economic Indicators, Penguin Books, 2009.
Econoday Senior Writer Mark Pender contributed to this article.
|
