|
Initially during this past winter, some housing data got sharp lift from atypically warm weather. Then numbers in the latter part of winter were unexpectedly soft and some analysts worried that spring data would be significantly negative as weather returned to normal, weighing on seasonally adjusted data. Early spring reports on housing indicate that, instead, housing is rebounding mildly. The consumer sector is unexpectedly more optimistic. However, manufacturing is very much a question mark.
 Equities were up moderately for the week. Most of the action was Monday—traders could have taken the rest of the week off and not noticed much difference. Stocks rebounded Monday after their worst weekly decline of the year. Over the weekend, the Group of Eight leaders said that Greece should remain in the Eurozone. They also stressed the importance of job growth. Also boosting stocks were comments by a Chinese official that China would support policies to bolster growth. Recent indicators for that country have suggested the economy will slow further in the second quarter. Equities were up moderately for the week. Most of the action was Monday—traders could have taken the rest of the week off and not noticed much difference. Stocks rebounded Monday after their worst weekly decline of the year. Over the weekend, the Group of Eight leaders said that Greece should remain in the Eurozone. They also stressed the importance of job growth. Also boosting stocks were comments by a Chinese official that China would support policies to bolster growth. Recent indicators for that country have suggested the economy will slow further in the second quarter.
Tuesday, a healthy existing home sales report lifted stocks for most of the day. But in the last hour of trading, worries about Greece leaving the Eurozone wiped out gains, leaving most indexes in the negative for the day. At mid-week, most equities posted modest rebounds as Greek worries eased somewhat. Also, positive numbers on new home sales and FHFA house prices supported stocks.
Thursday, equities were mixed. Weighing on stocks was an unexpectedly weak report on durables orders. Lack of progress by an ad hoc meeting Wednesday of European leaders to address European sovereign debt problems did not impress markets. The week closed down for on the final day as many investors moved money to safety ahead of the Memorial Day weekend. However, a better-than-expected consumer sentiment number helped keep Friday’s dip to a minimum.
Overall, economic data were mostly positive for the week and supported equity gains. Worry over European sovereign debt currently is the biggest factor affecting equities and for this past week, less worry outweighed more worry. Expectations for loose policy in China also helped.
Equities were up this past week. The Dow was up 0.7 percent; the S&P 500, up 1.7 percent; the Nasdaq, up 2.1 percent; and the Russell 2000, up 2.6 percent.
For the year-to-date, major indexes are up as follows: the Dow, up 1.9 percent; the S&P 500, up 4.8 percent; the Nasdaq, up 8.9 percent; and the Russell 2000, up 3.4 percent.
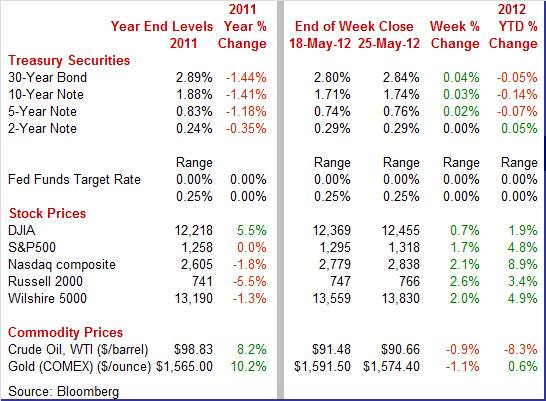
Weekly percent change column reflects percent changes for all components except interest rates. Interest rate changes are reflected in simple differences.
 Treasury yields posted modest increases this past week for mid-maturities and long maturities. Daily movement was modest ahead of the U.S. Memorial Day weekend. Treasury yields posted modest increases this past week for mid-maturities and long maturities. Daily movement was modest ahead of the U.S. Memorial Day weekend.
Rates mostly edged higher at the start of the week as German and French finance ministers met to discuss strategy on Greek debt and difficulties from the Greek electoral impasse. Yields gained slightly more Tuesday on a favorable report on existing home sales. Also, a meeting for European leaders in Brussels on Wednesday to discuss European sovereign debt was seen as a positive.
At mid-week, positive economic news was outweighed by renewed worries that a Greek exit from the Eurozone would worsen the financial crisis in Europe. Counterbalancing those concerns partially were good numbers for new home sales and FHFA house prices. Rates rose modestly on Thursday despite a disappointing report on durables orders. Initial jobless claims were favorable and Greek worries eased a bit.
Yields eased marginally Friday even though consumer sentiment unexpectedly rose notably. Many traders and investors were parking money ahead of the holiday weekend.
 For this past week Treasury rates were mostly up modestly as follows: 3-month T-bill, unchanged; the 2-year note, unchanged; the 5-year note, up 2 basis points; the 7-year note, up 2 basis points; the 10-year note, up 3 basis points; and the 30-year bond, up 4 basis points. For this past week Treasury rates were mostly up modestly as follows: 3-month T-bill, unchanged; the 2-year note, unchanged; the 5-year note, up 2 basis points; the 7-year note, up 2 basis points; the 10-year note, up 3 basis points; and the 30-year bond, up 4 basis points.
While rates were mostly up this past week, the longer-trend has been down in recent months. Since even just back to mid-2011, Treasury yields are down notably for mid-term and long-term maturities due to flight to safety over European debt worries and on soft economic growth. Even over just May, rates eased as funds flowed to safety as equities declined sharply.
 The spot price of crude continued its downtrend during May but at a more moderate pace. However, there was moderate daily volatility. The biggest moves were on Monday and Wednesday. The spot price of crude continued its downtrend during May but at a more moderate pace. However, there was moderate daily volatility. The biggest moves were on Monday and Wednesday.
At the first of the week, the spot price of West Texas Intermediate gained a little more than a dollar a barrel on a pledge by Chinese officials to boost that economy. Oil eased a little Tuesday after Iranian officials agreed to allow in United Nations nuclear inspectors. On Wednesday, crude dropped somewhat more than $2 per barrel to close below the $90 per barrel mark. U.S. crude inventories rose more than expected and the dollar gained on the euro on European debt concerns. Crude inventories are at their highest since August 1990.
Small gains in the price of spot WTI were seen Thursday and Friday.
Net for the week, spot prices for West Texas Intermediate declined 82 cents per barrel to settle at $90.66. Crude has been on a downtrend since a recent high of $106.21 on May 1, 2012.
Housing is showing improvement in the latest reports while manufacturing is coming in mixed but a little more on the down side than on the up side. Importantly, the consumer is feeling better about economic conditions.
 Existing home sales rebounded in April, helping to set aside some of the worries about upwardly skewed seasonally adjusted data during the atypically warm winter. Existing home sales rebounded in April, helping to set aside some of the worries about upwardly skewed seasonally adjusted data during the atypically warm winter.
Existing home sales posted a 3.4 percent increase, following a 2.8 percent decrease in March. Gains were solid across regions.
While the April increase is encouraging, the trend since the first of the year has been flat. April’s 4.62 million unit annualized pace is basically back to January’s 4.63 figure. Again, the good news is that the dips in February and March (when warm weather should have led to stronger numbers, according to some) are not the trend. However, sales are up 10.0 percent on a year-ago basis (SA), indicating that there is general but modest upward momentum.
Prices in this report firmed sharply, up 7.6 percent on the median following March's 5.2 percent gain. The year-on-year rate, at plus 10.1 percent, is suddenly in the double digits and for the first time in more than six years. The strength in prices may be related to easing competition from distressed sales which are now making up less than a third of total sales. The National Association of Realtors, which compiles the report, notes that a shrinking share of lower priced homes is a positive factor for price. The price measures in this report are not repeat transaction measures and are significantly affected by changes in the composition of sale types.
A statistical negative in the report was a rise in supply, to 6.6 months from 6.3 and 6.2 in the prior two months. But the rise may be due to optimism about modest improvement in the housing market as potential home-sellers added to the inventory level at a monthly 9.5 percent. Still, supply to sales is well down from a year ago when it was at 9.1 months.
Sluggish employment gains are not helping housing as much as hoped. But mortgage rates are providing support. The 30-year fixed mortgage rate for the May 24 week eased slightly to 3.78 percent from 3.79 percent the prior week, according to a weekly survey by Freddie Mac. Last year, 30-year loans averaged 4.60 percent.
 New home sales also seem to have gotten past the issue of skewed winter data. The recent trend over the last several months is still flat—but not down as some had feared. New home sales also seem to have gotten past the issue of skewed winter data. The recent trend over the last several months is still flat—but not down as some had feared.
New home sales rebounded 3.3 percent, following a 7.3 percent drop in March and a 5.6 percent gain in February. The April annualized pace of 343,000 is still a little below the recent high of 358,000 in February but is up 9.9 percent on a year-ago basis, suggesting upward lift over a longer period.
There have been indications that home prices are firming but it is not evident in this report where the median monthly price rose slightly while the average price slipped. Again, composition shifts make interpretations of price changes difficult.
Months’ supply in April slipped to 5.1 months from 5.2 the month before. The latest number is down substantially from the recent recession high of 11.6 in October 2008. Homebuilders’ efforts to bring supply in line (by sharply reducing new construction) have paid off.
 The FHFA home price index rose an outsized 1.8 percent in March, following a 0.3 percent gain in February and a 0.5 percent decline in January. The year-on-year rate also surged, to plus 2.7 percent versus the two prior readings of plus 0.3 percent and minus 1.3 percent. The FHFA home price index rose an outsized 1.8 percent in March, following a 0.3 percent gain in February and a 0.5 percent decline in January. The year-on-year rate also surged, to plus 2.7 percent versus the two prior readings of plus 0.3 percent and minus 1.3 percent.
Scheduled increases in April for FHFA mortgage insurance premiums tripped a surge in mortgage applications in late March and may also be at play in this data. Homebuyers may have been willing to pay a higher price in March to avoid higher premiums in April. Or demand is simply stronger and home sellers are no longer in a price cutting mood.
However, the fact that home sales improved in April despite higher mortgage insurance premiums indicates that the housing market is getting better, albeit slowly.
 Recent manufacturing data have been mixed. But the latest national data from the government suggests that manufacturing has lost some steam. Durables orders made a slight 0.2 percent comeback in April, following a 3.7 percent decrease the month before. Recent manufacturing data have been mixed. But the latest national data from the government suggests that manufacturing has lost some steam. Durables orders made a slight 0.2 percent comeback in April, following a 3.7 percent decrease the month before.
Excluding transportation, durables declined 0.6 percent after a revised 0.8 percent drop in March.
The transportation component posted a 3.1 percent boost after rising 2.3 percent in March. Subcomponent strength was in nondefense aircraft, up a monthly 7.2 percent, and motor vehicles, up 5.6 percent. Defense aircraft dropped a monthly 34.0 percent.
Weakness was widespread outside of transportation. Declines were led by machinery and fabricated metals with declines also seen in computers & electronics and in electrical. Those showing improvement were primary metals and “other.”
The outlook for near-term business investment in equipment has softened over the last two months. New orders for nondefense capital goods excluding aircraft declined 1.9 percent in April and dipped 2.2 percent in March but followed a gain of 2.9 percent in February. Shipments for this series eased 1.4 percent in March, following a 1.9 percent boost the prior month.
The April durables report indicates softening in the manufacturing sector. While manufacturing surveys do not always track government statistics, traders likely will be looking for more encouraging news from these surveys in coming weeks. More recent manufacturing surveys for May have been mixed but still in positive growth territory.
This past week, Markit Economics released for the first time a U.S. version of its purchasing managers’ indexes already produced for a number of other countries. The Markit PMI is similar in nature to the ISM report, with diffusion indexes for various components based on survey data from manufacturers. Markit has a flash version of the data for a given month released the last week of that month with the final released about a week later.
Growth is slowing this month in the US manufacturing sector based on the flash PMI from Markit Economics which slipped 2.1 points to 53.9, a level over 50 to indicate monthly growth but below April to indicate a slower rate of growth. But readings were nevertheless healthy and include moderate growth for new orders, for output and for employment. Inventories were steady though levels may be on the high side given slowing growth in orders. Price readings show minimal and easing pressures.
One area of softness is exports where order growth was minimal, the result of weakness in Europe and slowing in China. The latest results do underscore the slowing seen in April's durable goods orders, yet the US manufacturing sector continues to expand and manufacturers continue to add to payrolls.
The PMI is a composite index based on five of the individual indexes with the following weights: new orders, 30 percent; output, 25 percent; employment, 20 percent; suppliers’ delivery times, 15 percent; and stocks of items purchased, 10 percent. The value of the delivery times index is inverted so that it moves in a comparable direction.
 The latest two regional Fed surveys show one region slowing and the other picking up strength. The latest two regional Fed surveys show one region slowing and the other picking up strength.
Growth slowed sharply in May in the Richmond Fed District’s manufacturing sector, underscoring the even weaker results in last week's Mid-Atlantic report from the Philly Fed. The Richmond Fed's manufacturing index fell 10 points to 4 to indicate a slowing to only a slight rate of monthly growth.
Shipments were flat and new orders show only minimal growth, posting a 1 versus 13 in April. Lack of notable growth in new orders and a big contraction in backlog orders point to weakness for future shipments and production for this region.
However, a big plus in the report was a rise in the employment index to 16 from 10, indicating some optimism on the part of factory managers.
In contrast to the Richmond report, the Kansas City survey for May showed general—but moderate—acceleration in manufacturing activity.  The Kansas City Fed composite index rebounded to its March level of 9 from April's reading of 3. According to the Bank, producers were more optimistic than in previous months. The majority of producers reported stable or increasing capital spending plans in the next six to twelve months, with very few 12 anticipating a decrease. The Kansas City Fed composite index rebounded to its March level of 9 from April's reading of 3. According to the Bank, producers were more optimistic than in previous months. The majority of producers reported stable or increasing capital spending plans in the next six to twelve months, with very few 12 anticipating a decrease.
The new orders index moved higher into positive territory, rising to plus 10 from minus 8 in April. Backlogs improved marginally, moving up to minus 3 from minus 5. The production index jumped to 17 from 0 in April.
Overall, manufacturing is still positive but the question remains on whether growth is slowing or accelerating.
 The Reuters/University of Michigan consumer sentiment index got a sizeable upgrade for May, indicating a notably more optimistic second half of the month. The Reuters/University of Michigan consumer sentiment index got a sizeable upgrade for May, indicating a notably more optimistic second half of the month.
Apparently, the recent sell-off in the stock market and rising problems in Europe are not rattling the U.S. consumer whose sentiment is clearly stronger than it has ever been during the recovery. The consumer sentiment index jumped to 79.3, up nearly 3 points from April and up 1.5 points from the mid-month reading. This last comparison, which puts the index at an implied 80.8 over the past two weeks, indicates that the rise in optimism is now picking up intensity.
 The decline underway at the gas pump, where prices have come down about 5 percent this month, is likely a central and more visible factor for the consumer and is offsetting troubles elsewhere. Inflation expectations are down with 1-year expectations at 3.0 percent, down 2 tenths from April, and with 5-year expectations at 2.7 percent which is down 2 tenths from April. The decline underway at the gas pump, where prices have come down about 5 percent this month, is likely a central and more visible factor for the consumer and is offsetting troubles elsewhere. Inflation expectations are down with 1-year expectations at 3.0 percent, down 2 tenths from April, and with 5-year expectations at 2.7 percent which is down 2 tenths from April.
Other readings include month-end recovery bests for both current conditions, at 87.2, and expectations at 74.3. This latter reading is where the last two weeks of strength is centered, which hints at rising optimism on future job prospects and for future income power.
The manufacturing sector is not as strong as it had been but is still growing, albeit slowly. However, housing has stabilized and appears to be on a modest uptrend. Notably, the consumer sector is showing signs of renewed optimism.
Everything leads up to Friday’s jobs report for May. Traders hope to see improvement from last month’s meager gains. However, before Friday, a slew of reports covering the consumer are posted, including ADP employment, confidence, income, personal spending, and motor vehicle sales. Housing updates include pending home sales and Case-Shiller home prices. For updates on manufacturing, the ISM, Markit final PMI, and Kansas City surveys will be released.
U.S. Holiday: Memorial Day
Bond & Equity Markets Closed
The S&P/Case-Shiller 20-city home price index (SA) in February rose a monthly 0.2 percent, following a 0.1 percent dip the prior month. The year-on-year rate (unadjusted) improved to minus 3.5 from a revised minus 3.9 in February. As usual, the numbers vary sharply by city. On the plus side, Phoenix continued a string of pluses, rising 2.1 percent in the latest month. Miami and Minneapolis also are having a nice run upward. On the downside, Atlanta continued its slide, dipping 2.0 percent in February. Also with negative consecutive strings are Chicago, New York, and Cleveland.
The S&P/Case-Shiller 20-city HPI (SA, m/m) Consensus Forecast for March 12: +0.3 percent
Range: -0.2 to +0.7 percent
The S&P/Case-Shiller 20-city HPI (NSA, y/y) Consensus Forecast for March 12: -2.7 percent
Range: -3.0 to -2.0 percent
The Conference Board's consumer confidence index in April slipped three tenths to a no better than soft 69.2. But there is good news led by a 3.2 percentage point decline to 37.5 percent in those who say jobs are hard to get right now. More also say business conditions are currently good while inflation expectations, reflecting the easing in gas prices, are down four tenths in the month to 5.8 percent. An offsetting factor was a 1.5 percentage point decline to 14.0 percent for those who see their income rising.
Consumer confidence Consensus Forecast for May 12: 69.7
Range: 67.5 to 72.0
The Dallas Fed general business activity index in April turned negative after three months of positive readings, falling from 10.8 to minus 3.4. But the overall report was mixed but mostly turning less positive or mildly negative. Texas factory activity increased in April, according to the production index which slowed from 11.1 to 5.6, suggesting growth continued but at a slower pace than last month. Shipment volumes were flat in April after increasing for the previous three month with the shipments index down from 8.6 to minus 0.8. The new orders index posted a near-zero reading for the second consecutive month.
Dallas Fed general business activity index Consensus Forecast for May 12: 3.0
Range: 0.0 to 6.0
The pending home sales index in March jumped 4.1 percent, convincingly extending the strong upward trend for the pending home sales index. The number of contract signings for purchases of existing homes has been moving higher since September, as have the closings of these purchases. Pending sales were up in five of the last six months. But the gain in closings, at only five percent during this period, is badly lagging the 17 percent gain for signings. Still, the gain for March was unusually strong and given the usual stumbling blocks to closings—appraisal problems, credit problems—the March report provides some moderate optimism for the spring housing market.
Pending home sales Consensus Forecast for April 11: +0.5 percent
Range: -2.0 to +3.1 percent
ADP private payroll employment for April was estimated to rise by only 119,000 in what would be significant monthly slowing versus a revised 201,000 in March. The later released BLS figure for April private payrolls was a 130,000 gain.
ADP private payrolls Consensus Forecast for May 12: 154,000
Range: 95,000 to 189,000
GDP growth slowed in the first quarter with a drop in government spending being the big negative. The positive was a moderate acceleration in consumer spending. GDP growth eased to 2.2 percent from 3.0 percent in the fourth quarter. However, the component mix showed modest improvement in demand. Final sales of domestic product increased an annualized 1.6 percent in the first quarter after a 1.1 percent rise in the fourth. Final sales to domestic purchasers (excludes net exports) advanced 1.6 percent, following a 1.3 percent gain in the fourth quarter. Economy-wide inflation according to the GDP price index picked up to 1.5 percent annualized from 0.9 percent in the fourth quarter.
Real GDP Consensus Forecast for second estimate Q1 12: +1.9 percent annual rate
Range: +1.6 to +2.1 percent annual rate
GDP price index Consensus Forecast for second estimate Q1 12: +1.5 percent annual rate
Range: +1.5 to +1.5 percent annual rate
Initial jobless claims for the May 19 week came in at 370,000 versus a revised 372,000 in the prior week and compared with another 370,000 reading the week before. The four-week average was down for a third week in a row, also at 370,000 for a roughly 15,000 improvement from late April. Continuing claims have been trending sharply lower and were down 29,000 in data for the May 12 week. The four-week average was down 17,000 to another recovery low of 3.272 million.
Jobless Claims Consensus Forecast for 5/26/11: 370,000
Range: 367,000 to 377,000
The Chicago PMI slowed to 56.2 in April from 62.2 the month before. While disappointing, the index remained well above 50 to indicate growth compared to March. While disappointing, the April index (being above the 50 level) still reflects a moderately positive growth rate.
Growth in new orders and growth in production both slowed but with readings in the 57 area both remained very strong. Especially strong in April were backlog orders which, nearly at 57, showed the strongest monthly build so far this year. Employment was also strong, up nearly 1-1/2 points to nearly 59.
Chicago PMI Consensus Forecast for May 12: 56.1
Range: 55.0 to 60.0
Nonfarm payroll employment in April increased only 115,000, following increases of 154,000 in March and 259,000 in February. Private payrolls rose 130,000 in April after a 166,000 increase the prior month. From the household survey, the unemployment rate dipped to 8.1 percent from 8.2 percent in March. Back to the payroll survey, goods-producing industry employment rose 14,000 after a 38,000 boost in March. Private service-providing industry employment rose 116,000, following a 128,000 gain in March. The public sector continued to downsize with a 15,000 drop in government employment. Average hourly earnings were flat, following a 0.2 percent gain in March. The average workweek for all workers in April was steady at 34.5 hours.
Nonfarm payrolls Consensus Forecast for May 12: 150,000
Range: 95,000 to 206,000
Private payrolls Consensus Forecast for May 12: 164,000
Range: 100,000 to 209,000
Unemployment rate Consensus Forecast for May 12: 8.1 percent
Range: 8.0 to 8.2 percent
Average workweek Consensus Forecast for May 12: 34.5 hours
Range: 34.5 to 34.5 hours
Average hourly earnings Consensus Forecast for May 12: +0.2 percent
Range: +0.1 to +0.2 percent
Personal income in March improved 0.4 percent after a 0.3 percent rise the month before. The important wages & salaries component gained 0.3 percent after advancing 0.4 percent in February. Consumer spending in March increased 0.3 percent, compared to a 0.9 percent in surge in February. By components, durables dipped 0.3 percent in March (autos declined after a strong February); nondurables jumped 0.9 percent on higher gasoline prices; and services edged up 0.1 percent. On the inflation front, the headline PCE price index rose 0.2 percent, compared to 0.3 percent in February. The core rate firmed to 0.2 percent in March from 0.1 percent the prior month.
Looking ahead, aggregate private earnings rose 0.2 percent, suggesting a modest rise in the private wages & salaries component of personal income for April. Consumer spending may be sluggish in April but perhaps still positive. Unit new motor vehicle sales edged up 0.3 percent while retail sales excluding autos rose a slight 0.1 percent. On the inflation front, headline PCE inflation is likely to be near flat as the overall CPI was unchanged. The core CPI was warmer with a 0.2 percent rise for April.
Personal income Consensus Forecast for April 12: +0.3 percent
Range: +0.1 to +0.4 percent
Personal consumption expenditures Consensus Forecast for April 12: +0.3 percent
Range: +0.1 to +0.5 percent
PCE price index Consensus Forecast for April 12: +0.1 percent
Range: 0.0 to +0.1 percent
Core PCE price index Consensus Forecast for April 12: +0.2 percent
Range: +0.1 to +0.2 percent
The composite index from the ISM manufacturing survey in April rose 1.4 points to 54.8. Importantly, the new orders index was up to 58.2 from 54.5 in March, showing sizably greater monthly growth. Production was strong and, importantly, manufacturers in the sample added significantly to their payrolls.
ISM manufacturing composite index Consensus Forecast for May 12: 54.0
Range: 51.0 to 54.5
Construction spending rebounded 0.1 percent in March after falling 1.4 percent the prior month. The rise in March was led by both private residential and private nonresidential outlays. Private residential outlays gained 0.7 percent after dropping 2.2 percent in February. The latest number was led by the new one-family subcomponent. Private nonresidential outlays advanced 0.7 percent, following a 1.7 percent dip the month before. Public outlays fell 1.1 percent after a 0.3 percent decline in February.
Construction spending Consensus Forecast for April 12: +0.4 percent
Range: 0.0 to +0.7 percent
Sales of total light motor vehicles were steady in April compared to March. Sales came in at a 14.4 million annual rate, unchanged from the pace in March. But at more precise decision precision, April was 14.419 million units versus 14.369 million in March, resulting in a 0.3 percent gain. The breakdown showed slight strength on the truck side and slight slowing for cars.
Motor vehicle domestic sales Consensus Forecast for May 12: 11.1 million-unit rate
Range: 11.1 to 11.3 million-unit rate
Motor vehicle total sales Consensus Forecast for May 12: 14.5 million-unit rate
Range: 14.2 to 14.8 million-unit rate
R. Mark Rogers is the author of The Complete Idiot’s Guide to Economic Indicators, Penguin Books, 2009.
Econoday Senior Writer Mark Pender contributed to this article.
|
