|
Looking at this week’s movement in equities, the view was somewhat negative. But just looking at economic data, the signs were moderately positive. The recovery remains quite real.
 Indexes were down moderately for the week. At week’s open equities were mixed as traders digested Europe's election results that cast doubt on the region's ability to tackle its debt crisis. The results of Sunday’s elections in France and Greece initially upset investors. In Greece, the two mainstream parties and the austerity policies they backed, received less than a third of the votes combined. In France, Socialist Francois Hollande won the presidency over incumbent Nicolas Sarkozy, raising pressure on Germany to pursue a more growth oriented approach to the regional crisis. Also, a surge in U.S. consumer credit was seen as a plus for the economy. Indexes were down moderately for the week. At week’s open equities were mixed as traders digested Europe's election results that cast doubt on the region's ability to tackle its debt crisis. The results of Sunday’s elections in France and Greece initially upset investors. In Greece, the two mainstream parties and the austerity policies they backed, received less than a third of the votes combined. In France, Socialist Francois Hollande won the presidency over incumbent Nicolas Sarkozy, raising pressure on Germany to pursue a more growth oriented approach to the regional crisis. Also, a surge in U.S. consumer credit was seen as a plus for the economy.
Tuesday, economic news was good as the National Federation of Independent Business's small business optimism index hit the highest level since December 2007. But worries over Greece overshadowed, thumping stocks, due to concerns about the ability of the country to form a new government and address debt issues.
At mid-week, with no U.S. economic news, the focus remained on Europe, further pushing down equities. Concerns remained despite some assurances that Greece would receive the next round of its bailout package. Also, worries about Spanish banks weighed on stocks. Investors were concerned that the Spanish government would need to inject public funds to save banks.
Thursday was the largely positive day for the week. Initial jobless claims nudged down from a relatively low level the prior week and international trade showed exports hitting a record high for the U.S. But gains were modest due to continued worries over Europe. After Thursday close, JPMorgan Chase announced a large and unexpected loss due to bad trading strategy, setting a negative tone for equities on Friday, especially financials. At week’s close, equities posted modest declines largely due to concerns from JPMorgan losses. Partially offsetting was a better-than-expected consumer sentiment reading for mid-May. Also, the Treasury posted a monthly surplus, suggesting that revenues and the economy are better than believed.
Equities were down this past week. The Dow was down 1.7 percent; the S&P 500, down 1.1 percent; the Nasdaq, down 0.8 percent; the Russell 2000, down 0.2 percent; and the Wilshire 5000, down 1.0 percent.
For the year-to-date, major indexes are up as follows: the Dow, up 4.9 percent; the S&P 500, up 7.6 percent; the Nasdaq, up 12.6 percent; the Russell 2000, up 6.6 percent; and the Wilshire 5000, up 7.8 percent.
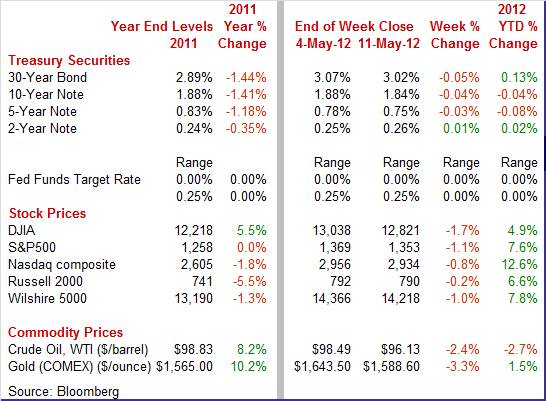
Weekly percent change column reflects percent changes for all components except interest rates. Interest rate changes are reflected in simple differences.
 Treasuy yields were mostly down this past week. Daily swings were modest. After no change Monday, rates eased Tuesday as worries over Greece’s struggle to form a government led to mild flight to safety. Treasuy yields were mostly down this past week. Daily swings were modest. After no change Monday, rates eased Tuesday as worries over Greece’s struggle to form a government led to mild flight to safety.
After little change Wednesday, yields firmed Thursday as traders gave a bit more attention to U.S. data—including favorable initial jobless claims and a Treasury budget for April with a surplus not seen for that month in three years.
The week ended with rates declining modestly on news of losses at JPMorgan and also on failure of Greek political leaders to form a government.
For this past week Treasury rates were down as follows: the 5-year note, down 3 basis points; the 7-year note, down 4 basis points; the 10-year note, down 4 basis points; and the 30-year bond, down 5 basis points. The 3-month T-bill rose 2 basis points while the 2-year note nudged up 1 basis point.
 The spot price of crude drifted down most of the week with Thursday being a marginal exception. The spot price of crude drifted down most of the week with Thursday being a marginal exception.
Early in the week, crude slipped on worries about European elections. On Tuesday, WTI declined on comments from a Saudi oil minister that prices should ease. A higher dollar also weighed on crude.
At mid-week, prices nudged barely lower and then on Thursday edged back up on healthy jobless claims.
On Friday, spot WTI declined about a dollar a barrel on news of a slowing in China’s industrial growth and on concern that the debt crisis in Europe will worsen.
Net for the week, the spot price for West Texas Intermediate dropped $2.36 per barrel to settle at $96.13.
Despite the negative news in equity markets, economic indicators actually were more notably more positive than not.
 The big issue is about growth in global and U.S. demand. The latest monthly international trade reports indicate that both appear better in March. The trade balance worsened in the latest numbers but the details are encouraging as both exports and non-petroleum imports gained. In March, the U.S. trade gap expanded to $51.8 billion from $45.4 billion in February. Exports rose 2.9 percent after a 0.3 percent increase in February. Exports hit a record high. They also have risen four months in a row. Imports rebounded a sharp 5.2 percent, following a 2.8 percent drop the month before. The big issue is about growth in global and U.S. demand. The latest monthly international trade reports indicate that both appear better in March. The trade balance worsened in the latest numbers but the details are encouraging as both exports and non-petroleum imports gained. In March, the U.S. trade gap expanded to $51.8 billion from $45.4 billion in February. Exports rose 2.9 percent after a 0.3 percent increase in February. Exports hit a record high. They also have risen four months in a row. Imports rebounded a sharp 5.2 percent, following a 2.8 percent drop the month before.
The worsening in the trade gap was led by the non-petroleum goods deficit which ballooned to $38.8 billion from $32.8 billion in February. The petroleum goods gap also grew—to $28.6 billion from $27.6 billion. The services surplus expanded to $38.3 billion from $37.9 billion.
 Goods exports were led by industrial supplies and capital goods excluding autos. Goods exports were led by industrial supplies and capital goods excluding autos.
Goods imports surged on rebounds in capital goods excluding autos, consumer goods, and industrial supplies. Autos and the foods, feeds & beverages components also made comebacks.
While the overall trade number is a negative for GDP in the short term, the details indicate that demand is stronger than seen earlier with gains in exports and imports. This suggests that manufacturing may not be taking much of a hit from Europe and also that businesses are betting on growth in consumer demand and business investment.
 The Reuters/University of Michigan in early May was up a solid 1.4 points at mid-month to a preliminary 77.8 versus April's 76.4. The latest reading edges out February 2011 for the best reading so far of the recovery. Twice before, early 2010 and early last year, the index tested the 75 area and each time the index quickly fizzled. But the tea leaves are hard to read for the near term future. The Reuters/University of Michigan in early May was up a solid 1.4 points at mid-month to a preliminary 77.8 versus April's 76.4. The latest reading edges out February 2011 for the best reading so far of the recovery. Twice before, early 2010 and early last year, the index tested the 75 area and each time the index quickly fizzled. But the tea leaves are hard to read for the near term future.
 The latest report showed a decline in the expectations component, which is now off recovery highs with a six tenth dip to 71.7. Optimism over the future is limited, a factor that limits consumer spending. The good news in the report is a rise in the assessment of current conditions, up a very strong 4.4 points to a recovery best 87.3. This is the reading that points to strength for May's economic data. And lower gasoline prices may be coming into play for improved sentiment.
And with gas prices coming down inflation expectations remain stable, at 3.1 percent for one-year expectations, down one tenth from April, and at 3.0 percent for 5-year expectations which is up one tenth.
 The consumer credit report generally is hard to read in terms of whether numbers are good or bad, regardless of direction. The reason for change matters and the numbers do not always make it clear. But for the last few reports, one of the apparent reasons for credit growth is not good—though others likely are. The consumer credit report generally is hard to read in terms of whether numbers are good or bad, regardless of direction. The reason for change matters and the numbers do not always make it clear. But for the last few reports, one of the apparent reasons for credit growth is not good—though others likely are.
Consumers over the last half year are borrowing more but not entirely for consumer goods. Consumer credit outstanding jumped $21.4 billion to $2.54 trillion in March. Prior months show very sizable gains of $20.0 billion in November, $16.3 billion in December, $18.6 billion in January, and $9.3 billion in an upwardly revised February. The gain is being led, not by revolving credit (which is not good news for chain stores), but by non-revolving credit where the gain is concentrated in student loans.
What this points out is that the jobs market is still flailing and that many college graduates are choosing between flipping hamburgers and waiting tables or going to grad school. And grad school appears to be winning to some degree. Still, non-revolving credit also is up on healthy motor vehicle loans and that clearly is a good thing.
Also revolving credit did rise, up $5.2 billion in the month following two prior months of declines. This may reflect a consumer that believes the economy is strong enough (for those with jobs) to take on new debt.
 Weaker energy cost pulled down the headline PPI in the latest report. The PPI in April fell 0.2 percent after a flat reading in March. The core PPI, however, rose 0.2 percent following a 0.3 percent boost in March. The consensus forecast was for a 0.2 percent increase. Weaker energy cost pulled down the headline PPI in the latest report. The PPI in April fell 0.2 percent after a flat reading in March. The core PPI, however, rose 0.2 percent following a 0.3 percent boost in March. The consensus forecast was for a 0.2 percent increase.
By major components, energy dropped 1.4 percent after declining 1.0 percent in March. Gasoline prices declined 1.7 percent after a 2.0 percent dip the month before. Food cost inflation was steady at 0.2 percent.
 Within the core, nearly a quarter of the April rise was attributable to a 0.4-percent advance in the index for pharmaceutical preparations. Higher prices for civilian aircraft also were a factor in the increase in the finished core index. The “usual suspects” for monthly volatility—passenger cars, light trucks, and tobacco components—each rose only 0.1 percent for the month of April Within the core, nearly a quarter of the April rise was attributable to a 0.4-percent advance in the index for pharmaceutical preparations. Higher prices for civilian aircraft also were a factor in the increase in the finished core index. The “usual suspects” for monthly volatility—passenger cars, light trucks, and tobacco components—each rose only 0.1 percent for the month of April
For the overall PPI, the year-ago rate in April was 1.9 percent, compared to 2.8 in March (seasonally adjusted). The core rate in April eased to 2.8 percent from 2.9 percent the month before.
The latest numbers (especially with energy heading down) technically give the Fed more room for additional easing. However, that does not mean the Fed will.
 Energy was the big news on import prices. A monthly swing lower in oil made for a sizable 0.5 percent decline in April import prices. Energy was the big news on import prices. A monthly swing lower in oil made for a sizable 0.5 percent decline in April import prices.
The price of imported crude, often volatile month-to-month, fell 3.2 percent to pull back prices of oil-based products including petroleum and industrial supplies. But even when excluding oil products, import prices show no pressure, unchanged in the month following muted readings through the first quarter.
 Sluggish global growth and a stronger dollar are helping keep a lid on imported inflation. There's no sign of inflation in the year-on-year readings which show a run of low single digit declines except, interestingly, for finished goods which show low single digit growth. Sluggish global growth and a stronger dollar are helping keep a lid on imported inflation. There's no sign of inflation in the year-on-year readings which show a run of low single digit declines except, interestingly, for finished goods which show low single digit growth.
On a year-ago basis, overall import prices were up 0.5 percent in April, compared to 3.6 percent the prior month. Excluding petroleum products, these were 0.7 percent and 1.5 percent, respectively.
Demand appears to be growing and inflation is slowing. Both help the recovery grow stronger—although still less than preferred.
The crowded calendar focuses on the goods-producing and consumer sectors. April retail sales post Tuesday. Factory activity is updated with Empire State (Tuesday), industrial production (Wednesday), and Philly Fed (Thursday). Housing starts also are released Wednesday along with the Fed’s FOMC minutes later that afternoon.
The consumer price index in March increased 0.3 percent, following a 0.4 percent boost in February. Excluding food and energy, the CPI firmed to a 0.2 percent gain in March, following a 0.1 percent uptick the prior month. By major components, energy jumped 0.9 percent, following a 3.2 percent surge in February. Food price inflation increased to 0.2 percent from no change in February. Within the core, apparel prices rebounded after declining in February. Used car prices jumped sharply. And shelter costs firmed.
CPI Consensus Forecast for April 12: 0.0 percent
Range: -0.1 to +0.4 percent
CPI ex food & energy Consensus Forecast for April 12: +0.2 percent
Range: 0.0 to +0.2 percent
Retail sales in March advanced 0.8 percent after increasing 1.0 percent the prior month. Motor vehicle sales gained 0.9 percent, following a 1.3 percent increase in February. Excluding motor vehicles, retail sales gained 0.8 percent after increasing 0.9 percent in February With prices still rising in March on average, gasoline sales increased 1.1 percent after a 3.6 percent surge the month before. Sales excluding autos and gasoline in March rose a healthy 0.7 percent, following a 0.5 percent jump the prior month.
Retail sales Consensus Forecast for April 12: +0.1 percent
Range: -0.3 to +0.8 percent
Retail sales excluding motor vehicles Consensus Forecast for April 12: +0.2 percent
Range: -0.4 to +0.8 percent
Less motor vehicles & gasoline Consensus Forecast for April 12: +0.3 percent
Range: -0.2 to +0.5 percent
The Empire State manufacturing index in April softened notably to 6.56, down from readings of around the 20 level in the prior two months. April was still in positive territory. But the new orders index was essentially steady at 6.48 versus 6.84 in March, indicating continued moderate growth.
Empire State Manufacturing Survey Consensus Forecast for May 12: 10.00
Range: 2.00 to 15.00
Business inventories rose 0.6 percent in February against a 0.8 percent rise in sales, a mix that holds the inventory-to-sales ratio at a very lean 1.28. Inventories in the retail sector are increasingly lean, with the ratio at 1.32 versus 1.33 in January. More recent strong results in the March retail sales report suggest that retailers are scrambling to keep their inventories high enough to meet demand.
Business inventories Consensus Forecast for March 11: +0.4 percent
Range: +0.2 to +0.7 percent
NAHB housing market index in April after seven months of straight gains, fell back, down three points to 25. All three components were down with the greatest decline, in what is a clearly negative indication, coming in buyer traffic.
NAHB housing market index Consensus Forecast for May 12: 26
Range: 23 to 30
Housing starts dipped 5.8 percent in March after decreasing 2.8 percent in February. The March pace of 0.654 million units was up 10.3 percent on a year-ago basis. In March, weakness was led by the multifamily component although single-family edged down. Permits gained 4.5 percent, following a 4.8 percent increase in February. The latest figure of 0.747 million units was up 30.1 percent on a year-ago basis. Strength was in the multifamily component, which jumped 20.8 percent, while the single-family component declined 3.5 percent for the month.
Housing starts Consensus Forecast for April 12: 0.690 million-unit rate
Range: 0.641 million to 0.730 million-unit rate
Housing permits Consensus Forecast for April 12: 0.725 million-unit rate
Range: 0.710 million to 0.777 million-unit rate
Industrial production was unchanged in March after a flat reading the month before. By major components, manufacturing slipped 0.2 percent, following a 0.8 percent increase in February. For the latest month, utilities output rose 1.5 percent. Mining output firmed 0.2 percent. The bright spot in the report was for motor vehicles and parts which advanced 0.6 percent, following a 0.8 percent boost in February. Overall capacity utilization edged down to 78.6 percent from 78.7 percent in February.
Industrial production Consensus Forecast for April 12: +0.5 percent
Range: 0.0 to +0.9 percent
Manufacturing production component Consensus Forecast for April 12: +0.7 percent
Range: +0.2 to +0.8 percent
Capacity utilization Consensus Forecast for April 12: 79.0 percent
Range: 78.6 to 79.2 percent
The Minutes of the April 24-25 FOMC meeting are scheduled for release at 2:00 p.m. ET.
While the latest FOMC statement showed little change from the prior statement, traders will be looking at the details of the minutes for any increased likelihood of QE3.
Initial jobless claims in the May 5 week edged lower to 367,000 following the prior week's slightly revised 368,000. These mark a return to the 360,000 levels in March. The four-week average illustrates the improvement, down for the first time in five weeks to show a sizable 5,250 decrease to 379,000. Continuing claims are extending their long contraction, down 61,000 in the data for the April 28 week to 3.229 million. The four-week average is down 11,000 to 3.290 million.
Jobless Claims Consensus Forecast for 5/12/12: 365,000
Range: 360,000 to 375,000
The general business conditions index of the Philadelphia Fed's Business Outlook Survey continued relatively steady at 8.5 in April, over zero to indicate monthly growth but a bit under March's 12.5 level to indicate a slowing rate of growth. Growth was quite slow for new orders as the index came in at 2.7 versus 3.3 in March. Six-month outlook readings were steady and strong and were led by increasing expectations for future employment gains. The six-month outlook index for general business activity rose to 33.8 from 32.9.
Philadelphia Fed survey Consensus Forecast for May 12: 10.0
Range: 5.0 to 13.0
The Conference Board's index of leading indicators gained 0.3 percent in March, following a 0.7 percent boost the prior month. The March index was led, as it often has during the Fed's zero-rate policy, by the spread between short and long rates. But signals outside this factor were also positive especially growth underway in building permits -- which is an important and hopeful signal of badly needed recovery for the housing sector. Current economic growth has been steady, according to the coincident index with gains of 0.2 percent in each of the two latest months.
Leading indicators Consensus Forecast for April 12: +0.1 percent
Range: 0.0 to +0.3 percent
R. Mark Rogers is the author of The Complete Idiot’s Guide to Economic Indicators, Penguin Books, 2009.
Econoday Senior Writer Mark Pender contributed to this article.
|
