|
April job growth was very modest although the prior two months’ gains were revised up. Seasonality issues are still being debated: whether an atypically warm winter moved economic activity forward, leaving a soft early spring. But even on average, economic growth is sluggish. But there were some moderately positive details within the latest employment report.
 It was not a good week for equities. Economic news was not favorable and corporate news was mixed and not strong enough to offset. Europe mainly provided downdraft for the week. It was not a good week for equities. Economic news was not favorable and corporate news was mixed and not strong enough to offset. Europe mainly provided downdraft for the week.
At the week’s start, a moderately positive personal income report was more than offset by a sharp slowing in the Chicago PMI and news from Europe that Spain had slipped into a technical recession after its GDP contracted for a second quarter in a row thanks in part to deep government spending cuts. Stocks mostly made a rebound Tuesday as ISM manufacturing was favorable, rising and showing a contrast to recent sluggish regional surveys.
 At mid-week, stocks were mixed. ADP private employment was soft and below expectations. Corporate earnings were mixed on the day. Thursday saw a drop is stocks even with an unexpectedly strong drop in initial jobless claims. The focus was on a very soft ISM non-manufacturing report that was in positive territory but unexpectedly down from March. Equities fell further on Friday after an anemic employment report for April. At mid-week, stocks were mixed. ADP private employment was soft and below expectations. Corporate earnings were mixed on the day. Thursday saw a drop is stocks even with an unexpectedly strong drop in initial jobless claims. The focus was on a very soft ISM non-manufacturing report that was in positive territory but unexpectedly down from March. Equities fell further on Friday after an anemic employment report for April.
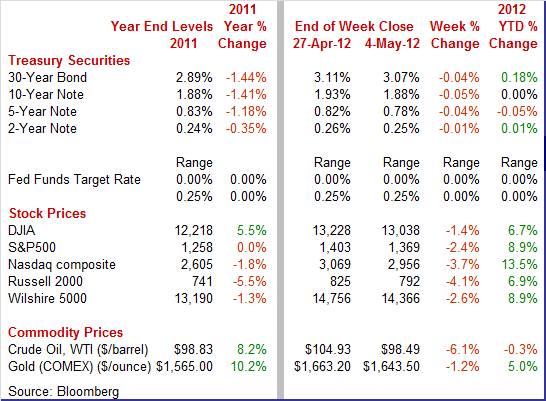
Equities were down this past week. The Dow was down 1.4 percent; the S&P 500, down 2.4 percent; the Nasdaq, down 3.7 percent; the Russell 2000, down 4.1 percent; and the Wilshire 5000, down 2.6 percent.
Equities were mostly down in April. The Dow was incrementally up but essentially flat; the S&P 500, was down 0.7 percent; the Nasdaq, down 1.5 percent; the Russell 2000, down 1.6 percent; and the Wilshire 5000, down 0.8 percent.
For the year-to-date, major indexes are up as follows: the Dow, up 6.7 percent; the S&P 500, up 8.9 percent; the Nasdaq, up 13.5 percent; the Russell 2000, up 6.9 percent; and the Wilshire 5000, up 8.9 percent.
Weekly percent change column reflects percent changes for all components except interest rates. Interest rate changes are reflected in simple differences.
 Treasury yields were down modestly for the week. There were only modest daily moves even with the disappointing jobs report on Friday. Rates were little changed Monday as a sluggish Chicago PMI offset moderate positives in the personal income report. Rates firmed a bit Tuesday on a healthier-than-expected ISM manufacturing report. Treasury yields were down modestly for the week. There were only modest daily moves even with the disappointing jobs report on Friday. Rates were little changed Monday as a sluggish Chicago PMI offset moderate positives in the personal income report. Rates firmed a bit Tuesday on a healthier-than-expected ISM manufacturing report.
As with equities, the weak ADP report bumped Treasury yields down at mid-week. On Thursday, a drop in initial jobless claims and a sluggish ISM non-manufacturing report neutralized each other, leaving rates unchanged. The Friday employment situation report was very soft and led rates down at week’s end but only moderately.

Overall, yields are low on a sluggish economy, continued Fed ease, and concern about European sovereign debt and apparent recurring recession in some countries.
For this past week Treasury rates were down as follows: 3-month T-bill, down 2 basis points; the 2-year note, down 1 basis point; the 5-year note, down 4 basis points; the 7-year note, down 5 basis points; the 10-year note, down 5 basis points; and the 30-year bond, down 4 basis points.
 May as well cut to the chase—only two days really mattered in the oil markets this past week. After mild oscillations the first three days of the week, the spot price of West Texas Intermediate dropped Thursday by a little more than 2-1/2 bucks per barrel on ab unexpectedly weak ISM non-manufacturing report. And crude fell just over 4 dollars a barrel on Friday on the disappointing jobs report. May as well cut to the chase—only two days really mattered in the oil markets this past week. After mild oscillations the first three days of the week, the spot price of West Texas Intermediate dropped Thursday by a little more than 2-1/2 bucks per barrel on ab unexpectedly weak ISM non-manufacturing report. And crude fell just over 4 dollars a barrel on Friday on the disappointing jobs report.
Net for the week, the spot price for West Texas Intermediate dropped $6.44 per barrel to settle at $98.49. This is the first time spot WTI settled below $100 per barrel since early February 2012. This will help the Fed with its forecast for softening inflation and may even put back a little money in consumer wallets. Lower gasoline prices will help offset soft employment.
The big news was a very disappointing jobs report for April. Other news was mixed but more on the soft side. Seasonality issues continue to be debated, regarding the impact of a warm winter on spring activity.
 April jobs were softer than expected but there were upward revisions and the unemployment rate dipped to 8.1 percent from 8.2 percent in March. Seasonality issues apparently are still at play. Payroll jobs in April increased only 115,000, following increases of 154,000 in March (originally 120,000) and 259,000 in February (prior estimate up 240,000). The net revisions for February and March were up 53,000. Analysts expected a 165,000 increase for April. April jobs were softer than expected but there were upward revisions and the unemployment rate dipped to 8.1 percent from 8.2 percent in March. Seasonality issues apparently are still at play. Payroll jobs in April increased only 115,000, following increases of 154,000 in March (originally 120,000) and 259,000 in February (prior estimate up 240,000). The net revisions for February and March were up 53,000. Analysts expected a 165,000 increase for April.
Private payrolls rose 130,000 in April after a 166,000 increase the prior month. The consensus forecast was for a 178,000 advance.
Goods-producing industry employment rose 14,000 after a 38,000 boost in March. For the latest month, manufacturing increased 16,000; construction dipped 2,000; and mining edged up 1,000.
Private service-providing industry employment rose 116,000, following a 128,000 gain in March. The notable positive was a 62,000 increase in professional & business services. Retail trade rose 29,000 while health care gained 19,000 and leisure & hospitality increased 12,000.
The public sector continued to downsize with a 15,000 drop in government employment, led by a 10,700 decline in local government education.
Average hourly earnings were flat, following a 0.2 percent gain in March. The average workweek for all workers in April was steady at 34.5 hours.
 From the household survey the dip in the unemployment rate to 8.1 percent reflected a 342,000 decline in the labor force. Household employment fell 169,000. The median market forecast for the unemployment rate was for 8.2 percent in April. The labor force participation rate—the share of the population that was working or looking for work—declined to 63.6 percent in April from 63.8 percent the prior month. This points to increased discouraged workers. But at least the median duration of unemployment has eased slightly—to 19.4 weeks in April from 19.9 weeks in March and a recent high of 25.0 weeks as of June 2010. From the household survey the dip in the unemployment rate to 8.1 percent reflected a 342,000 decline in the labor force. Household employment fell 169,000. The median market forecast for the unemployment rate was for 8.2 percent in April. The labor force participation rate—the share of the population that was working or looking for work—declined to 63.6 percent in April from 63.8 percent the prior month. This points to increased discouraged workers. But at least the median duration of unemployment has eased slightly—to 19.4 weeks in April from 19.9 weeks in March and a recent high of 25.0 weeks as of June 2010.
Looking forward, there are positives for the next industrial production and personal income reports. Production worker hours in manufacturing jumped 0.5 percent in April—a big plus and stands in sharp contrast to recently sluggish regional manufacturing surveys. Aggregate private earnings rose 0.2 percent, suggesting a modest rise in the private wages & salaries component of personal income for April.
 Personal income and spending beat expectations for March. However, the improved spending number was partly due to inflation. Still, the spending trend is good. Personal income in March improved 0.4 percent after a 0.3 percent rise the month before. The important wages & salaries component gained 0.3 percent after advancing 0.4 percent in February. Personal income and spending beat expectations for March. However, the improved spending number was partly due to inflation. Still, the spending trend is good. Personal income in March improved 0.4 percent after a 0.3 percent rise the month before. The important wages & salaries component gained 0.3 percent after advancing 0.4 percent in February.
Consumer spending in March increased 0.3 percent, compared to a 0.9 percent in surge in February. By components, durables dipped 0.3 percent in March (autos declined after a strong February); nondurables jumped 0.9 percent on higher gasoline prices; and services edged up 0.1 percent.
Chained-weighted spending was still positive, nudging up 0.1 percent and following a robust 0.5 percent jump in February. After a strong February, a modest gain in March should be expected.
 On the inflation front, the headline PCE price index rose 0.2 percent, compared to 0.3 percent in February. The core rate firmed to 0.2 percent in March from 0.1 percent the prior month. On the inflation front, the headline PCE price index rose 0.2 percent, compared to 0.3 percent in February. The core rate firmed to 0.2 percent in March from 0.1 percent the prior month.
Year-on-year, headline prices were up 2.1 percent, compared to 2.3 percent in February. The core was up 2.0 percent versus 1.9 percent the prior month.
Despite still high unemployment, the consumer sector is gaining modest momentum with aggregate income gains and an upward trend in real spending. With recent declines in gasoline prices (not yet showing up in official monthly data), more progress is likely on the consumer sector.
 Sales of cars and light trucks were steady in April compared to March. Sales came in at a 14.4 million annual rate, unchanged from the pace in March. But at more precise decision precision, April was 14.419 million units versus 14.369 million in March, resulting in a 0.3 percent gain. Well, it may make a difference in the April retail sales numbers. Sales of cars and light trucks were steady in April compared to March. Sales came in at a 14.4 million annual rate, unchanged from the pace in March. But at more precise decision precision, April was 14.419 million units versus 14.369 million in March, resulting in a 0.3 percent gain. Well, it may make a difference in the April retail sales numbers.
The breakdown shows slight strength on the truck side and slight slowing for cars.
However, unit sales and dollar sales in the retail sales report have not tracked well recently. This can be due to three factors: varying pricing control at dealerships, varying allocation of sales between the consumer and business sectors (PCEs versus equipment investment), and differences in the retail sales survey sample from actual dealerships.
 The ISM report for April bucked the trend, showing rising rates of growth versus a host of other indicators that point to slowing in the manufacturing sector. The composite gain of 1.4 points to 54.8 was better than expected with strength centered right where it should be. with the new orders index up to 58.2 from 54.5 in March, showing sizably greater monthly growth. Production was strong and, importantly, manufacturers in the sample are adding significantly to their payrolls. In a surprise, export orders, despite weakness in Europe and slowing in China, are very strong and accelerating. Other details show a slight destocking in inventories which is welcome and points to the need for future orders in order to replenish inventories. The ISM report for April bucked the trend, showing rising rates of growth versus a host of other indicators that point to slowing in the manufacturing sector. The composite gain of 1.4 points to 54.8 was better than expected with strength centered right where it should be. with the new orders index up to 58.2 from 54.5 in March, showing sizably greater monthly growth. Production was strong and, importantly, manufacturers in the sample are adding significantly to their payrolls. In a surprise, export orders, despite weakness in Europe and slowing in China, are very strong and accelerating. Other details show a slight destocking in inventories which is welcome and points to the need for future orders in order to replenish inventories.
 The bulk of the economy slowed sharply in April though the month's growth is still respectable. The ISM's non-manufacturing composite index slowed to 53.5 from a very strong 56.0 in March. New orders posted their lowest monthly growth in six months as did business activity which in this report refers to output. The ISM's sample added jobs in April but at the slowest pace of the year. The bulk of the economy slowed sharply in April though the month's growth is still respectable. The ISM's non-manufacturing composite index slowed to 53.5 from a very strong 56.0 in March. New orders posted their lowest monthly growth in six months as did business activity which in this report refers to output. The ISM's sample added jobs in April but at the slowest pace of the year.
Other readings were more positive including a solid monthly build in backlog orders, strength in export orders, and a steady rate of inventory accumulation.
 The Chicago PMI slowed to 56.2 in April from 62.2 the month before. While disappointing, the index remained well above 50 to indicate growth compared to March. While disappointing, the April index (being above the 50 level) still reflects a moderately positive growth rate. The Chicago PMI slowed to 56.2 in April from 62.2 the month before. While disappointing, the index remained well above 50 to indicate growth compared to March. While disappointing, the April index (being above the 50 level) still reflects a moderately positive growth rate.
Growth in new orders and growth in production both slowed but with readings in the 57 area both remain very strong. Especially strong in April are backlog orders which, nearly at 57, show the strongest monthly build so far this year. Employment is also strong, up nearly 1-1/2 points to nearly 59.
 The Dallas Fed manufacturing report was mixed for April but mostly turning less positive or mildly negative. Texas factory activity increased in April, according to the production index which slowed from 11.1 to 5.6, suggesting growth continued but at a slower pace than last month. The Dallas Fed manufacturing report was mixed for April but mostly turning less positive or mildly negative. Texas factory activity increased in April, according to the production index which slowed from 11.1 to 5.6, suggesting growth continued but at a slower pace than last month.
Other measures of current manufacturing conditions stagnated in April. The capacity utilization index came in at 1.4, down markedly from 12.3 in March, with one-quarter of respondents noting decreases. Shipment volumes were flat in April after increasing for the previous three months; the shipments index fell from 8.6 to minus 0.8. The new orders index posted a near-zero reading for the second consecutive month.
Perceptions of broader economic conditions worsened in April. The general business activity index turned negative after three months of positive readings, falling from 10.8 to minus 3.4.
 Construction outlays came in softer than expected as a drop in public outlays offset most of the gains in the private sector. Construction spending rebounded 0.1 percent in March after falling 1.4 percent the prior month. Construction outlays came in softer than expected as a drop in public outlays offset most of the gains in the private sector. Construction spending rebounded 0.1 percent in March after falling 1.4 percent the prior month.
The rise in March was led by both private residential and private nonresidential outlays. Private residential outlays gained 0.7 percent after dropping 2.2 percent in February. The latest number was led by the new one-family subcomponent. Private nonresidential outlays advanced 0.7 percent, following a 1.7 percent dip the month before. Public outlays fell 1.1 percent after a 0.3 percent decline in February.
On a year-ago basis, overall construction posted at up 6.0 percent in March, compared to 5.6 percent the month before.
Economic growth has slowed but it still is not clear how much is related to atypical winter warmness moving activity forward from early spring. At best, data are mixed and even at worst the data are mixed. Growth is still positive but soft. Momentum may be building but slowly.
The calendar is relatively light but still with key updates. Consumer credit posts Monday—updating consumer willingness to spend. Traders will be watching Thursday's international trade report to see if exports have been dented by a sluggish Europe. The week closes with PPI and consumer sentiment.
Consumer credit outstanding rose a respectable $8.7 billion in February following an outsized and upwardly revised rise of $18.6 billion in January. Consumer credit has been surging the last six months driven by nonrevolving credit, credit in large part that's used to fund vehicle purchases. Revolving credit, which also turned higher late last year, has however been lagging and contracted slightly for a second month in a row.
Consumer credit Consensus Forecast for March 12: +$9.8 billion
Range: +$5.0 billion to +$14.0 billion
The NFIB Small Business Optimism Index in March declined 1.8 points to 92.5. Declines sweep nine of the report's 10 index components including employment plans, sales expectations, and earnings trends. On the positive side, ongoing hiring was solid and access to credit was not a major concern.
NFIB Small Business Optimism Index Consensus Forecast for April 12: 93.0
Range: 91.5 to 94.8
Wholesale inventories gained 0.9 percent in February. This is high but the sales rate rose an even stronger 1.2 percent. The stock-to-sales ratio was unchanged for a third straight month at 1.17.
Wholesale inventories Consensus Forecast for March 12: +0.6 percent
Range: +0.4 to +0.9 percent
The U.S. international trade gap in February unexpectedly shrank to $46.0 billion from $52.5 billion in January. Exports nudged up 0.1 percent after gaining 1.5 percent in January. But imports dropped 2.7 percent in February, following a 2.1 percent boost the month before. The narrowing in the trade gap was led by the non-petroleum goods deficit which shrank to $32.9 billion from $36.8 billion in January. The petroleum goods gap also narrowed—to $27.8 billion from $29.6 billion. The services surplus expanded to $15.4 billion from $14.8 billion.
International trade balance Consensus Forecast for March 12: -$49.5 billion
Range: -$52.0 billion to -$45.0 billion
Initial jobless claims fell very convincingly in the April 28 week, down 27,000 to a much lower-than-expected level of 365,000. The Labor Department reported no distortions in the data. The big decline took claims back toward the 350,000 level that was being tested in March and February. But this was only one week of improvement which was reflected in the four-week average that, despite the big decline, rose slightly in the week to 383,500. This level is still tangibly higher than the 360,000 levels through March.
Jobless Claims Consensus Forecast for 5/5/12: 366,000
Range: 360,000 to 380,000
Import prices rose 1.3 percent in March with prices of imported petroleum products surging 4.3 percent. The rise in petroleum bled through to industrial supplies which jumped 3.0 percent in the month, a rise that no doubt made for headaches among manufacturers. But many of the year-on-year rates are moderating with the headline rate at plus 3.4 percent -- down from double digits as recently as November and the lowest rate of the recovery. Year-on-year rates remain subdued for finished goods, at plus 1.1 percent for capital goods and at plus 2.7 percent for consumer goods.
Import prices Consensus Forecast for April 12: -0.2 percent
Range: -1.1 to +0.7 percent
Export prices Consensus Forecast for April 12: +0.2 percent
Range: +0.1 to +0.4 percent
The U.S. Treasury monthly budget report showed that the nation's budget gap came in about as expected in March, at $198.2 billion. Halfway through the government's fiscal year, the budget gap continued to show improvement, at a fiscal year-to-date $779.0 billion versus a gap of $829.4 billion at this time last year. Looking ahead, the month of April typically shows a surplus for the month. Over the past 10 years, the average surplus for the month of April has been $73.6 billion and $70.4 billion over the past 5 years. The April 2011 deficit came in at $40.4 billion.
Treasury Statement Consensus Forecast for April 12: -$30.0 billion
Range: -$39.0 billion to $0.0 billion.
The producer price index was unchanged in March after surging 0.4 percent in February. The core PPI, however, posted a 0.3 percent rise, following a gain of 0.2 percent in February. A big part of the core increase came from a 0.8 percent jump in prices for passenger cars and a 0.7 percent jump for light trucks.
By major components, energy decreased 1.0 percent, following a 1.3 percent spike in February. Gasoline dipped 2.0 percent after a 4.3 percent boost the prior month. Food increased 0.2 percent after dipping 0.1 percent in February.
PPI Consensus Forecast for April 12: 0.0 percent
Range: -0.2 to +0.4 percent
PPI ex food & energy Consensus Forecast for April 12: +0.2 percent
Range: 0.0 to +0.3 percent
The Reuters/University of Michigan's consumer sentiment index rose slightly to 76.4 in April. The recovery peak for this index, hit early last year, is just a little higher than the current level. The index also hit a similar peak in early 2010.
Consumer sentiment index Consensus Forecast for preliminary May 12: 76.2
Range: 74.0 to 78.5
R. Mark Rogers is the author of The Complete Idiot’s Guide to Economic Indicators, Penguin Books, 2009.
Econoday Senior Writer Mark Pender contributed to this article.
|
