|
Economic indicators were mixed with the unexpected strength in the retail sector. Manufacturing and housing news disappointed. But corporate earnings reports largely beat expectations and more than offset sluggish economic news.
 The week got off to a mixed start. There were plenty of cross currents. Investors worried about Europe as yields on Spanish bonds topped 6 percent. Retail sales were strong but Empire State disappointed. The Dow was up notably with corporate help coming from Citigroup posting a smaller decline in earnings than expected and with Proctor & Gamble (the number one consumer products company in the world) boosting its quarterly dividend. But Apple pulled down techs on profit taking. The week got off to a mixed start. There were plenty of cross currents. Investors worried about Europe as yields on Spanish bonds topped 6 percent. Retail sales were strong but Empire State disappointed. The Dow was up notably with corporate help coming from Citigroup posting a smaller decline in earnings than expected and with Proctor & Gamble (the number one consumer products company in the world) boosting its quarterly dividend. But Apple pulled down techs on profit taking.
On Tuesday, stocks rallied in part due to news of a successful Spanish debt auction. Spain sold €3.2 billion of 12 and 18 month bills, above the target of €3 billion. A better than expected reading on German investor sentiment also helped lift stocks. In U.S. economic news, housing starts disappointed but housing permits were stronger than expected and were the focus of traders in that report. Favorable standouts from corporate news were Coca-Cola, Goldman Sachs, and Johnson & Johnson.
At mid-week, with no notable economic indicator news in the U.S., the focus was on earnings and Europe. Bellwether IBM and Intel declined despite winning on some earnings metrics. IBM missed on sales and traders are concerned about Intel’s long-term ability to break into mobile and tablet markets. Also weighing on stocks was a report from Spain that Spanish banks are holding more problem loans than earlier believed.
Stocks dropped notably Thursday with a sharp upward revision to prior week initial jobless claims starting the downdraft. A drop in existing home sales and a soft Philly Fed added to disappointment. However, better-than-expected earnings from Bank of America, Morgan Stanley, Travelers, eBay and others helped put a floor under the market. But techs were hardest hit as Qualcomm projected third quarter sales and profit that fell short of analysts’ projections.
Lift for Friday started after close Thursday with Microsoft beating estimates. The positive corporate news continued Friday morning with General Electric reporting quarterly earnings and revenues that topped analysts’ forecasts. McDonald’s added to upward momentum on a strong first quarter. Also boosting stocks was a better-than-expected reading on German business confidence. However, Apple and SanDisk led techs down for the day.
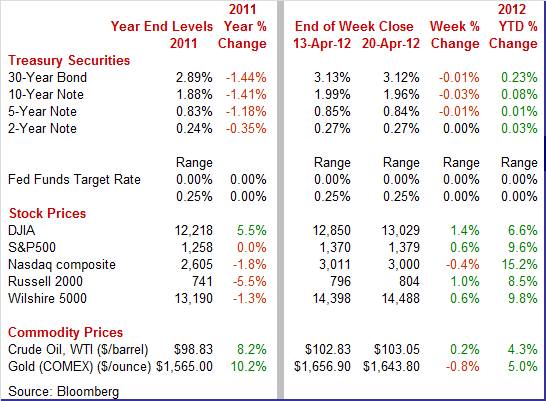
Equities were mostly up this past week. The Dow was up 1.4 percent; the S&P 500, up 0.6 percent; the Russell 2000, up 1.0 percent; and the Wilshire 5000, up 0.6 percent. However, the Nasdaq dipped 0.4 percent.
For the year-to-date, major indexes are up as follows: the Dow, up 6.6 percent; the S&P 500, up 9.6 percent; the Nasdaq, up 15.2 percent; the Russell 2000, up 8.5 percent; and the Wilshire 5000, up 9.8.
Weekly percent change column reflects percent changes for all components except interest rates. Interest rate changes are reflected in simple differences.
 This past week, the daily swings were about as tight as you can get—leaving rates down only slightly for the week. Early in the week, Treasury yields were little changed. On Monday, rates were essentially flat as strong retail sales mostly offset a soft Empire State report and modest flight to safety on worries over Spanish bond yields. Rates firmed a bit Tuesday on healthy housing permits, reversal of concern over Spain, and as money moved into equities. This past week, the daily swings were about as tight as you can get—leaving rates down only slightly for the week. Early in the week, Treasury yields were little changed. On Monday, rates were essentially flat as strong retail sales mostly offset a soft Empire State report and modest flight to safety on worries over Spanish bond yields. Rates firmed a bit Tuesday on healthy housing permits, reversal of concern over Spain, and as money moved into equities.
 At mid-week with little economic news, yields were unchanged to down incrementally as traders awaited the results of Spain’s debt auction Thursday. The 10-year Treasury yield again slipped below 2 percent. Treasury rates on Thursday were flat to only down one or two basis points despite disappointing economic news and a rise in Spanish and French yields. Treasury yields may have gotten so low that they are at or close to a floor unless European risk worsens notably. At mid-week with little economic news, yields were unchanged to down incrementally as traders awaited the results of Spain’s debt auction Thursday. The 10-year Treasury yield again slipped below 2 percent. Treasury rates on Thursday were flat to only down one or two basis points despite disappointing economic news and a rise in Spanish and French yields. Treasury yields may have gotten so low that they are at or close to a floor unless European risk worsens notably.
Rates were flat at week’s close. Net for the week, outflow pressure from generally favorable news for equities was marginally more offset from soft economic data and continued worries about Europe.
For this past week Treasury rates were mostly down but only barely as follows: 3-month T-bill, down 1 basis point; the 5-year note, down 1 basis point; the 7-year note, down 3 basis points; the 10-year note, down 3 basis points; and the 30-year bond, down 1 basis point. The 2-year note was unchanged.
 The spot price of crude ended the week essentially where it started. The spot price of crude ended the week essentially where it started.
After mixed economic news left the spot price of crude unchanged at the start of the week, the second day of trading saw crude advance a little over a buck a barrel. Lift came from a favorable Spanish bond auction and net positive economic news in the U.S. and improved German investor sentiment.
 Wednesday saw the largest swing of the week as spot WTI fell about $1.50 per barrel on news of a larger-than-expected boost in crude inventories. The spot price of crude nudged down by about half a dollar on Thursday, led down by weakness in U.S. economic news. Wednesday saw the largest swing of the week as spot WTI fell about $1.50 per barrel on news of a larger-than-expected boost in crude inventories. The spot price of crude nudged down by about half a dollar on Thursday, led down by weakness in U.S. economic news.
At week’s close, crude was bumped up about three-quarters of a dollar per barrel on positive corporate earnings and a favorable reading on German business confidence. Net for the week, the spot price for West Texas Intermediate nudged up 22 cents per barrel to settle at $103.05.
For economic news, relative strengths and weaknesses were not always where expected. The unexpected standout positive news was in the consumer sector—retail sales.
 The consumer is confounding surveys on the consumer mood. Retail sales were much stronger than expected in March with a gain in autos being quite unexpected. The narrow core measure showed broad based increases. Retail sales in March advanced 0.8 percent after increasing 1.0 percent the prior month. The consumer is confounding surveys on the consumer mood. Retail sales were much stronger than expected in March with a gain in autos being quite unexpected. The narrow core measure showed broad based increases. Retail sales in March advanced 0.8 percent after increasing 1.0 percent the prior month.
Motor vehicle sales gained 0.9 percent, following a 1.3 percent increase in February. This is in contrast to a sizeable dip in unit new auto sales as reported by manufacturers.

Excluding motor vehicles, retail sales gained 0.8 percent after increasing 0.9 percent in February With prices still rising in March on average, gasoline sales increased 1.1 percent after a 3.6 percent surge the month before.
Sales excluding autos and gasoline in March rose a healthy 0.7 percent, following a 0.5 percent jump the prior month. Core components showed widespread strength. Standouts included building materials & garden equipment, furniture & home furnishings, electronics & appliances, and clothing. Declines were seen in miscellaneous store retailers and in health & personal care.
The March retail sales number will have many economists nudging up their estimate for first quarter GDP growth. However, the impact on PCEs will be modest as the Commerce Department will be substituting the more reliable unit new motor vehicle sales (which declined) for the motor vehicles component in retail sales. Also, the gasoline sales will be deflated. A notable positive impact, however, will likely be in the residential investment component of GDP. The Commerce Department puts building materials sales in that category of GDP.
Clearly there are some special factors behind the overall strong sales number—higher gasoline prices and perhaps higher prices for motor vehicles. The core is quite encouraging. Atypically warm weather likely helped building materials, but the broad strength stands out. The consumer appears to be willing to spend despite glum measures of consumer confidence.
 Manufacturing paused in March but following several strong months. Overall industrial production was unchanged in March after a flat reading the month before. Manufacturing paused in March but following several strong months. Overall industrial production was unchanged in March after a flat reading the month before.
By major components, manufacturing slipped 0.2 percent, following a 0.8 percent increase in February. For the latest month, utilities output rose 1.5 percent. Mining output firmed 0.2 percent.
The bright spot in the report was for motor vehicles and parts which advanced 0.6 percent, following a 0.8 percent boost in February. Manufacturing excluding motor vehicles dipped 0.3 percent, following a 0.8 percent surge in February.
 Overall capacity utilization edged down to 78.6 percent from 78.7 percent in February. Overall capacity utilization edged down to 78.6 percent from 78.7 percent in February.
Manufacturing was in a soft spot in March but this is not so disconcerting given how strong recent gains have been. The first quarter as a whole was quite strong with manufacturing up an annualized 10.4 percent, the largest gain since the second quarter of 2010.
Recent regional manufacturing surveys have been mixed in terms of forward momentum although soft at the headline numbers.
 The April Empire State report showed some slowing but there still are some signs of continued or improving momentum. The headline general business conditions index softened notably to 6.56, down from readings of around the 20 level in the prior two months. April is still in positive territory. But the new orders index was essentially steady at 6.48 versus 6.84 in March, indicating continued moderate growth. These rates of incoming order growth aren't gangbusters but they are sustainable which hints at long-term health for the region's manufacturing economy. The April Empire State report showed some slowing but there still are some signs of continued or improving momentum. The headline general business conditions index softened notably to 6.56, down from readings of around the 20 level in the prior two months. April is still in positive territory. But the new orders index was essentially steady at 6.48 versus 6.84 in March, indicating continued moderate growth. These rates of incoming order growth aren't gangbusters but they are sustainable which hints at long-term health for the region's manufacturing economy.
 Other readings are mixed including slowing growth for shipments, a contraction in unfilled orders, and a small build for inventories. A big positive is a third straight gain for employment which, at an index of 19.28, indicates that manufacturers in the region may be scrambling for help, gearing up for stronger production in coming months.
Manufacturing growth continues at a steady, incremental rate in the Philly Fed's region with the index coming in at 8.5 in April, over zero to indicate monthly growth but a bit under March's 12.5 level to indicate a slowing rate of growth. Growth is quite slow for new orders as the index came in at 2.7 versus 3.3 in March. Unfilled orders show a small advance while inventories show a sizable monthly build. Shipments remained in the low single digits.
A big positive in the report, as it was in Monday's report from the New York Fed, is an increasingly large gain in employment that highlights the sample's underlying confidence. The employment index jumped to 17.9 in April from 6.8 the prior month.
Six-month outlook readings are steady and strong and are led by increasing expectations for future employment gains. The six-month outlook index for general business activity rose to 33.8 from 32.9.
 Business inventory data lag most other indicators in terms of timeliness. Just released business inventories for February, however, show inventory investment to be healthy and mostly in the right places. Business inventory data lag most other indicators in terms of timeliness. Just released business inventories for February, however, show inventory investment to be healthy and mostly in the right places.
Business inventories rose 0.7 percent in January, right in line with sales to keep the stock-to-sales ratio unchanged at 1.27.
For the latest month, manufacturers’ inventories rose a moderate 0.4 percent. Retail inventories advanced 0.6 percent but there were big differences in the key components. Auto dealer inventories jumped 1.8 percent while non-auto retail rose only 0.2 percent. Wholesalers’ inventories increased 0.9 percent. A large percentage of wholesale inventories is from imports—notably autos. So, relative growth by components appears to be about right in accordance to where demand is. Importantly, there do not appear to be any notable overstock as suggested by the low inventory-to-sales ratio and by component strength.
 The starts report is mixed with starts down somewhat and permits up notably—adding to the argument that atypically warm weather played a role in earlier strength in starts. Housing starts dipped 5.8 percent in March after decreasing 2.8 percent in February. The March pace of 0.654 million units was up 10.3 percent on a year-ago basis. In March, weakness was led by the multifamily component although single-family edged down. The starts report is mixed with starts down somewhat and permits up notably—adding to the argument that atypically warm weather played a role in earlier strength in starts. Housing starts dipped 5.8 percent in March after decreasing 2.8 percent in February. The March pace of 0.654 million units was up 10.3 percent on a year-ago basis. In March, weakness was led by the multifamily component although single-family edged down.
By region, the dip in starts reflected a 15.9 percent drop in the South. The Northeast jumped 32.8 percent and the Midwest nudged up 1.0 percent. The West was flat.
Housing permits are far less susceptible to atypical weather (indoor activity to buy permits) and are pointing to moderate strength. Permits gained 4.5 percent, following a 4.8 percent increase in February. The latest figure of 0.747 million units was up 30.1 percent on a year-ago basis. Strength was in the multifamily component, which jumped 20.8 percent, while the single-family component declined 3.5 percent for the month.
 It is taking time to sort out the weather effects in recent months, but the permits numbers are suggesting slight momentum building for housing, although it appears to mainly be in the multifamily component.
 Another data point is suggesting that atypically warm weather pulled forward housing activity. Existing home sales March came in softer than expected, posting at a 4.48 million unit pace, compared to a marginally revised 4.60 million units the prior month. Sales dipped 2.6 percent, following a 0.6 percent slip in February and 5.7 percent surge in January. On a year-ago basis, existing sales are up 5.2 percent. Another data point is suggesting that atypically warm weather pulled forward housing activity. Existing home sales March came in softer than expected, posting at a 4.48 million unit pace, compared to a marginally revised 4.60 million units the prior month. Sales dipped 2.6 percent, following a 0.6 percent slip in February and 5.7 percent surge in January. On a year-ago basis, existing sales are up 5.2 percent.
Despite the dip in sales, a 2.5 percent decrease in supply on the market kept the months’ supply steady at 6.3.
Distressed home sales—foreclosures and short sales sold at deep discounts—accounted for 29 percent of March sales (18 percent were foreclosures and 11 percent were short sales), compared with 34 percent in February and 40 percent in March 2011.
The change in the mix of sales bumped up the median sales price to $163,800, up 4.6 percent and after a 1.3 percent rise in February. The average price rose a monthly 4.9 percent to $211,400.
Distressed homes sales are helping to support sales but are weighing on prices. Foreclosures typically sold for an average 19 percent below market price in March, while short sales were discounted 16 percent.
The bottom line is that tight credit and a still sluggish labor market are keeping the trajectory of home sales low.
 The bears had to have been disappointed with the latest leading indicators report—still no sign of pending collapse in the recovery. The index of leading economic indicators continues to signal healthy growth ahead. The bears had to have been disappointed with the latest leading indicators report—still no sign of pending collapse in the recovery. The index of leading economic indicators continues to signal healthy growth ahead.
The index gained 0.3 percent in March, following a 0.7 percent boost the prior month. The March index was led, as it often has during the Fed's zero-rate policy, by the spread between short and long rates. But signals outside this factor are also positive especially growth underway in building permits -- which is an important and hopeful signal of badly needed recovery for the housing sector. The stock market is also a positive as is the report's reading on lending conditions. Jobless claims are a positive for March but, given the recent trend, look to be a likely negative for the April report.
Though the 0.3 percent headline may not be a robust rate of growth, it is importantly a sustainable rate of growth. In fact, the leading index has risen six months in a row. Notably, the strengths among the leading indicators have been widespread in recent months.
Current economic growth has been steady, according to the coincident index with gains of 0.2 percent in each of the two latest months.
The consumer sector is surprisingly strong, given still gloomy confidence numbers and stalling initial jobless claims. Apparently, those with jobs are more willing to spend. But other sectors—manufacturing and housing—are in another soft patch. Manufacturing is likely to regain momentum in coming months while, outside of the multifamily component, housing is likely to creep forward at best. The recovery is uneven, but it is still a recovery.
Within a deluge of indicators, the highlight is the Fed’s FOMC pronouncements on Wednesday, including the meeting statement, forecast tables, and chairman press conference. Next on the marquee is the advance estimate for first quarter GDP on Friday. Housing notables include Case-Shiller (Tuesday), new home sales (Wednesday), FHFA HPI (Wednesday), and pending home sales (Thursday). Manufacturing is updated with durables orders (Thursday) while consumer updates post with consumer confidence (Tuesday) and sentiment (Friday).
The S&P/Case-Shiller 20-city home price index (SA) posted at unchanged in January, following a 0.5 percent drop in December. This index had declined five months in a row. Since the start of the recent downturn in June 2010, this index has fallen in 17 of the last 20 months. Improvement was seen in the year-on-year rate which at minus 3.8 percent was two tenths better than December and one tenth better than November.
The S&P/Case-Shiller 20-city HPI (SA, m/m) Consensus Forecast for February 12: +0.1 percent
Range: -0.3 to +0.2 percent
The S&P/Case-Shiller 20-city HPI (NSA, y/y) Consensus Forecast for February 12: -3.3 percent
Range: -3.7 to -3.1 percent
New home sales fell 1.6 percent in February to a 313,000 annual rate, following a 5.4 percent drop in January and a 4.3 percent boost in December. The biggest strength in the February report was in prices which surged 8.3 percent for the median to $233,700 for the highest since June with the year-on-year rate, at plus 6.2 percent, showing its first positive reading since October. But, as with the existing home sales measure, prices are affected by relative strength in the high end versus the low end.
New home sales Consensus Forecast for March 12: 318 thousand-unit annual rate
Range: 305 thousand to 335 thousand-unit annual rate
The Conference Board's consumer confidence index in March dipped to 70.2 from February's 71.6. Weakness was in the expectations component, which is more heavily weighted than the present situation component. Expectations fell back 5.4 points to 83.0. Here details show less optimism for the employment outlook and a little less optimism on income prospects where however optimists, at 15.8 percent, still outnumber pessimists at 14.6 percent. The present situation component rose 4.6 points to 51.0 which is the highlight of the March report.
Consumer confidence Consensus Forecast for April 12: 69.7
Range: 66.9 to 72.5
The FHFA purchase only house price index in January was unchanged, following a 0.1 percent rise in December. This house price measure is a repeat transaction measure which compares changes in the price of the same house in a bundle of houses. On a year-on-year basis, the FHFA HPI was down 0.7 percent versus down 1.6 percent in December.
FHFA purchase only house price index Consensus Forecast for February 12: +0.1 percent
Range: -0.1 to +0.3 percent
The Richmond Fed manufacturing index declined to 7 in March from 20 the prior month. Other indicators showed much of the same pattern as new orders index slowed by 10 points to 11, still over zero to indicate a monthly increase but significantly less of an increase than February. Also, the shipments index dropped to 2 from 25 in February.
Richmond Fed manufacturing index Consensus Forecast for April 12: 8
Range: 4 to 10
Durable goods orders in February rebounded a revised 2.4 percent (originally 2.2 percent), following a revised 3.5 percent drop in January and 3.3 percent jump in December. Excluding transportation, durables made a 1.8 percent comeback (originally 1.6 percent) after a revised 2.8 percent decline in January, and a 2.3 percent advance in December. The very volatile transportation component rebounded 3.9 percent in February after dropping 5.2 percent the month before. Subcomponent strength was led by defense aircraft with increases also seen in nondefense aircraft and motor vehicles. Outside of transportation, gains were widespread.
New orders for durable goods Consensus Forecast for March 12: -1.5 percent
Range: -3.5 percent to +0.6 percent
New orders for durable goods, ex-trans., Consensus Forecast for March 12: +0.4 percent
Range: 0.0 percent to +2.4 percent
The FOMC announcement at 12:30 p.m. ET for the April 24-25 FOMC policy meeting is expected to leave policy rates unchanged. Traders will be focusing on any changes in the evaluation of the economy in the meeting announcement and on changes in guidance. Also, the Fed will release its quarterly forecast between the announcement and the chairman’s press conference. And the forecasts get more attention now that fed funds rate forecasts are included.
FOMC Consensus Forecast for 4/25/12 policy vote on fed funds target range: unchanged at a range of zero to 0.25 percent
Chairman press conference after the FOMC meeting statement is scheduled for 2:15 p.m. ET. Fed Chairman Ben Bernanke conducts a press conference after FOMC meetings in which participants present their quarterly economic forecasts. Bernanke is expected to comment on the forecast and take Q&A.
Initial jobless claims edged down 2,000 to 386,000 in the April 14 week. But this included a severe 26,000 jump in the prior week which was upwardly revised by 8,000 to 388,000. The latest level and the prior level are the highest so far this year. The four-week average of 374,750 is the highest since January and is up more than 5,000 versus levels in March.
Jobless Claims Consensus Forecast for 4/21/12: 375,000
Range: 361,000 to 380,000
The pending home sales index fell 0.5 percent in February, following a 2.0 percent gain the month before. Three of four regions showed monthly declines including the South which is by far the largest housing region. An important fact about pending home sales is that contracts do not always make it to closing due to credit and appraisal snags. These problems are bigger than in the past, adding further negative implications to the February dip in pending sales. Mild winter weather was supposed to have helped support sales traffic and actual purchases, but that does not appear to have happened.
Pending home sales Consensus Forecast for March 11: +1.0 percent
Range: -1.5 to +2.0 percent
The Kansas City Fed manufacturing index eased to 9 in March, down from 13 in February but up from 7 in January. Other current indexes were mixed in March but remained mostly solid. The production index dropped from 20 to 13, and the order backlog index also fell after rising last month. In contrast, the shipments and new order indexes both increased from 8 to 17, and employment index also edged higher.
No consensus is available.
GDP in the fourth quarter based on Commerce’s second revision was essentially as earlier believed except that domestic demand was modestly stronger. For its final estimate, the Commerce Department kept fourth quarter GDP growth at 3.0 percent, matching the second estimate for the overall number. The latest quarter was stronger than the 1.8 percent rise in the third quarter. Demand numbers were essentially unchanged but incrementally better on the domestic side of purchases. Final sales of domestic product increased an annualized 1.1 percent, matching the prior estimate of 1.1 percent for the fourth quarter. Final sales to domestic purchasers (excludes net exports) rose a revised 1.3 percent, compared to the second estimate of 1.1 percent. Economy-wide inflation according to the GDP price index was unrevised at a 0.9 percent annualized rate.
Real GDP Consensus Forecast for advance estimate Q1 11: +2.5 percent annual rate
Range: +1.8 to +3.6 percent annual rate
GDP price index Consensus Forecast for advance estimate Q1 11: +2.1 percent annual rate
Range: +1.7 to +2.8 percent annual rate
The employment cost index rose 0.4 percent in the fourth quarter, up from the third quarter's 0.3 percent rise. The index's wages & salaries component also firmed and by the same numbers as the overall index. For overall compensation, the year-on-year rate of plus 2.0 percent is unchanged from the prior quarter.
Employment cost index Consensus Forecast for Q1 12: +0.5 percent
Range: +0.4 to +0.6 percent
The Reuter's/University of Michigan's consumer sentiment index at mid-April slipped to 75.7 from final March at 76.2. The notable weakness was in the consumer's assessment of current conditions which, at 80.6, fell 5.4 points in an unusually steep decline. The report's expectations component was a positive, up 2.7 points to 72.5 for its best reading of the recovery. This suggests that consumers believe the current disappointment will be short lived.
Consumer sentiment Consensus Forecast for final April 12: 75.8
Range: 74.0 to 78.0
R. Mark Rogers is the author of The Complete Idiot’s Guide to Economic Indicators, Penguin Books, 2009.
Econoday Senior Writer Mark Pender contributed to this article.
|
