|
The big events this past week were the March employment report on Friday and the Fed’s release of the latest FOMC minutes on Tuesday. Despite a recent run of clear FedSpeak that additional monetary ease is unlikely, traders were still expecting hints of QE3 and were disappointed. The March employment report, however, was clearly softer than expected.
 Most stocks ended the week down on Fed disappointment and some re-emergence of worries about European sovereign debt—this time Spain. Most stocks ended the week down on Fed disappointment and some re-emergence of worries about European sovereign debt—this time Spain.
However, stocks started on a short-lived positive note Monday as ISM manufacturing posted positive and higher than expected.
Many traders expected Fed officials to hint at further easing and were disappointed Tuesday when the release of FOMC minutes gave no such indication. Despite recent FedSpeak suggesting no additional ease is coming, a major investment firm had told clients to expect some type of additional easing being mentioned in the minutes. For a week of thin trading in a holiday shortened week, the lack of further easing set the mood for the rest of the week.
On Wednesday, a poorly traded Spanish bond auction (less sold than targeted and at a high rate and at a low bid-to-cover ratio) weighed on stocks as the auction reminded markets that European sovereign debt is still a problem hanging over markets. Equities were mixed Thursday as initial jobless claims came in lower than expected but traders were largely on the sidelines ahead of Friday’s jobs report and the holiday weekend.
Equity markets were closed in the U.S. for Good Friday observance but futures were down notably Friday on the sluggish employment report with payroll gains about half of expectations.
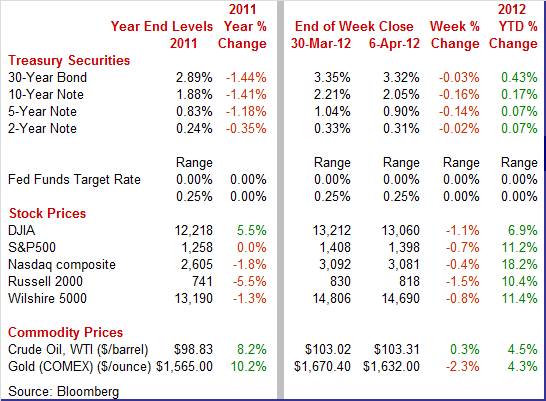
Equities were down this past week. The Dow was down 1.1 percent; the S&P 500, down 0.7 percent; the Nasdaq, down 0.4 percent; the Russell 2000, down 1.5 percent; and the Wilshire 5000, down 0.8.
For the year-to-date, major indexes are up as follows: the Dow, up 6.9 percent; the S&P 500, up 11.2 percent; the Nasdaq, up 18.2 percent; the Russell 2000, up 10.4 percent; and the Wilshire 5000, up 11.4.
Weekly percent change column reflects percent changes for all components except interest rates. Interest rate changes are reflected in simple differences.
 Treasury yields eased this past week on soft economic news on average and somewhat on flight to safety. Treasury yields eased this past week on soft economic news on average and somewhat on flight to safety.
Despite a healthy ISM manufacturing number, rates nudged down Monday as the Fed continued Operation Twist, buying longer-term Treasuries to extend the average maturity of its holdings.
But the Fed came into play in the other direction on Tuesday as the latest FOMC minutes gave next to no indication of further quantitative easing.
But rates slipped the rest of the week, starting with a poor auction for Spanish bonds on Wednesday creating moderate flight to safety to Treasuries. Rates continued to ease Thursday despite a lower than expected number of initial jobless claims as European worries remained at the fore. Friday’s anemic payroll jobs gain was about half of expectations and tugged rates down at week’s close.
For this past week Treasury rates were down as follows: the 2-year note, down 2 basis points; the 5-year note, down 14 basis points; the 7-year note, down 18 basis points; the 10-year note, down 16 basis points; and the 30-year bond, down 13 basis points. The 3-month T-bill was unchanged.
 Oil prices were essentially unchanged for the week despite some notable daily swings in prices. Oil prices were essentially unchanged for the week despite some notable daily swings in prices.
The spot price of West Texas Intermediate jumped over $2 per barrel at the start of the week on a healthy ISM manufacturing report. But crude dipped a buck a barrel Tuesday on news that the Fed was not poised to implement further easing and on below expectations factory orders.
The biggest move was Wednesday as a government report indicated a surge in oil stockpiles. WTI fell two and a half bucks. But on Thursday, WTI rebounded almost $2 a barrel on better than expected initial jobless claims.
Net for the week, the spot price for West Texas Intermediate nudged up 29 cent per barrel to settle at $103.31.
Economic news in the past week was positive but softer than expected for the most part. The latest jobs report was particularly disappointing.
 The March jobs report was clearly disappointing though the unemployment rate dipped to 8.2 percent. Payroll jobs in March advanced a modest 120,000, following increases of 240,000 in February and 275,000 in January. The net revisions for January and February were up 4,000. Analysts expected a 201,000 increase for March. The March jobs report was clearly disappointing though the unemployment rate dipped to 8.2 percent. Payroll jobs in March advanced a modest 120,000, following increases of 240,000 in February and 275,000 in January. The net revisions for January and February were up 4,000. Analysts expected a 201,000 increase for March.
 Private payrolls were barely stronger than overall, rising 121,000 in March after a 233,000 increase the prior month. The median market forecast was for a 224,000 advance. Goods-producing was moderately strong while service-providing was very sluggish. Retail trade employment actually declined. Private payrolls were barely stronger than overall, rising 121,000 in March after a 233,000 increase the prior month. The median market forecast was for a 224,000 advance. Goods-producing was moderately strong while service-providing was very sluggish. Retail trade employment actually declined.
Goods-producing industry employment rose 31,000 after a 29,000 gain in February. For the latest month, manufacturing increased 37,000; construction dipped 7,000; and mining nudged up 1,000.
Private service-providing industry employment rose only 90,000, following a 204,000 boost in February. The big negative was a 34,000 decline in retail trade, somewhat conflicting with recently moderately favorable data on retail sales.
The public sector continued to shrink but just barely, slipping 1,000 in March after a 7,000 increase in February.
Average hourly earnings rose 0.2 percent, following a 0.3 percent gain in February. Expectations were for a 0.2 percent gain. The average workweek for all workers in March slipped to 34.5 hours from 34.6 in February. Analysts projected 34.5 hours for March.
From the household survey the dip in the unemployment rate to 8.2 percent from 8.3 percent reflected a 164,000 decline in the labor force. Household employment slipped 31,000. The median market forecast for the unemployment rate was for 8.3 percent in March.
Looking ahead, the data are not good for manufacturing or personal income. Aggregate earnings for private payrolls rose only 0.1 percent in March, suggesting that the private wages & salaries component of personal income will be soft. Production worker hours in manufacturing dipped 0.1 percent, indicating a slip in the manufacturing component of industrial production.
The March employment report is disappointing. However, there are still plenty of questions. How did warm weather affect the data' Did earlier months in the year take away from spring' Monthly surveys are showing stronger numbers, showing increased hiring. Which should be believed' The logical conclusion is that more data are needed though the weight of the evidence currently is not good.
 It is all relative. New indicator news impacts both upcoming related indicators and the medium-term trend. The latest motor vehicles sales numbers are not good for upcoming monthly data for retail sales and personal consumption expenditures as the monthly percentage change is notably negative. However, the level of sales is still relatively strong and suggests healthy demand for autos. It is all relative. New indicator news impacts both upcoming related indicators and the medium-term trend. The latest motor vehicles sales numbers are not good for upcoming monthly data for retail sales and personal consumption expenditures as the monthly percentage change is notably negative. However, the level of sales is still relatively strong and suggests healthy demand for autos.
March sales of motor vehicles dropped a sharp 4.8 percent, but followed a surge of 6.5 percent in February. Despite the very negative monthly change, the March level of 14.5 million units annualized is still quite healthy. Nonetheless, look for very negative impact on monthly retail sales and personal consumption expenditures. Still, the trend in sales is upward and favorable to medium-term economic growth. With the Fed keeping short-term rates exceptionally low until possibly through 2014, this is very favorable toward motor vehicle sales as the auto fleet aged notably during the past recession, boosting pent up demand.
 For no apparent reason, traders in the equities markets held onto hopes that the Fed was seriously thinking about another round of quantitative easing at the latest FOMC meeting. However, there has been next to nothing in recent FedSpeak suggesting the notable likelihood of further quantitative easing unless the recovery collapses—and there are no signs of that. So, the latest FOMC minutes disappointed those believing the Fed would be engaging in QE3. For no apparent reason, traders in the equities markets held onto hopes that the Fed was seriously thinking about another round of quantitative easing at the latest FOMC meeting. However, there has been next to nothing in recent FedSpeak suggesting the notable likelihood of further quantitative easing unless the recovery collapses—and there are no signs of that. So, the latest FOMC minutes disappointed those believing the Fed would be engaging in QE3.
But a major investment firm had told clients to expect hints of QE3 or some other form of additional easing. What that advice was based upon is hard to find, based on FedSpeak generally arguing for no change or shortening the guidance period.
Essentially, the latest FOMC minutes indicate no further inclination to implement QE3. Basically, the Fed is holding steady on current easy policy and FOMC participants expect gradual improvement in the economy although unemployment is projected to remain elevated for some time. Near-term inflation is seen as bumped up by energy costs but the run-up is expected to be temporary with long-run inflation to come in at 2 percent. Markets, however, expected additional hints at QE3 being implemented and equities declined on release of the minutes. Essentially, the Fed has concluded that the economy is muddling upward, not as much as preferred, but enough that further policy action is not needed currently.
The Fed increasingly appears to be on hold for monetary policy as the economy is improving, although gradually. The Fed’s staff economists raised their GDP forecast. The staff economists also nudged up the near-term inflation forecast due to higher oil prices, though maintained the view that medium-term inflation will return to 2 percent or lower.
And the FOMC participants generally agreed with the Board staff economists on recent economic improvement. However, some indicated that technical factors—atypically warm weather during winter—might be skewing the numbers upward.
Adding to the view that the Fed will sit tight for now was the conclusion that European sovereign debt was less of an issue in financial markets than earlier in the year.
The FOMC had a generally balanced view of risks to growth and inflation—another indication of policy remaining steady.
“With the economy facing continuing headwinds, members generally expected a moderate pace of economic growth over coming quarters, with gradual further declines in the unemployment rate. Strains in global financial markets, while having eased since January, continued to pose significant downside risks to economic activity. Recent monthly readings on inflation had been subdued, and longer-term inflation expectations remained stable. Against that backdrop, members generally anticipated that the recent increase in oil and gasoline prices would push up inflation temporarily, but that subsequently inflation would run at or below the rate that the Committee judges most consistent with its mandate.”
While the FOMC has engaged in more forward guidance than in the past with its statement of policy rates remaining exceptionally low until likely late 2014, the Fed reminded markets that policy is still contingent upon ongoing economic conditions. Of course, Richmond Fed President Jeffrey M. Lacker dissented on the issue of forward guidance being so explicit and far out, anticipating that rates likely will need to be raised earlier than late 2014.
There was not much argument for additional quantitative easing. Only two FOMC members even suggested that additional monetary easing would be appropriate if the economy lost momentum or if inflation were too low.
“The Committee also stated that it is prepared to adjust the size and composition of its securities holdings as appropriate to promote a stronger economic recovery in a context of price stability. A couple of members indicated that the initiation of additional stimulus could become necessary if the economy lost momentum or if inflation seemed likely to remain below its mandate-consistent rate of 2 percent over the medium run.”
The bottom line is that the Fed appears to be on hold but with still extremely loose monetary policy into 2014. There is no shortage of liquidity in financial markets, based on the tripling of Fed assets since late 2008. The real issue is lack of robust expansion in the money supply, reflecting lending.
 Overall, manufacturing is continuing to growth, according to the Institute for Supply Management. The ISM headline composite index rose one full point to 53.4, notably above of 50 to indicate monthly growth and slightly above February to indicate an increasing rate of growth. Overall, manufacturing is continuing to growth, according to the Institute for Supply Management. The ISM headline composite index rose one full point to 53.4, notably above of 50 to indicate monthly growth and slightly above February to indicate an increasing rate of growth.
New orders, the most important detail in the report, softened very slightly to a still respectable 54.5 which is four tenths below February. Slowing growth in exports is a factor here with the new export order index down 5.5 points to 54.0. But other details show increasing strength including production, backlog orders and, very importantly, employment. Improvement in employment suggests optimism on the part of plant managers. Price data show steady but not increasing pressure on input prices.
 The non-manufacturing economy is growing but at an oscillating pace. Growth in the nation's non-manufacturing sector slowed slightly last month but compared against a very strong February. At 56.0, the ISM non-manufacturing index fell 1.3 points, pulled back by slowing growth in new orders and business activity both of which however remain very healthy. The non-manufacturing economy is growing but at an oscillating pace. Growth in the nation's non-manufacturing sector slowed slightly last month but compared against a very strong February. At 56.0, the ISM non-manufacturing index fell 1.3 points, pulled back by slowing growth in new orders and business activity both of which however remain very healthy.
Health is evident by a strong gain in the employment component which rose one full point to a 56.7 level that's near January's recovery high of 57.4. The hiring index may be more important than the orders index as managers will only add to the work force if demand is expected to be higher.
Economic growth is being nudged down in more than one sector.  First quarter growth is being damped by a dip in construction activity. Construction outlays were weaker than expected in February and broad based. However, the bright spot was multifamily construction. First quarter growth is being damped by a dip in construction activity. Construction outlays were weaker than expected in February and broad based. However, the bright spot was multifamily construction.
Construction spending fell 1.1 percent in February, following a 0.8 percent dip the month before.
The decrease in February was led by a 1.7 percent drop in public construction with private nonresidential decreasing 1.6 percent. New one-family outlays fell 1.5 percent after a 2.2 percent rise in January. However, new multifamily construction gained 2.0 percent after a 2.6 percent boost in January.
The latest construction expenditures report will lead most economists to tweak lower their estimate for first quarter growth.
The first quarter is coming in softer than hoped. Notably, employment is not growing as projected. But seasonal issues may be affecting the numbers. Nonetheless, economic growth appears to be slow in the near term.
The big news this week is on the inflation front with import & export prices Wednesday, PPI on Thursday, and CPI on Friday. Other key indicators are international trade Thursday and consumer sentiment at week’s close.
The NFIB Small Business Optimism Index has risen for six straight months and in February was the highest in a year and the second highest of the recovery. The small business optimism index rose four tenths to 94.3 with gains led by earnings trends and by plans to build inventories. Small businesses also expect their sales to increase.
NFIB Small Business Optimism Index Consensus Forecast for March 12: 94.8
Range: 94.0 to 95.0
Wholesale inventories in January rose 0.4 percent while sales slipped 0.1 percent. Yet the mismatch was not enough to drive up the stock-to-sales ratio which is unchanged at a very efficient 1.15. Despite softness in January's data, wholesale inventories continue to trend lower relative to sales, a trend that's more positively pronounced in the factory sector.
Wholesale inventories Consensus Forecast for February 12: +0.6 percent
Range: +0.3 to +0.8 percent
Import prices jumped a sizable 0.4 percent in February due to higher petroleum prices. Year-on-year, import prices were up 5.5 percent for the smallest rise in more than two years.
Prices of petroleum imports surged 1.8 percent in February for a year-on-year gain of 18.4 percent. Prices on the export side also rose 0.4 percent in the month but year-on-year, export prices are up only 1.5 percent. Agricultural prices have been swinging back and forth and swung 0.9 percent lower in February.
Import prices Consensus Forecast for March 12: +1.0 percent
Range: -0.3 to +1.3 percent
Export prices Consensus Forecast for March 12: +0.3 percent
Range: +0.2 to +1.0 percent
The Beige Book is for the April 24-25 FOMC meeting. With the recently soft employment report, traders are likely to give extra attention to comments on developments in the labor market.
The U.S. Treasury monthly budget report showed a February deficit of $231.7 billion. But the Treasury's budget deficit which, four months into the government' fiscal year, is running 9.4 percent below last year. Calendar shifts are playing a role in the improvement, excluding which the fiscal year-to-date deficit is running 3.3 percent below last year. The receipt side of the ledger shows mostly gains led by corporate income taxes. The outlay side shows mostly declines with the exception of net interest payments. Looking ahead, the month of March typically shows a deficit for the month. Over the past 10 years, the average deficit for the month of March has been $80.5 billion and $97.3 billion over the past 5 years. The March 2011 deficit came in at $188.2 billion.
Treasury Statement Consensus Forecast for March 12: -$188.7 billion
Range: -$212.0 billion to -$180.0 billion.
The U.S. international trade gap expanded in January to $52.6 billion from $50.4 billion in December. Exports advanced 1.4 percent after rebounding 0.4 percent in December. But imports grew a sharp 2.1 percent in January, following a 1.6 percent increase the prior month. The worsening in the trade gap was led by the petroleum goods deficit which widened to $29.7 billion from $27.2 billion in December. The nonpetroleum goods gap, however, was little changed at $36.8 billion from $36.7 billion the month before. The services surplus improved to $14.9 billion from $14.6 billion. Services exports hit an all-time high at $52.2 billion for the month.
International trade balance Consensus Forecast for February 12: -$51.7 billion
Range: -$54.5 billion to -$48.5 billion
Initial jobless claims in the March 31 week declined 6,000 to 357,000. The four-week average was down a sizable 4,250 to 361,750. The latest week's level and the level for the four-week average were both recovery lows.
Jobless Claims Consensus Forecast for 4/7/12: 359,000
Range: 355,000 to 372,000
The producer price index in February surged 0.4 percent after rebounding 0.1 percent in January. The core PPI eased to a 0.2 percent rise after jumping 0.4 percent in January. By major components, energy spiked 1.3 percent after declining 0.5 percent in January. Gasoline was up 4.3 percent after gaining 2.0 percent in January. Food actually dipped 0.1 percent after decreasing 0.3 percent in January. A third of the February rise in the core can be traced to a 0.6 percent advance in prices for pharmaceutical preparations. An increase in the index for civilian aircraft also contributed to higher finished core prices. Weighing on the core was a 0.4 percent decline in light truck prices.
PPI Consensus Forecast for March 12: +0.3 percent
Range: -0.2 to +0.5 percent
PPI ex food & energy Consensus Forecast for March 12: +0.2 percent
Range: -0.1 to +0.3 percent
The consumer price index in February rose 0.4 percent, following a 0.2 percent gain in January. Excluding food and energy, the CPI edged up 0.1 percent, following a 0.2 percent increase in January. Turning to major components, energy jumped a monthly 3.2 percent, following a 0.2 percent rise in January. Gasoline spiked 6.0 percent after a 0.9 percent increase the month before. Food price inflation posted at zero, following a 0.2 percent gain in January. Within the core, indexes for shelter, new vehicles, medical care, and household furnishings and operations all advanced, while indexes for apparel, recreation, used cars and trucks, and tobacco all declined.
CPI Consensus Forecast for March 12: +0.3 percent
Range: +0.1 to +0.5 percent
CPI ex food & energy Consensus Forecast for March 12: +0.2 percent
Range: +0.1 to +0.2 percent
The Reuter's/University of Michigan's consumer sentiment index for the final March reading rose to its best level of the recovery, posting at 76.2 versus February final at 75.3. This report is broken into half month sections and the implied reading for the latter half is 77.1. The last time the index was in this area was early 2008.
Consumer sentiment Consensus Forecast for preliminary April 12: 76.2
Range: 74.0 to 78.6
R. Mark Rogers is the author of The Complete Idiot’s Guide to Economic Indicators, Penguin Books, 2009.
Econoday Senior Writer Mark Pender contributed to this article.
|
