|
It was peculiar. There was essentially no new news about European sovereign debt. And the last impression was favorable. In turn, traders this past week focused on U.S. indicators and corporate news. Net, both were moderately positive although inflation is becoming a bigger question mark.
 Stocks overall posted healthy gains this past week. Equities were mixed at the start of the week with no indicator news and with traders on the sidelines ahead of Tuesday’s FOMC statement. The big move for the week was Tuesday with positive momentum coming from somewhat better than expected retail sales. German investor sentiment was favorable. And even though the Fed did not announce any new plans for further easing, equities rose on the Fed’s upgrade on the status of the economy. Stocks overall posted healthy gains this past week. Equities were mixed at the start of the week with no indicator news and with traders on the sidelines ahead of Tuesday’s FOMC statement. The big move for the week was Tuesday with positive momentum coming from somewhat better than expected retail sales. German investor sentiment was favorable. And even though the Fed did not announce any new plans for further easing, equities rose on the Fed’s upgrade on the status of the economy.
Stocks were mixed Wednesday after the Fed released its stress tests of major banks two days ahead of schedule after market close Tuesday. The Fed's stress tests found four of 19 banks—Citigroup, MetLife, SunTrust and Ally Financial—would have to resubmit capital plans. While analysts generally agreed that the economic scenarios used by the Fed were extreme and there are very low odds of them occurring, the results still mean these banks need to add capital.
Stocks posted moderate gains Thursday on an unexpected and notable drop in initial jobless claims. Helping transport stocks but hurting energy companies was a rumor — later denied — in Washington, D.C. that Britain will cooperate with the United States in a bilateral agreement to release strategic oil stocks in an effort to prevent high fuel prices derailing economic growth.
Stocks ended mixed Friday but generally rose notably for the week. Slowing gains or weighing on stocks was increased concern that higher oil prices will slow economic growth. Industrial production disappointed at the headline level (but details were positive) and consumer sentiment slipped. Nonetheless, news was net positive for the week, with major indexes up significantly.
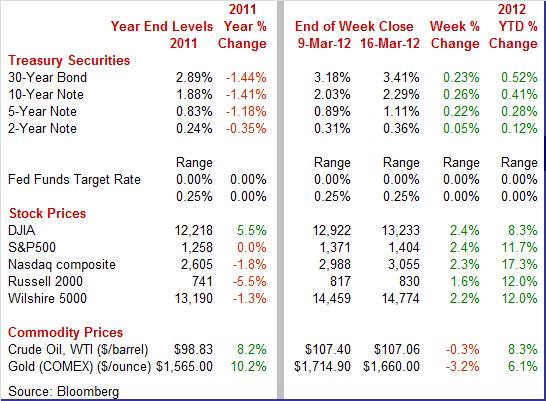
Equities were up this past week. The Dow was up 2.4 percent; the S&P 500, up 2.4 percent; the Nasdaq, up 2.2 percent; and the Russell 2000, up 1.6 percent.
For the year-to-date, major indexes are up as follows: the Dow, up 8.3 percent; the S&P 500, up 11.7 percent; the Nasdaq, up 17.3 percent; and the Russell 2000, up 12.0 percent.
Weekly percent change column reflects percent changes for all components except interest rates. Interest rate changes are reflected in simple differences.
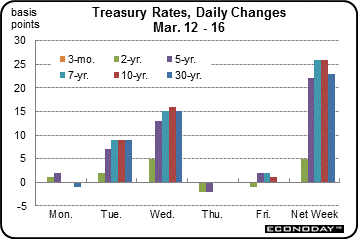 Treasury rates gained significantly this past week. The big moves were on Tuesday and Wednesday. Rates rose Tuesday on strong retail sales, the Fed upgrading the economy, and the Fed not announcing any new plans for additional easing. Rates continued upward Wednesday, essentially on the same news from Tuesday as traders saw bonds overpriced on current strength in the economy and no change in Fed policy stance. Also, flight to safety eased. Treasury rates gained significantly this past week. The big moves were on Tuesday and Wednesday. Rates rose Tuesday on strong retail sales, the Fed upgrading the economy, and the Fed not announcing any new plans for additional easing. Rates continued upward Wednesday, essentially on the same news from Tuesday as traders saw bonds overpriced on current strength in the economy and no change in Fed policy stance. Also, flight to safety eased.
For this past week Treasury rates were up as follows: the 2-year note, up 5 basis points; the 5-year note, up 22 basis points; the 7-year note, up 26 basis points; the 10-year note, up 26 basis points; and the 30-year bond, up 23 basis points. The 3-month T-bill was unchanged.
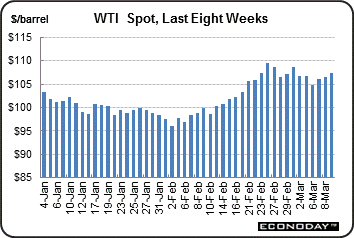 The big news in the market for crude oil is that the price remains very elevated. Net for the week, the spot price for West Texas Intermediate was little changed—down by a fraction of a dollar. The big news in the market for crude oil is that the price remains very elevated. Net for the week, the spot price for West Texas Intermediate was little changed—down by a fraction of a dollar.
There were minor gyrations during the week. Oil dipped Monday on sluggish economic data on China, showing soft factory production and retail sales. Prices declined again at mid-week on news of higher-than-expected crude inventories.
At close of the week, weakness was reversed with a near $2 gain in spot WTI as oil traders were more bullish on the day’s economic news, including positive regional reports on manufacturing and a healthy gain in the manufacturing component of industrial production. A decline in the dollar also lifted the price of crude.
Net for the week, the spot price for West Texas Intermediate nudged down 34 cents per barrel to settle at $107.06.
Economic news that's mixed is a common theme but detail is mostly positive. Inflation is up at the headline level but the Fed is claiming that the acceleration in prices is temporary.
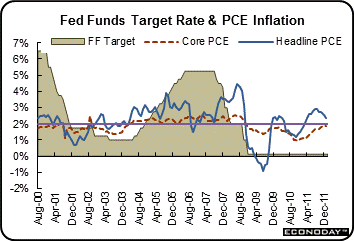 The Fed is on hold for policy. However, the Fed gave the economy a mild upgrade, suggesting that additional ease is not likely. The Fed is on hold for policy. However, the Fed gave the economy a mild upgrade, suggesting that additional ease is not likely.
The Fed left policy rates unchanged with the fed funds target remaining at a range of zero to 0.25 percent. The statement retained language that the fed funds rate is likely to remain exceptionally low at least through late 2014. The vote for the statement was 9 to 1. Richmond Fed President Jeffrey M. Lacker dissented with the minutes noting that he “does not anticipate that economic conditions are likely to warrant exceptionally low levels of the federal funds rate through late 2014.”
Additionally, the Fed retained its Maturity Extension Program or “Operation Twist” to lower long-term interest rates. The Fed also is continuing to reinvest principal payments from its holdings of agency debt and agency mortgage-backed securities in agency mortgage-backed securities and is rolling over maturing Treasury securities at auction.
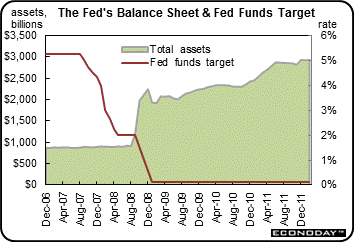
The Fed did take note that the economy is gradually gaining strength. The phrase "expanding moderately" is the key characterization for the economy with the Fed also noting that labor conditions have improved.
The Fed still sees downside risks from global financial markets (read European sovereign debt) though there has been improvement. The Fed sees the recent run up in oil and gasoline prices as temporary and the subsequent inflation will be at or below what is consistent with its dual mandate.
Overall, there were no surprises except for the remaining traders who expected some hint of QE3 or sterilized QE. With the economy gaining momentum, the odds are growing that the Fed is on hold for the rest of the year even as Operation Twist is concluding. The Fed traditionally does not like to make any bold policy changes just before a presidential election (regardless of the party in power). One could argue that Operation Twist could be extended between now and November but not much else is likely to happen.
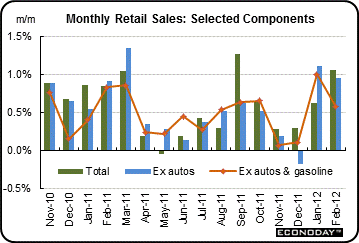 As in many recent months, the retail sales report has been complex. But the bottom line is that consumer spending is healthy. Overall retail sales posted a healthy gain for February on robust auto sales and higher gasoline prices. But the narrow core measure also was healthy and there were upward revisions. As in many recent months, the retail sales report has been complex. But the bottom line is that consumer spending is healthy. Overall retail sales posted a healthy gain for February on robust auto sales and higher gasoline prices. But the narrow core measure also was healthy and there were upward revisions.
Retail sales in February rose a strong 1.1 percent after gaining 0.6 percent the month before (originally up 0.4 percent). Analysts had called for a surge of 0.7 percent. Strength was in the motor vehicles component which rebounded 1.6 percent after dipping 1.6 percent in January. Excluding motor vehicles, retail sales jumped 0.9 percent in February after increasing 1.1 percent in January (originally up 0.7 percent). The consensus projection was for a 0.6 percent rise. Lifted by higher prices, gasoline sales increased 3.3 percent after a 1.9 percent jump the prior month.
Sales excluding autos and gasoline in February January improved 0.6 percent, following a 1.0 percent gain the prior month (originally up 0.6 percent). Gains were widespread. In addition to autos and gasoline, strength was seen in clothing & accessories; building material & garden supplies; sporting goods, hobby, book & music stores; electronics & appliances; and food services & drinking places. Declines were seen in furniture & home furnishings and general merchandise, down 0.1 percent.
The consumer is increasingly willing to spend but certainly is not happy about spending more on gasoline. The February numbers and upward revisions will have economists raising their estimates for first quarter GDP.
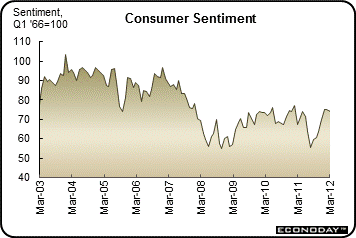 While higher gasoline prices give a boost to headline retail sales, consumers clearly know the real picture. Real spending is less robust as consumer wallets are drained at the gas pump. And it is impacting consumer sentiment. While higher gasoline prices give a boost to headline retail sales, consumers clearly know the real picture. Real spending is less robust as consumer wallets are drained at the gas pump. And it is impacting consumer sentiment.
The Reuter’s/University of Michigan index of consumer sentiment nudged down 1.0 point in preliminary March to 74.3 from the final reading for February. Components were mixed. Current conditions rose from 83.0 to 84.2 while expectations slipped to 68.0 from 70.3.
Rising gas prices may not yet be affecting core inflation at the consumer level but the consumer's inflationary expectations are definitely on the rise for the near term. One-year inflation expectations surged seven tenths during the first two weeks of this month to 4.0 percent which is a very high reading for this report. But five-year inflation expectations, up only one tenth to 3.0 percent, suggest that consumers, at least so far, see the jump at the pump as only temporary and consistent with the Fed’s claim that higher inflation will be transitory.
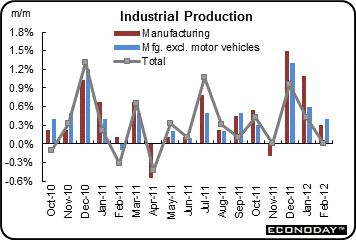 Industrial production in January was unexpectedly soft but due to weakness in mining and utilities. For February, industrial production was unexpectedly soft but due to a drop in mining and flat utilities. Manufacturing rose moderately strong. Overall industrial production was unchanged in February after an upwardly revised 0.4 percent boost the month before. Industrial production in January was unexpectedly soft but due to weakness in mining and utilities. For February, industrial production was unexpectedly soft but due to a drop in mining and flat utilities. Manufacturing rose moderately strong. Overall industrial production was unchanged in February after an upwardly revised 0.4 percent boost the month before.
By major components, manufacturing increased 0.3 percent, following a 1.1 percent surge in January. For the latest month, utilities were unchanged after a 2.2 percent drop in January. Mild winter weather has weighed down on utilities output. Meanwhile, mining output declined 1.2 percent, following a 1.6 percent dip the prior month.
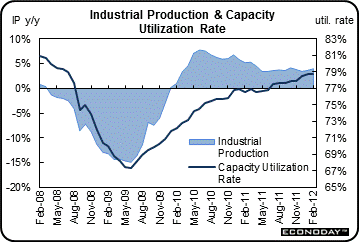 Manufacturing excluding motor vehicles increased 0.4 percent, following a 0.6 percent gain in January. Motor vehicles and parts output dipped 1.1 percent after an 8.6 percent surge in January. Manufacturing excluding motor vehicles increased 0.4 percent, following a 0.6 percent gain in January. Motor vehicles and parts output dipped 1.1 percent after an 8.6 percent surge in January.
Overall capacity utilization posted at 78.7 percent versus 78.8 percent in January. The median market forecast was for 78.8 percent.
Despite the disappointing headline number for industrial production, manufacturing is in good shape. Manufacturing output growth is healthy, especially after discounting volatility from auto production. And recent regional manufacturing surveys have been mostly positive. The latest manufacturing numbers are favorable toward healthy first quarter GDP growth. However, the utilities component in GDP is likely to be weak. But going forward, this is a positive for consumers needing a break from higher oil costs.
 The first look at factory activity for March month was mixed but mainly positive. The Empire State general business conditions index rose to 20.21 in March from 19.53 the month before. Strength was in inventories, number of employees, and delivery time. The first look at factory activity for March month was mixed but mainly positive. The Empire State general business conditions index rose to 20.21 in March from 19.53 the month before. Strength was in inventories, number of employees, and delivery time.
Weakness was in a slowing in new orders growth (though still positive) and shipments growth.
Readings on the six month outlook are very positive but slightly less positive than February and January.
Overall, the Empire State report is net positive—especially with additional hiring indicating a vote of confidence by management in future production trends.
The Philly Fed report for the mid-Atlantic region also was mixed but mostly positive. The general business activity index improved to 12.5 in March from 10.2 in February. The unfilled orders index turned negative.
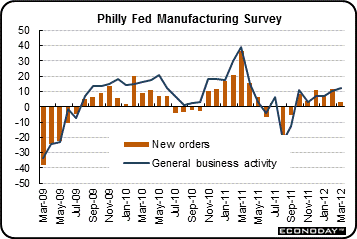
But plant managers are somewhat optimistic. They are hiring at a mildly stronger pace as the number of employees index rose to 6.8 from 1.1 in February. Also, the inventories index swung from minus 12.9 to positive 0.9, suggesting that manufacturers see the need to build inventories.
The bottom line is that manufacturing remains positive though the growth rate is oscillating a bit.
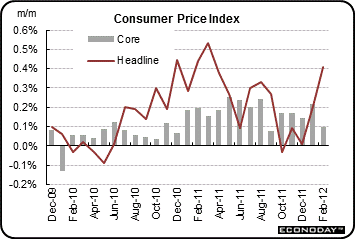 In February, CPI inflation accelerated at the headline on higher energy costs. The core rate, however, eased. The consumer price index rose 0.4 percent, following a 0.2 percent gain in January. Excluding food and energy, the CPI edged up 0.1 percent, following a 0.2 percent increase in January. In February, CPI inflation accelerated at the headline on higher energy costs. The core rate, however, eased. The consumer price index rose 0.4 percent, following a 0.2 percent gain in January. Excluding food and energy, the CPI edged up 0.1 percent, following a 0.2 percent increase in January.
 Turning to major components, energy jumped a monthly 3.2 percent, following a 0.2 percent rise in January. Gasoline spiked 6.0 percent after a 0.9 percent increase the month before. Food price inflation posted at zero, following a 0.2 percent gain in January. Turning to major components, energy jumped a monthly 3.2 percent, following a 0.2 percent rise in January. Gasoline spiked 6.0 percent after a 0.9 percent increase the month before. Food price inflation posted at zero, following a 0.2 percent gain in January.
Within the core, indexes for shelter, new vehicles, medical care, and household furnishings and operations all advanced, while indexes for apparel, recreation, used cars and trucks, and tobacco all declined.
Year-on-year, overall CPI inflation came in at 2.9 percent, holding steady with January’s pace (seasonally adjusted). The core rate nudged down to 2.2 percent from 2.3 percent on a year-ago basis. On an unadjusted year-ago basis, the headline number was up 2.9 percent in February, matching January’s pace. The core was up 2.2 percent versus 2.3 percent in January, not seasonally adjusted.
The February CPI was mixed in terms of the headline number accelerating and the core number softening. While the Fed’s latest meeting statement indicated that the Fed believes the energy related boost to inflation is temporary, there is a reasonable probability that is open to debate as long as tensions in the Middle East remain.
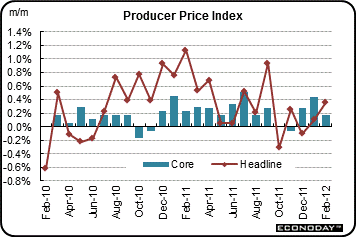 Producer price inflation jumped in February on higher energy costs. Meanwhile, the core rate eased somewhat. The PPI surged 0.4 percent after rebounding 0.1 percent in January. The core PPI eased to a 0.2 percent rise after jumping 0.4 percent in January. Producer price inflation jumped in February on higher energy costs. Meanwhile, the core rate eased somewhat. The PPI surged 0.4 percent after rebounding 0.1 percent in January. The core PPI eased to a 0.2 percent rise after jumping 0.4 percent in January.
By major components, energy spiked 1.3 percent after declining 0.5 percent in January. Gasoline was up 4.3 percent after gaining 2.0 percent in January. Food actually dipped 0.1 percent after decreasing 0.3 percent in January.

A third of the February rise in the core can be traced to a 0.6 percent advance in prices for pharmaceutical preparations. An increase in the index for civilian aircraft also contributed to higher finished core prices. Weighing on the core was a 0.4 percent decline in light truck prices.
For the overall PPI, the year-ago rate in December was 4.8 percent, compared to 5.9 in November (seasonally adjusted). The core rate in December edged up to 3.0 percent from 2.9 percent the month before.
The bottom line is that PPI inflation is likely a little higher than the Fed would like. The Fed’s meeting statement this past week indicated that it expects higher energy costs to be temporary. But the core PPI is running relatively high also. The latest PPI report adds to the argument that the Fed will not be providing additional easing.
The consumer sector and manufacturing remain positive though the upward path for both is still a little bumpy. However, higher energy costs are raising questions about inflation staying near the Fed’s target of 2 percent PCE inflation. The odds of further Fed easing are going down but the economy appears to be slowly gaining traction.
Housing is this week’s focus, starting with the NHBA housing market index Monday and housing starts Tuesday. Existing home sales post Wednesday; FHFA home prices print Thursday; and new home sales are released Friday. Adding to the mix, traders will take note of the Conference Board’s index of leading indicators Thursday.
NAHB housing market index February rose 4 points to 29. This was the second straight 4-point gain and the fifth gain in a row. Gains were evenly split between the three components -- current sales, future sales, buyer traffic -- and are evenly distributed by region.
NAHB housing market index Consensus Forecast for March 12: 30
Range: 29 to 33
Housing starts rebounded 1.5 percent in January after a 1.9 dip the month before. January’s 0.699 million unit pace was up 9.9 percent on a year-ago basis. For the latest month, the rebound was led by the multifamily component. Housing permits also are oscillating slowly upward with a 0.7 percent rise, following a 1.3 percent dip in December.
Housing starts Consensus Forecast for February 12: 0.700 million-unit rate
Range: 0.650 million to 0.775 million-unit rate
Housing permits Consensus Forecast for February 12: 0.700 million-unit rate
Range: 0.670 million to 0.740 million-unit rate
Existing home sales rose 4.3 percent in January to a 4.57 million annual rate. This is a 20-month high. The median price fell a steep 4.6 percent in the month to $154,700. The January report included revisions to seasonal adjustments that turned an initial 5.0 percent gain in December into a 0.5 percent decline. November was revised only slightly lower. The gain in sales took down supply which was 6.1 months at the January sales rate. This was the lowest level of inventory of the economic recovery. But one area of concern is the high share of distressed sales—35 percent versus 32 percent in December.
Existing home sales Consensus Forecast for February 12: 4.61 million-unit rate
Range: 4.44 to 4.80 million-unit rate
Initial jobless claims in the March 10 week declined 14,000 to 351,000. In a partial offset, the prior week was revised 3,000 higher. The four-week average was unchanged at 355,750 which is the recovery low. There are no special factors distorting the data. Continuing claims also moved convincingly lower, down 81,000 in the latest data to 3.343 million and taking down the four-week average by 26,000 to 3.394 million.
Jobless Claims Consensus Forecast for 3/17/12: 352,000
Range: 348,000 to 355,000
The FHFA purchase only house price index improved modestly in December, rising 0.7 percent (SA) after a 0.7 percent gain in November. On a year-on-year basis, the FHFA HPI was down 0.8 percent versus down 2.3 percent in November. Six of the nine Census Divisions posted gains in December, led by a 2.5 percent rise for the Mountain region. Declines were led by a 0.9 percent decrease in the West North Central region. The Middle Atlantic region was unchanged.
FHFA purchase only house price index Consensus Forecast for January 12: +0.4 percent
Range: +0.2 to +0.8 percent
The Conference Board's index of leading indicators advanced a solid 0.4 percent in January following upwardly revised gains of 0.5 and 0.3 percent in the prior two months. Stimulative monetary policy, momentum in the manufacturing sector and a bullish stock market were three central strengths for the economic outlook. Other areas showing strength in January include credit activity and building permits, gains that underscore the improving outlook for the housing and construction sectors. Interestingly, jobless claims pulled the index down in January but, given significant declines so far this month, look to return to the positive column in this report for next month.
Leading indicators Consensus Forecast for February 12: +0.6 percent
Range: +0.3 to +0.8 percent
New home sales posted at a 321,000 annual rate in January. The level was down 0.9 percent on the month but from a sharply upward revised December rate of 324,000 versus an initial reading of 307,000. November was revised 4,000 higher to 318,000, leaving January's sales rate, up a very marginal 3,000 compared to November. The median price nudged up 0.3 percent to $217,100 and followed a 1.6 percent increase in December. On a year-ago basis, the median price was down 9.6 percent in January. Supply nudged down to 5.6 months in January. This was the best supply reading in six years.
New home sales Consensus Forecast for February 12: 325 thousand-unit annual rate
Range: 315 thousand to 345 thousand-unit annual rate
R. Mark Rogers is the author of The Complete Idiot’s Guide to Economic Indicators, Penguin Books, 2009.
Econoday Senior Writer Mark Pender contributed to this article.
|
