|
This past week housing data were mixed but mostly pointed toward modest improvement. And the consumer seems to be in a better mood—but for how long'
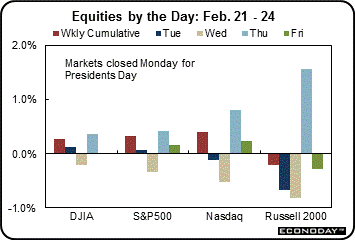 Stocks ended the holiday shortened week with mostly modest gains. The Dow started the week topping 13,000 in intra-day trading on Tuesday but ended the day below but with a modest rise. Other indexes were mixed for the day as a nine-month high in oil prices (due to Iranian worries) offset progress on Greek debt. European finance ministers approved 130 billion euros ($173 billion) in aid for Greece to help that country make upcoming debt payments. Stocks ended the holiday shortened week with mostly modest gains. The Dow started the week topping 13,000 in intra-day trading on Tuesday but ended the day below but with a modest rise. Other indexes were mixed for the day as a nine-month high in oil prices (due to Iranian worries) offset progress on Greek debt. European finance ministers approved 130 billion euros ($173 billion) in aid for Greece to help that country make upcoming debt payments.
Equities declined Wednesday as existing home sales fell short of estimates and sluggish economic data from Europe and China raised worries of softer economic growth. Dell missed forecast estimates and tugged on the tech sector. On the home sale news, home builder and bank stocks declined. Continuing doubts about Greece’s ability to meet current bailout requirements also weighed on stocks.
Thursday, indexes posted moderate to strong gains on an unexpectedly strong dip in initial jobless claims. Also providing support were better than expected house prices (according to the FHFA) and improved manufacturing in the Kansas City Fed District. Corporate news also gave lift as IBM announced cost cutting measures as did Proctor & Gamble.
Stocks were mixed at week’s close even though consumer sentiment posted much higher than expected. New home sales slipped in January and traders focused on that even though December was revised up. Stocks closed the week above or near levels not seen since 2008 before the onset of the recent financial crisis. Still, the Dow closed short of the 13,000 level at 12,983.
Equities were mostly up this past week. The Dow was up 0.3 percent; the S&P 500, up 0.3 percent; and the Nasdaq, up 0.4 percent. However, the Russell 2000 slipped 0.2 percent.
For the year-to-date, major indexes are up as follows: the Dow, up 6.3 percent; the S&P 500, up 8.6 percent; the Nasdaq, up 13.8 percent; and the Russell 2000, up 11.6 percent.

Weekly percent change column reflects percent changes for all components except interest rates. Interest rate changes are reflected in simple differences.
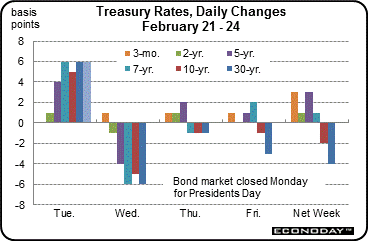 Treasury rates ended the week mixed and with only modest changes. Short rates were up a little while long rates dipped. The only notable swings in rates were the first two days of trading. On Tuesday, rates rose moderately after approval of a bailout package for Greece by European officials, resulting in some reversal of flight to safety. Treasury yields eased somewhat Wednesday on disappointing existing home sales. Also, Fitch Ratings cut Greece’s credit rating and stated that default is likely, bringing back some flight to safety. Rate changes were minimal Thursday and Friday despite a sizeable drop in initial jobless claims. Treasury rates ended the week mixed and with only modest changes. Short rates were up a little while long rates dipped. The only notable swings in rates were the first two days of trading. On Tuesday, rates rose moderately after approval of a bailout package for Greece by European officials, resulting in some reversal of flight to safety. Treasury yields eased somewhat Wednesday on disappointing existing home sales. Also, Fitch Ratings cut Greece’s credit rating and stated that default is likely, bringing back some flight to safety. Rate changes were minimal Thursday and Friday despite a sizeable drop in initial jobless claims.
For this past week Treasury rates were mixed as follows: 3-month T-bill, up 3 basis points; the 2-year note, up 1 basis point; the 5-year note, up 3 basis points; the 7-year note, up 1 basis point; the 10-year note, down 2 basis points; and the 30-year bond, down 4 basis points.
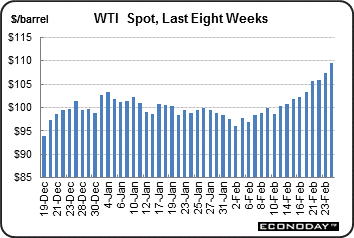 The price of crude surged sharply this past week. The week started Tuesday with spot West Texas Intermediate jumping 2-1/2 bucks a barrel to near $106. The jump was due to favorable news on resolving Greek debt and on news that Iran said it would no longer sell oil to France and Britain after those nations called for sanctions against Iran. The price of crude surged sharply this past week. The week started Tuesday with spot West Texas Intermediate jumping 2-1/2 bucks a barrel to near $106. The jump was due to favorable news on resolving Greek debt and on news that Iran said it would no longer sell oil to France and Britain after those nations called for sanctions against Iran.
Prices were little changed Wednesday but rose by another buck and a half Thursday on the drop in initial jobless claims and also on a better-than-expected report on German business confidence. Spot crude rose another $2 per barrel the last day of the week after Iran dismissed concerns of UN nuclear inspectors.
Net for the week, the spot price for West Texas Intermediate jumped $6.25 per barrel to settle at $109.49. This is the highest settle since the $120.92 mark on September 22, 2008.
Consumers are gradually growing in optimism. Meanwhile, housing is slowly posting net gains but with mixed results in prices. Manufacturing remains healthy.
 Higher gasoline prices have not yet sunk in on the consumer as sentiment improved markedly in latter February. Or consumers are happier about improved job prospects than they are annoyed by higher bills at the gas pump. Higher gasoline prices have not yet sunk in on the consumer as sentiment improved markedly in latter February. Or consumers are happier about improved job prospects than they are annoyed by higher bills at the gas pump.
Consumer sentiment rose three tenths from January for a final February reading 75.3. This compares to mid-February at 72.5 and reflects a strong second-half showing with the implied reading for the period at 78.1 in what would be the best level of the recovery so far.
Current conditions rose nearly 4-1/2 points to 83.0 though the comparison with January's 84.2 points to slight monthly weakness for February as a whole. Expectations rose nearly 2-1/2 points from mid-month to 70.3 which compares favorably to January's 69.1. Inflation expectations, despite rising gas prices, are not yet signaling trouble with one-year expectations at 3.3 percent, up one tenth from mid-month but unchanged from January, and with five-year expectations at 2.9 percent, no change from mid-month though up two tenths month-to-month.

But upside and downside risks to consumer sentiment are both up as the price of crude oil has risen sharply but also with initial jobless claims down notably. Odds are the jobs market improvement, however, wins out as the consumer has seen high oil prices not that long ago and during deep recession. Economic data have been on an uptrend and higher gasoline prices are much more tolerable when there are jobs.
 Big price reductions gave lift to existing home sales which rose 4.3 percent in January to a 4.570 million annual rate. This is a 20-month high. The median price fell a steep 4.6 percent in the month to $154,700. Big price reductions gave lift to existing home sales which rose 4.3 percent in January to a 4.570 million annual rate. This is a 20-month high. The median price fell a steep 4.6 percent in the month to $154,700.
The January report includes revisions to seasonal adjustments that turned an initial 5.0 percent gain in December into a 0.5 percent decline. November is revised only slightly lower.
This January decline was substantial and is confirmed by a 2 percent decline for the median price to $154,700. This was the lowest median price, by the NAR measure, since November 2001. Year-on-year, the median price was down 2.2 percent.
In its report, the National Association of Realtors noted that the strong January number likely was helped by mild winter weather. This time of year, seasonal factors are relatively large since winter weather is less favorable to house hunting. Hence, a modest rise in not seasonally adjusted sales can lead to a large rise in seasonally adjusted sales.
The gain in sales took down supply which was 6.1 months at the January sales rate. This was the lowest level of inventory of the economic recovery. But one area of concern is the high share of distressed sales—35 percent versus 32 percent in December.
Despite the caveat about the impact of mild weather, the trend in sales is modestly favorable and supply overhang is improving. This eventually will help support prices—a goal of the Fed.
 It is all about competition and risk. New homes are competing against existing homes at discount prices. And home builders are cautious about the risk of not making a profit on new home construction. It is all about competition and risk. New homes are competing against existing homes at discount prices. And home builders are cautious about the risk of not making a profit on new home construction.
So new home sales are still sluggish but supply is coming down.
But nevertheless there is a possibly and barely perceivable upward trend in sales. New home sales posted at a 321,000 annual rate in January. The level was down 0.9 percent on the month but from a sharply upward revised December rate of 324,000 versus an initial reading of 307,000. November was revised 4,000 higher to 318,000, leaving January's sales rate, up a very marginal 3,000 compared to November.
Homebuilders in recent months have been a little tighter about pricing than existing home sellers. The median price nudged up 0.3 percent to $217,100 and followed a 1.6 percent increase in December. On a year-ago basis, the median price was down 9.6 percent in January.
Homebuilders have been cautious about new construction being put on the market. Supply, despite the soft sales, is coming down inch by inch, to 5.6 months in January at the current sales rate. This was the best supply reading in six years. Overall, housing is stabilizing but currently at a soft level.
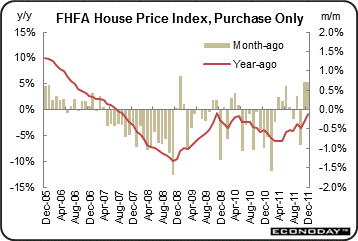 House prices according to the FHFA data improved modestly in December, rising 0.7 percent (SA) after a 0.7 percent gain in November (originally up 1.0 percent). The December figure posted higher than the market consensus for a 0.2 percent rise. House prices according to the FHFA data improved modestly in December, rising 0.7 percent (SA) after a 0.7 percent gain in November (originally up 1.0 percent). The December figure posted higher than the market consensus for a 0.2 percent rise.
On a year-on-year basis, the FHFA HPI is down 0.8 percent versus down 2.3 percent in November.
Six of the nine Census Divisions posted gains in December, led by a 2.5 percent rise for the Mountain region. Declines were led by a 0.9 percent decrease in the West North Central region. The Middle Atlantic region was unchanged.
House price data have been mixed recently. The median price from existing home sales was down in the latest report but those numbers are affected by the mix of sales and distressed sales are high. New home prices have recently nudged up. But Case-Shiller has been declining in recent months and it reflects a broad cross section of the housing market—conventionally and unconventionally financed homes. And FHFA has been on the mildly positive side. However, FHFA reflects the highest quality of the housing market—covering conventional loans financed or bundled by federal agencies. It is a positive that this segment is improving but other segments are mostly lagging and until sales reach a stronger pace, that is likely to continue.
 Manufacturing is showing signs of improvement in the Kansas City Fed District. Its composite manufacturing index rose to 13 in February from 7 the month before. Breakeven is zero for this survey’s diffusion indexes. Manufacturing is showing signs of improvement in the Kansas City Fed District. Its composite manufacturing index rose to 13 in February from 7 the month before. Breakeven is zero for this survey’s diffusion indexes.
Production was healthy at 20 versus 13 the month before. The new orders index eased incrementally to 8 from 9 while the backlog index rose to 13 from 8 in January. Manufacturers are adding to the workforce at a slightly stronger rate as the number of employees index rose to 11 from 9 in January.
The outlook is more favorable as the 6-month out composite gained to 20 in February from 12 the prior month.
Price inflation eased as the current month prices received index slipped to 11 from 13 and the prices paid index slowed to 36 from 42 in January.
Overall, the recovery is gaining traction with the consumer growing slowly in optimism though rising oil prices may offer some offset to gains in the labor market.
Markets will be barraged with economic data this week. Last week’s strong consumer sentiment number will be corroborated or not with consumer numbers on confidence (Tuesday), motor vehicle sales (Thursday), and personal income (Friday). Manufacturing updates are seen with Dallas Fed (Monday), durable orders (Tuesday), Richmond Fed (Tuesday), and ISM manufacturing (Friday). Housing and construction updates are posted with Case-Shiller (Tuesday) and construction outlays (Friday). Also garnering market attention will be Beige Book (Wednesday) and GDP (Thursday).
The pending home sales index in December fell 3.5 percent, following a 7.3 percent gain in November and a 10.4 percent surge in October. Year-on-year, pending home sales were up 5.6 percent and are only three tenths slower than November.
Pending home sales Consensus Forecast for January 12: +1.5 percent
Range: -1.1 to +3.0 percent
The Dallas Fed general business activity index in its Texas manufacturing survey in January shot up to 15.3 after dipping to minus 0.3 in December. The company outlook index also increased markedly, rising from 5.0 in December to 13.5. Both indexes reached their highest readings in 10 months. The new orders index jumped to 9.5, its highest reading in six months, from minus 2.0 in December.
Dallas Fed general business activity index Consensus Forecast for February 12: 15.0
Range: 10.0 to 16.5
Durable goods orders in December jumped another 3.0 percent, following a revised 4.2 percent surge the month before. Excluding transportation, durables rose a healthy 2.2 percent (prior revised estimate 2.1 percent) after a 0.3 percent advance in November. By components, strength was widespread in December.
New orders for durable goods Consensus Forecast for January 12: -0.7 percent
Range: -2.1 percent to +0.5 percent
New orders for durable goods, ex-trans., Consensus Forecast for January 12: +0.3 percent
Range: -1.5 percent to +1.4 percent
The S&P/Case-Shiller 20-city home price index (SA) in November fell 0.7 percent, declining for the sixth straight month. The year-on-year rate of contraction for the composite-20 deepened slightly to minus 3.7 percent from minus 3.4 percent (NSA).
The S&P/Case-Shiller 20-city HPI (SA, m/m) Consensus Forecast for December 12: -0.4 percent
Range: -0.6 to 0.0 percent
The S&P/Case-Shiller 20-city HPI (NSA, m/m) Consensus Forecast for December 12: -0.7 percent
Range: -0.9 to -0.1 percent
The S&P/Case-Shiller 20-city HPI (NSA, y/y) Consensus Forecast for December 12: -3.7 percent
Range: -4.1 to -3.0 percent
The Conference Board's consumer confidence index dipped in January to 61.1 from December's revised 64.8. The report's present situation component fell more than 8 points to 38.4 in what nearly erases December's strong showing. The expectations component also slipped but just barely, to 76.2 versus 77.0 in December.
Consumer confidence Consensus Forecast for February 12: 64.0
Range: 62.0 to 67.0
The Richmond Fed manufacturing index in January jumped 9 points to 12 to indicate significant acceleration underway. January gains for Richmond included new orders, shipments, capacity utilization and employment.
Richmond Fed manufacturing index Consensus Forecast for February 12: 13
Range: 10 to 19
GDP growth in advance estimate for the fourth quarter rose to 2.8 percent from 1.8 percent in the third quarter. However, the component mix was not favorable. Inventory growth accelerated moderately and added 1.94 percentage points to overall growth. This was not a dramatic rise in inventories and they even appear to be about as wanted by businesses. But the bulk of GDP growth came from inventories instead of other components. Demand numbers decelerated as final sales of domestic product increased an annualized 0.8 percent in the fourth quarter after a 3.2 percent rise in the third. Final sales to domestic purchasers (excludes net exports) advanced 0.9 percent, following a 2.7 percent gain in the second quarter. Economy-wide inflation according to the GDP price index eased sharply to 0.4 percent annualized from 2.6 percent in the third quarter.
Real GDP Consensus Forecast for second estimate Q4 11: +2.8 percent annual rate
Range: +2.6 to +3.1 percent annual rate
GDP price index Consensus Forecast for second estimate Q4 11: +0.4 percent annual rate
Range: +0.3 to +0.5 percent annual rate
The Chicago PMI for January eased 2 points to 60.2, well over 50 to indicate strong growth though slightly below December. The new orders index told the same story, at 63.6 versus December's 67.1.
Chicago PMI Consensus Forecast for February 12: 61.0
Range: 58.0 to 62.5
The Beige Book being prepared for the March 15 FOMC meeting is released this afternoon. Traders will be looking for additional signs of the recovery gaining traction or not to evaluate the fading hopes for QE3. Getting special attention likely will be updates on the labor market and also inflation.
Sales of total light motor vehicles jumped to a 14.2 million annual rate in January for a 4.6 percent gain from December. Sales were concentrated in cars which jumped 13.8 percent to a 7.4 million rate. Truck sales actually fell in January, down 4.0 percent to a 6.8 million rate. This is the first time in nine months that the car sales rate exceeded the truck sales rate. Domestics in the latest month posted an 4.7 percent boost to 10.7 million while imports gained 4.2 percent to 3.5 million.
Motor vehicle domestic sales Consensus Forecast for February 12: 11.0 million-unit rate
Range: 10.9 to 11.2 million-unit rate
Motor vehicle total sales Consensus Forecast for February 12: 14.0 million-unit rate
Range: 13.7 to 14.4 million-unit rate
Initial jobless claims for the February 18 week was unchanged 351,000 from the slightly upward revised prior week. For the 11th time in 12 weeks, the four-week average showed improvement, down 7,000 to 359,000. The four-week average was down nearly 20,000 from the month-ago comparison which is substantial improvement. Continuing claims for the February 11 week fell 52,000 to 3.392 million with the four-week average down 46,000 to 3.453 million.
Jobless Claims Consensus Forecast for 2/25/11: 355,000
Range: 345,000 to 360,000
Personal income in December advanced 0.5 percent, following a 0.1 percent rise the prior month. The important wages & salaries component grew a healthy 0.4 percent after no change in November. However, consumer spending in December was sluggish, coming in at flat after edging up 0.1 percent in November. The headline PCE price index firmed a bit to a 0.1 percent rise after no change in November. The core pace was a touch warmer at 0.2 percent in December, compared to 0.1 percent in November and expectations of 0.1 percent. Looking ahead, the private wages & salaries component of income in January should be moderately healthy as aggregate weekly earnings gained 0.4 percent for the month. The goods components of personal spending should be robust as unit new motor vehicle sales spiked 4.6 percent in January while retail sales excluding autos jumped 0.7 percent. On the inflation front, PCE inflation should be a little warm as both headline and core CPIs rose 0.2 percent in January.
Personal income Consensus Forecast for January 12: +0.5 percent
Range: +0.2 to +0.8 percent
Personal consumption expenditures Consensus Forecast for January 12: +0.4 percent
Range: +0.2 to +0.6 percent
PCE price index Consensus Forecast for January 12: +0.2 percent
Range: +0.2 to +0.2 percent
Core PCE price index Consensus Forecast for January 12: +0.2 percent
Range: +0.1 to +0.2 percent
The composite index from the ISM manufacturing survey in January rose to 54.1, 1.0 point over December to indicate a slightly faster rate of expansion. A key highlight of the report was the new orders index which rose 2.8 points to 57.6 to indicate a little bit more than just a moderate rate of monthly expansion. In another positive, backlog orders increased 4.5 points to show a build at 52.5.
ISM manufacturing composite index Consensus Forecast for February 12: 54.6
Range: 54.0 to 55.5
Construction spending in December jumped another 1.5 percent after a 0.4 percent increase the month before. The boost in December was led by a 3.3 percent surge in private nonresidential outlays after a 0.5 percent dip the month before. Residential spending rebounded 0.8 percent after a 0.3 percent decline. Public outlays rose 0.5 percent, following a 1.7 percent boost in November. Looking ahead, the residential component of January outlays should be strong based on recently healthy increases in housing starts.
Construction spending Consensus Forecast for January 12: +1.0 percent
Range: +0.3 to +1.5 percent
R. Mark Rogers is the author of The Complete Idiot’s Guide to Economic Indicators, Penguin Books, 2009.
Econoday Senior Writer Mark Pender contributed to this article.
|
