|
Despite the end of QE2 and policy rates at essentially zero, Fed officials have continued to maintain that they have not run out of ammunition. The latest bullet is “communications” as the FOMC announced a dramatic extension of the period it expects rates to remain exceptionally low. Meanwhile, economic news was mixed. However, lack of notable negative news out of Europe helped offset mixed earnings reports.
 Equities were mixed but mostly up this past week. Trading started tentatively Monday with indexes generally flat to down marginally as many stayed on the sidelines ahead of the Fed’s policy decision on Wednesday. Some support came from news that officials from Germany and France indicated that progress was being made between Greece and bondholders. Also, European finance ministers agreed on a deal on the European Stability Mechanism to be signed on January 30. Equities were mixed but mostly up this past week. Trading started tentatively Monday with indexes generally flat to down marginally as many stayed on the sidelines ahead of the Fed’s policy decision on Wednesday. Some support came from news that officials from Germany and France indicated that progress was being made between Greece and bondholders. Also, European finance ministers agreed on a deal on the European Stability Mechanism to be signed on January 30.
Stocks were mixed Tuesday as the International Monetary Fund downgraded its forecast for the global economy. In corporate news, McDonald's reported an 11 percent increase in profit for the fourth quarter, but lowered guidance due to a decline in the euro which cuts into repatriated profits. McDonald’s gets about 60 percent of its revenue from outside the U.S.
At mid-week, the Fed lifted stocks significantly with its announcement that policy rates likely would remain exceptionally low through late 2014—extending the extended period language from last meetings’ mid-2013. Also adding to market momentum was blowout earnings from Apple released after close Tuesday.
Stocks swung notably Thursday. A strong durables orders report, combined with jobless claims data that were only moderately higher than expected, initially boosted equities. But later in the day, a negative report on new home sales weighed on markets. Home builders and banks were notable recipients of the downdraft. In contrast, Caterpillar far exceeded expectations on increased global demand for construction machinery and mining equipment. 3M also beat projections.
At week’s end, the Commerce Department’s advance estimate improved from the third quarter but fell short of expectations. Detail on final sales was particularly disappointing and weighed on blue chips. Small caps, however, appeared to continue to benefit from the Fed’s announcement Wednesday of further continuation of low rates. Techs rose on rumors that Facebook may issue an IP as early as this coming week. Also, Ford reported its best annual earnings since 1998. But much of the profit was due to tax credits from past losses on its balance sheet. Excluding that credit, Ford’s earnings fell short of analysts' forecasts.
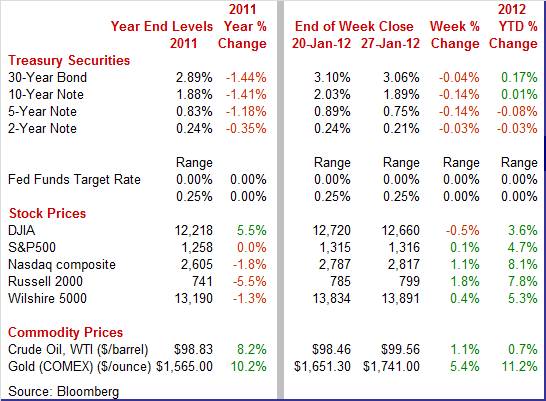
Equities were mostly up this past week. The S&P 500 was up 0.1 percent; the Nasdaq, up 1.1 percent; and the Russell 2000, up 1.8 percent. The Dow declined 0.5 percent
For the year-to-date, major indexes are up as follows: the Dow, up 3.6 percent; the S&P 500, up 4.7 percent; the Nasdaq, up 8.1 percent; and the Russell 2000, up 7.8 percent.
Weekly percent change column reflects percent changes for all components except interest rates. Interest rate changes are reflected in simple differences.
 Treasury yields fell notably this past week with downward pressure coming from the Fed and some misses on economic data. Treasury yields fell notably this past week with downward pressure coming from the Fed and some misses on economic data.
However, the week started in the other direction as progress on solving European sovereign debt problems reduced flight to safety, nudging rates up.
After essentially no change on Tuesday, the Fed’s Wednesday announcement to extend the period of exceptionally low rates to late 2014 sent rates down notably. On Thursday, a lower-than-expected figure for new home sales more than offset a positive surprise for durables orders, bumping Treasury rates down.
At week’s close, it again was dueling indicators with a disappointing advance number for fourth quarter GDP more than offsetting a better-than-expected consumer sentiment number. In turn, rates dipped further.
For this past week Treasury rates were down as follows: the 2-year note, down 3 basis points; the 5-year note, down 14 basis points; the 7-year note, down 14 basis points; the 10-year note, down 14 basis points; and the 30-year bond, down 4 basis points. The 3-month T-bill nudged up 1 basis point.
 The price of crude rose modestly this past week. Volatility was at a minimum as daily close changed by under a $1 each day. Modest upward pressure came from positive news that Greece may be coming to terms with private creditors for debt reduction. And Iran continued to threaten to close the Strait of Hormuz, although many analysts discount the likelihood of Iran being able to do so. Downward pressure came from disappointing indicator news, notably new home sales and GDP. The price of crude rose modestly this past week. Volatility was at a minimum as daily close changed by under a $1 each day. Modest upward pressure came from positive news that Greece may be coming to terms with private creditors for debt reduction. And Iran continued to threaten to close the Strait of Hormuz, although many analysts discount the likelihood of Iran being able to do so. Downward pressure came from disappointing indicator news, notably new home sales and GDP.
Net for the week, the spot price for West Texas Intermediate rose $1.10 per barrel to settle at $99.56.
The past week’s economic news was mixed with GDP up but disappointing, manufacturing and consumer news positive, but housing still in the doldrums. But the big news was changes coming out of the latest FOMC meeting.
 The economy has picked up strength since the first quarter of last year. Even though the latest number continued the pattern of gradually strengthening overall growth, fourth quarter GDP was disappointing. GDP growth rose to 2.8 percent from 1.8 percent in the third quarter. However, the advance estimate came in lower than market expectations for a 3.1 percent boost. The economy has picked up strength since the first quarter of last year. Even though the latest number continued the pattern of gradually strengthening overall growth, fourth quarter GDP was disappointing. GDP growth rose to 2.8 percent from 1.8 percent in the third quarter. However, the advance estimate came in lower than market expectations for a 3.1 percent boost.
More importantly, the component mix was not favorable. Inventory growth accelerated moderately and added 1.94 percentage points to overall growth. This was not a dramatic rise in inventories and they even appear to be about as wanted by businesses. But the bulk of GDP growth came from inventories instead of other components.
Demand numbers decelerated as final sales of domestic product increased an annualized 0.8 percent in the fourth quarter after a 3.2 percent rise in the third. Final sales to domestic purchasers (excludes net exports) advanced 0.9 percent, following a 2.7 percent gain in the second quarter.
Strength in the fourth quarter as mentioned above was largely in inventory investment. Also, PCE spending accelerated to 2.0 percent from 1.7 percent in the third quarter and residential investment improved to 10.9 percent from 1.3 percent. Partially offsetting, government spending fell 4.6 percent after a 0.1 percent dip, nonresidential fixed investment slowed to 1.7 percent from 15.7 percent, and net export worsened slightly.
PCEs growth deserves a little extra attention. For the current quarter, durables were actually robust at 14.8 percent and nondurables modest at 1.7 percent. But what constrained overall PCEs growth were services with an anemic 0.2 percent rise. This may have been weather related to some degree, with atypically warm weather cutting into utilities output. But this may actually be a positive—lower heating bills mean more money to spend elsewhere. Atypically warm weather also likely cut into apparel sales. “Weather adjusted” PCEs growth may have actually been moderately strong. We will get more detail with the January 30 release of personal income and spending for the month of December.
On a year-ago basis, GDP was up 1.6 percent, compared to 1.5 percent in the third quarter.
Economy-wide inflation according to the GDP price index eased sharply to 0.4 percent annualized from 2.6 percent in the third quarter. Analysts had called for a 1.5 percent rise.
The economy overall improved in the fourth quarter but the mix was not as favorable as hoped. The modest improvement in consumer spending is encouraging but more is needed. The Fed appears to have been correct that low rates are needed for some time to boost investment and spending.
 The Fed’s bazooka currently is communications and the FOMC fired away at this past week’s FOMC meeting. But first, the Fed announced in the statement that it retained the current policy rate range of 0.0 to 0.25 percent. More importantly, the FOMC changed key language. Instead of saying that the policy rate will remain exceptionally low likely through mid-2013, the Fed now says the fed funds rate is likely to remain exceptionally low through LATE 2014 (emphasis added). Otherwise, the statement was essentially the same as in December 2011. The Fed’s bazooka currently is communications and the FOMC fired away at this past week’s FOMC meeting. But first, the Fed announced in the statement that it retained the current policy rate range of 0.0 to 0.25 percent. More importantly, the FOMC changed key language. Instead of saying that the policy rate will remain exceptionally low likely through mid-2013, the Fed now says the fed funds rate is likely to remain exceptionally low through LATE 2014 (emphasis added). Otherwise, the statement was essentially the same as in December 2011.
The vote for the statement language was 9 to 1 with Richmond Fed President Jeffrey M. Lacker dissenting. He wanted to omit language indicating how long the rate is expected to remain exceptionally low. In contrast, Chicago Fed President Charles Evans did not dissent this time. In December, he dissented in favor of immediate additional easing. In a news release Friday, Lacker explained his dissent, saying that he believes rates will need to go up before the end of 2014.
Since the statement was otherwise essentially unchanged, the following summarizes key points.
The economy is expanding “moderately” despite slowing in global growth. The unemployment rate will decline but only gradually. Inflation is expected to run at levels at or below the FOMC’s mandate. The Maturity Extension Program (aka Operation Twist) continues. The Fed will continue to reinvest principal payments from its holdings of agency debt and agency mortgage-backed securities in agency mortgage-backed securities and will continue to roll over maturing Treasury securities at auction.
 Essentially, the Fed is keeping monetary policy extremely loose and is encouraging businesses to make plans based on low interest rates. Also, the Fed does not seem to buying into the view that the recovery is gaining notable traction. Or at least the Fed sees the risk of too slow growth as too high. Though there is no reference in the statement (but could be in the minutes), the Fed must be aware that fiscal policy is likely to be modestly contractionary in coming quarters. The Fed’s emphasis on continued low interest rates will help boost some asset values. Equities are more attractive and there is some additional support for house prices. Essentially, the Fed is keeping monetary policy extremely loose and is encouraging businesses to make plans based on low interest rates. Also, the Fed does not seem to buying into the view that the recovery is gaining notable traction. Or at least the Fed sees the risk of too slow growth as too high. Though there is no reference in the statement (but could be in the minutes), the Fed must be aware that fiscal policy is likely to be modestly contractionary in coming quarters. The Fed’s emphasis on continued low interest rates will help boost some asset values. Equities are more attractive and there is some additional support for house prices.
 The Fed for the first time released in its forecasts a projection for the fed funds rate and timing for when the next rate move is expected. Overall, the Fed lowered its forecasts for GDP growth, the unemployment rate, and inflation. The central tendency forecast for GDP for Q4 2012 was lowered to a range of 2.2 to 2.7 percent from a range of 2.5 to 2.9 percent forecast in November. The Fed for the first time released in its forecasts a projection for the fed funds rate and timing for when the next rate move is expected. Overall, the Fed lowered its forecasts for GDP growth, the unemployment rate, and inflation. The central tendency forecast for GDP for Q4 2012 was lowered to a range of 2.2 to 2.7 percent from a range of 2.5 to 2.9 percent forecast in November.
Regarding the fed funds rate, the average forecast for the rate at the end of 2014 is fractionally over 1 percent. Unexpectedly, at the same time as the release of the forecasts, the Fed essentially announced a long-run inflation target of 2 percent.
Regarding the timing of the next firming in policy, 3 participants indicated it should be in 2012, 3 in 2013, 5 in 2014, 4 in 2015, and 2 in 2016. FOMC participants generally see 4 to 4.5 percent as the appropriate long-run fed funds rate. Seven indicated 4 percent; 6 indicated 4.5 percent; 3 indicated 4.25 percent; and 1 indicated 3.75 percent.
 Manufacturing is picking up steam as December durables were unexpectedly strong. New factory orders for durables in December jumped another 3.0 percent, following a 4.3 percent surge the month before (prior revised estimate, up 3.7 percent). Excluding transportation, durables rose a healthy 2.1 percent after a 0.5 percent advance in November (prior revised estimate, up 0.3 percent). Manufacturing is picking up steam as December durables were unexpectedly strong. New factory orders for durables in December jumped another 3.0 percent, following a 4.3 percent surge the month before (prior revised estimate, up 3.7 percent). Excluding transportation, durables rose a healthy 2.1 percent after a 0.5 percent advance in November (prior revised estimate, up 0.3 percent).
By components, strength was widespread in December. Transportation grew 5.5 percent, following a 16.6 percent surge in November. Subcomponent strength was in nondefense aircraft although motor vehicles also gained.
Outside of transportation, orders were positive in most major subcomponents. Increases were seen in primary metals, up 5.1 percent; machinery, up a robust 6.0 percent; computers, electronics & communications equipment, up 1.2 percent; and “other” durables, up 0.2 percent. Declining were fabricated metals, down 1.4 percent, and electrical equipment, down 1.1 percent.
There are signs that business investment in equipment may be regaining momentum. New orders for nondefense capital goods excluding aircraft rebounded 2.9 percent, following a 1.2 percent dip in November. Shipments for this series also improved, rising 2.9 percent in December, following a 1.0 percent decline the month before.
 The home builders' housing market index may be indicating a surge of strength underway in the new home market, but this surge has yet to appear in current sales of new homes. New home sales fell 2.2 percent to a disappointingly soft annual rate of 307,000. While the number fell short of expectations, the dip did follow 3 consecutive gains—4.1 percent in September, 1.7 percent in October, and 2.3 percent in November. Sales are not particularly strong but the trend may still be up. The home builders' housing market index may be indicating a surge of strength underway in the new home market, but this surge has yet to appear in current sales of new homes. New home sales fell 2.2 percent to a disappointingly soft annual rate of 307,000. While the number fell short of expectations, the dip did follow 3 consecutive gains—4.1 percent in September, 1.7 percent in October, and 2.3 percent in November. Sales are not particularly strong but the trend may still be up.
Details for December showed a swing lower in the South which in this series is by far the largest and most important region. Nationally, the number of new homes on the market slipped slightly but not enough to offset the larger decline in sales, making for an uptick to 6.1 months of supply. This is the first time in 6 months that this reading failed to improve.
Another disappointment in the report is the median price which fell 2.5 percent to $210,300. Year-on-year, the median price is down 12.8 percent for the worst reading of the recovery.
Housing is still depressed as noted in the latest FOMC statement. Demand may be on a modest uptrend but recent data have been volatile, making the direction uncertain.
 Another housing indicator showing recently sharp swings is pending existing home sales. Contract signings eased in December after moving sharply higher in the prior two months. Pending home sales fell 3.5 percent in the month following a 7.3 percent gain in November and a 10.4 percent surge in October. Year-on-year, pending home sales were up 5.6 percent and are only three tenths slower than November. Another housing indicator showing recently sharp swings is pending existing home sales. Contract signings eased in December after moving sharply higher in the prior two months. Pending home sales fell 3.5 percent in the month following a 7.3 percent gain in November and a 10.4 percent surge in October. Year-on-year, pending home sales were up 5.6 percent and are only three tenths slower than November.
The trend in this series, despite December's dip, points to continuing improvement in existing home sales. Extremely low mortgage rates—with help from the Fed’s Maturity Extension Program—are helping to boost the pool of potential homebuyers. But what is really needed is acceleration in job creation. Until then, housing gains are likely to be slow.
 Volatility continues to be the theme for most housing indicators recently. According to the FHFA, house prices in November rebounded 1.0 percent after declining 0.7 percent in October November's number came in higher than expectations for a 0.1 percent decrease. Volatility continues to be the theme for most housing indicators recently. According to the FHFA, house prices in November rebounded 1.0 percent after declining 0.7 percent in October November's number came in higher than expectations for a 0.1 percent decrease.
Eight of the 9 Census Divisions posted gains in November, led by a 2.1 percent rise for the West South Central region. On the downside, the only decrease was for a 0.2 percent dip in the Middle Atlantic region.
On a year-on-year basis, the FHFA HPI is down 1.8 percent versus down 3.3 percent in October. Compared to the peak for this house price index in April 2007, prices are still down 14.5 percent nationally. The FHFA index is based on data from mortgages financed or bundled by federal housing agencies and has higher quality mortgages than in the Case-Shiller home price index which includes unconventional financed homes.
The housing market is still struggling. Although house prices firmed, they are still depressed. Essentially, housing sales and prices are trying to oscillate upward from recent bottoms. There appears to be an improvement trend for housing but it is unsteady.
 The biggest skeptic of the recovery has been the consumer—at least in terms of sentiment (spending has been better than sentiment). But the consumer is gradually being won over to the view that economic improvement is real, though still slow. The biggest skeptic of the recovery has been the consumer—at least in terms of sentiment (spending has been better than sentiment). But the consumer is gradually being won over to the view that economic improvement is real, though still slow.
The Reuters/University of Michigan consumer sentiment index rose 1 point in the final January reading to 75.0. The mid-month reading of 74.0 was up more than 4 points from the final December reading which is a very strong gain. The implied reading for the last two weeks is a very solid 76.0 (based on the monthly survey sample being about equally distributed between the first half and second half). Levels are above the year-ago comparison for the first time in a year.
The latest rise in the sentiment index was led by the leading component of expectations which was at 69.1 for a 5.5 point gain from December. Current conditions, at 84.2, were up 4.6 points from December.
The improvement in the consumer mood is encouraging as more growth in demand is needed to help the first quarter top the 3 percent pace for GDP.
 The Conference Board gave the index of leading indicators a huge makeover with the release of December data. Among the changes are a casting out of money supply in favor of a credit measure and the casting out of deliveries in favor of the ISM new orders index. In recent months, the money supply number had been skewed by off and on flight to safety with funds in various trading and mutual fund accounts (not in M2) moving back and forth to cash accounts (in M2). The Conference Board gave the index of leading indicators a huge makeover with the release of December data. Among the changes are a casting out of money supply in favor of a credit measure and the casting out of deliveries in favor of the ISM new orders index. In recent months, the money supply number had been skewed by off and on flight to safety with funds in various trading and mutual fund accounts (not in M2) moving back and forth to cash accounts (in M2).
The first reading from the new mix of components showed a respectable 0.4 percent gain for December versus sharply downward revised gains in the prior two months of plus 0.2 and plus 0.6 percent. For the latest month, the biggest positive contributions came from the rate spread (between the 10-year T-note and fed funds) and initial jobless claims. Other readings were close to neutral but with consumer expectations a moderate negative.
Other details include a 0.3 percent gain for the coincident index, up from a 0.1 percent gain in December but down from an outsized 0.8 percent gain in November. Overall, this report shows continued moderate growth in the current economy with forward momentum also just moderate.
The recovery clearly improved in the fourth quarter. The big question is regarding momentum. The mix of GDP between inventories and final sales was not good. But details about PCEs may indicate that underlying demand is a little stronger than implied by official final sales numbers. And recently favorable durables orders and consumer sentiment appear to outweigh sluggish housing data. The strength of the recovery is more uncertain in both directions after this past week’s data. And the Fed decided to err with keeping policy loose. At this point, for the first half of 2012, odds are that growth will be modest with equal upside and downside risks but no signs of recession.
The economic calendar is jam packed with the highlights on the consumer bookending the week with personal income on Monday and the January employment situation on Friday. Rounding out the consumer updates are confidence (Tuesday), ADP employment and motor vehicle sales (Wednesday). Construction sector updates post with Case-Shiller home price index (Tuesday) and construction outlays (Wednesday). Manufacturing news includes ISM (Wednesday) and factory orders (Friday) with ISM non-manufacturing also at week’s close.
Personal income in November grew 0.1 percent, following a 0.4 percent increase the month before. However, the wages & salaries component slipped 0.1 percent after a 0.6 percent increase in October. Consumer spending in November advanced a soft 0.1 percent, following a 0.1 percent increase the month before. The headline PCE price index was unchanged after dipping 0.1 percent in October. Analysts had called for a 0.1 percent increase. The core rate held steady at 0.1 percent in November. Looking ahead, we are likely to see a notable gain in the private wages & salaries component in December as aggregate payroll earnings jumped 0.7 percent for the month. Personal consumption expenditures are likely to be sluggish in general. For the month, unit new motor vehicle sales nudged down 0.5 percent while retail sales excluding autos dipped 0.2 percent. PCE inflation should be tame as the CPI for December was flat and the core CPI rose 0.1 percent.
Personal income Consensus Forecast for December 11: +0.4 percent
Range: +0.1 to +0.5 percent
Personal consumption expenditures Consensus Forecast for December 11: +0.1 percent
Range: 0.0 to +0.2 percent
PCE price index Consensus Forecast for December 11: +0.1 percent
Range: 0.0 to +0.2 percent
Core PCE price index Consensus Forecast for December 11: +0.1 percent
Range: +0.1 to +0.2 percent
The Dallas Fed general business activity index in December dipped to minus 3.0 from plus 3.2 in November. The production index improved but remained in mild contraction at minus 1.3 versus minus 5.1 in November. The index for volume of new orders posted a similar pattern, improving to minus 0.5 from minus 5.1 the prior month.
Dallas Fed general business activity index Consensus Forecast for January 12: 1.0
Range: 0.0 to 4.0
The employment cost index rose a quarter-to-quarter 0.3 percent in the third quarter from outsized 0.7 percent and 0.6 percent gains in the prior two quarters. In the latest period, benefit costs slowed to 0.1 percent in the third quarter, down from 1.3 percent and 1.1 percent in the prior two quarters. Wages & salaries rose a respectable 0.3 percent, following a run of 0.4 percent gains.
Employment cost index Consensus Forecast for Q4 11: +0.4 percent
Range: +0.3 to +0.6 percent
The S&P/Case-Shiller 20-city home price index (SA) fell 0.6 percent in October following a revised 0.7 percent decline in September and a 0.4 percent decline in August. On an unadjusted basis, contraction steepened from a revised 0.7 percent in September to 1.2 percent in October. The deeper monthly contraction here likely reflects, at least in part, the dampening effects on demand from seasonally colder weather. In some parts of the U.S., atypically early snow storms in October likely hurt demand.
The S&P/Case-Shiller 20-city HPI (SA, m/m) Consensus Forecast for November 11: -0.4 percent
Range: -1.1 to 0.0 percent
The Chicago PMI for December was little changed at a very strong 62.5 versus 65.2 the month before. Strength was led by the new orders index which posted at a healthy 68.0 compared to 70.2 the prior month.
Chicago PMI Consensus Forecast for January 12: 63.0
Range: 59.0 to 65.5
The Conference Board's consumer confidence index in December posted a solid 9.3 point rise to 64.5 for the best reading in eight months. The consumer view of the jobs situation clearly is improving, although slowly. Those saying jobs are currently hard to get were down to 41.8 percent from 43.0 percent in November for the lowest level of the recovery. And for the first time since April, there were more optimists, 17.1 percent, than pessimists, 14.4 percent, when it comes to their own income outlook.
Consumer confidence Consensus Forecast for January 12: 68.0
Range: 62.5 to 72.0
Sales of total light motor vehicles slipped incrementally in December but remained at a relatively strong sales level. Combined domestics and imports nudged down 0.5 percent to fractionally above 13.6 million units annualized from fractionally below 13.6 million units the month before. In plain English, sales were essentially unchanged at 13.6 million. Sales were up 8.4 percent on a year-ago basis. Total imports rose 0.4 percent in December to 3.3 million units annualized while domestics slipped 0.9 percent to 10.2 million.
Motor vehicle total sales Consensus Forecast for January 12: 13.6 million-unit rate
Range: 13.4 to 14.1 million-unit rate
ADP private payroll employment for December was an estimate of 325,000. The BLS private payroll number for the month posted with a gain of 212,000.
ADP private payrolls Consensus Forecast for January 12: 172,000
Range: 110,000 to 235,000
The composite index from the ISM manufacturing survey in December improved to 53.9 from 52.7 in November, moving further into positive territory. Index levels above 50 indicate positive growth with higher levels indicating stronger rates of growth. The latest gain in the composite was led by increases in the production and employment indexes. Production jumped to 59.9 from 56.6 in November. Employment rose to 55.1 from 51.8. The boost in employment is likely a vote of confidence by manufacturing management for stronger demand in coming months.
ISM manufacturing composite index Consensus Forecast for January 12: 54.5
Range: 53.0 to 56.0
Construction spending in November jumped 1.2 percent after slipping 0.2 percent in October. The November increase was led by a 2.0 percent gain in private residential outlays, following a 2.3 percent boost in October. Both the single-family and multifamily subcomponents showed strength. Public outlays rebounded 1.7 percent, following a 1.8 percent decline in October. Private nonresidential construction spending was unchanged in November after decreasing 0.6 percent the prior month.
Construction spending Consensus Forecast for December 11: +0.5 percent
Range: -0.6 to +1.4 percent
Initial jobless claims for the January 21 week rose 21,000 in the January 21 week, yet despite the big jump the 4-week average actually fell 2,500 to 377,500. This level was convincingly below 400,000 to indicate another month of likely meaningful improvement for the monthly employment report. Continuing claims in data for the January 14 week rose 88,000 to 3.554 million following the prior week's major decline of 181,000. The four-week average for this reading was down 16,000 to 3.569 million..
Jobless Claims Consensus Forecast for 1/28/12: 370,000
Range: 368,000 to 375,000
Nonfarm business productivity for the third quarter was revised down to a 2.3 percent rise, compared to the initial estimate of 3.1 percent and a 0.1 percent dip in the second quarter. The output component was revised down to a gain of 3.2 percent from the original 3.8 percent. Hours worked were nudged up to a 0.8 percent annualized increased from the original 0.6 percent. Unit labor costs were revised to an annualized 2.5 percent decrease, compared to the first estimate of a 2.4 percent drop.
Nonfarm Business Productivity Consensus Forecast for initial Q4 11: 0.8 percent annual rate
Range: -0.2 to +2.2 percent annual rate
Unit Labor Costs Consensus Forecast for initial Q4 11: +1.0 percent annual rate
Range: -0.4 to +1.5 percent annual rate
Nonfarm payroll employment in December jumped a relatively healthy 200,000 after rising a revised 100,000 in November and increased a revised 112,000 in October. Private payrolls again outstripped the total, gaining 212,000 in December, following increases of 120,000 in November and 134,000 in October. Average hourly earnings strengthened in December, rising 0.2 percent after no change in November. The average workweek for all workers in December posted at 34.4 hours, compared to 34.3 hours in November. From the household survey, the unemployment rate unexpectedly continued to decline, slipping to 8.5 percent after dropping to 8.7 percent in November from 8.9 percent in October.
With the release of January 2012 data on February 3, 2012, the establishment survey will introduce revisions to nonfarm payroll employment, hours, and earnings data to reflect the annual benchmark adjustment for March 2011 and updated seasonal adjustment factors. Not seasonally adjusted data beginning with April 2010 and seasonally adjusted data beginning with January 2007 are subject to revision.
Nonfarm payrolls Consensus Forecast for January 12: 135,000
Range: 110,000 to 189,000
Private payrolls Consensus Forecast for January 12: 150,000
Range: 125,000 to 203,000
Unemployment rate Consensus Forecast for January 12: 8.5 percent
Range: 8.3 to 8.7 percent
Average workweek Consensus Forecast for January 12: 34.4 hours
Range: 34.3 to 34.4 hours
Average hourly earnings Consensus Forecast for January 12: +0.2 percent
Range: 0.0 to +0.3 percent
Factory orders fell 0.4 percent in October with both orders for durables goods, down 0.5 percent, and orders for non-durable goods, down 0.3 percent, showing weakness. The decline on the durables side was skewed by a monthly downswing in aircraft orders while the decline on the non-durables side reflected price changes for energy products. More recently, new factory orders for durables in December jumped another 3.0 percent, following a revised 4.3 percent surge the month before (prior revised estimate, up 3.7 percent). Excluding transportation, durables rose a healthy 2.1 percent after a 0.5 percent advance in November (prior revised estimate, up 0.3 percent).
Factory orders Consensus Forecast for December 11: +1.5 percent
Range: -1.0 to +2.3 percent
The composite index from the ISM non-manufacturing survey in December edged only six tenths higher to 52.6, indicating only mild month-to-month growth in general business conditions. New orders, at 53.2, were no more than moderate though they were up two tenths from November.
ISM non-manufacturing composite index Consensus Forecast for January 12: 53.3
Range: 52.0 to 54.0
R. Mark Rogers is the author of The Complete Idiot’s Guide to Economic Indicators, Penguin Books, 2009.
Econoday Senior Writer Mark Pender contributed to this article.
|
