|
Forward momentum in the U.S. is outweighing renewed worries over European sovereign debt. Even though European issues are important, traders and investors have been moving toward the position that European problems deserve less weight than they have been given in recent months. This may or may not be realistic.
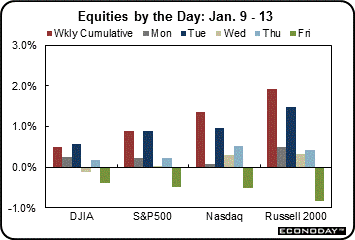 Equities trended up the first four days of trading with a drop on Friday cutting into the week’s gains. The start of the week was boosted by favorable news out of Europe that German Chancellor Angela Merkel and French President Nicolas Sarkozy were working on a plan for rescuing the euro over the next three months. Also, consumer credit outstanding unexpectedly surged, indicating improved consumer confidence about the economy and personal finances. After close, Alcoa reported a fourth quarter loss on slumping metals prices but did offer an upbeat demand forecast. Equities trended up the first four days of trading with a drop on Friday cutting into the week’s gains. The start of the week was boosted by favorable news out of Europe that German Chancellor Angela Merkel and French President Nicolas Sarkozy were working on a plan for rescuing the euro over the next three months. Also, consumer credit outstanding unexpectedly surged, indicating improved consumer confidence about the economy and personal finances. After close, Alcoa reported a fourth quarter loss on slumping metals prices but did offer an upbeat demand forecast.
Stocks gained Tuesday as bad news out of China was viewed as good news. A drop in China’s import growth was seen as leading to monetary easing in that country. Relatively upbeat comments by ratings agency Fitch on Europe also provided lift. Market enthusiasm was tempered by upcoming Italian and Spanish debt auctions later in the week.
Wednesday saw greater movement in a break between U.S. equities and events in Europe. The euro hit a 16 month low after Fitch Ratings warned of dire consequences if the European Central Bank did not take more action to support the currency. While equities were mixed, they were more up than down with a more positive Beige Book on Wednesday afternoon contributing.
Thursday got off to a difficult start as jobless claims rose more than expected and retail sales were softer than projected. But later in the day, global equities rose as government auctions in Spain and Italy went better than expected, helping those countries to finance their debt at lower costs. Bank stocks were key beneficiaries.
At week’s close, the big news was a surge in consumer sentiment, helping to partially offset first rumors then confirmation of a Standard & Poor’s downgrade for several Eurozone countries. Nonetheless, market reaction was more muted than in recent months.
Equities were up this past week. The Dow was up 0.5 percent; the S&P 500, up 0.9 percent; the Nasdaq, up 1.4 percent; and the Russell 2000, up 1.9 percent.
For the year-to-date, major indexes are up as follows: the Dow, up 1.7 percent; the S&P 500, up 2.5 percent; the Nasdaq, up 4.1 percent; and the Russell 2000, up 3.1 percent.
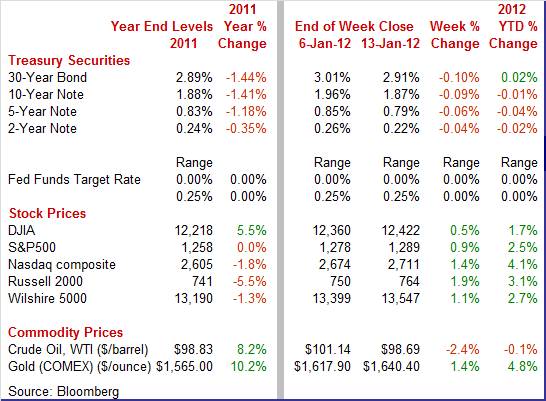
Weekly percent change column reflects percent changes for all components except interest rates. Interest rate changes are reflected in simple differences.
 Treasury yields declined this past week, largely on safe harbor moves. Notable moves were on Wednesday and Friday. Treasury yields declined this past week, largely on safe harbor moves. Notable moves were on Wednesday and Friday.
Rates declined Wednesday on concern that resolution of Europe’s sovereign debt crisis is not coming soon. Also, the Federal Reserve bought $1.39 billion of Treasury Inflation Protected Securities as part of its program to replace short-term debt in its portfolio with longer-term TIPS to reduce longer-term borrowing costs.
Flight to safety was boosted at week’s end on rumors that Standard & Poor’s would be downgrading later in the day several European countries on sovereign debt concerns. France’s finance minister confirmed late Friday that it would be losing its coveted AAA rating. S&P made the official announcement after U.S. close. Also on the downgrade list are Italy, Spain, Portugal, Austria, Malta, Cyprus, Slovakia, and Slovenia. On the plus side, Germany, Europe’s largest economy, retained its AAA rating as did Finland, the Netherlands, and Luxembourg. Probably the biggest news is that there was not more market reaction during trading hours but the extent of the downgrades may or may not have been taken into account.
For this past week Treasury rates were down as follows: the 2-year note, down 4 basis points; the 5-year note, down 6 basis points; the 7-year note, down 8 basis points; the 10-year note, down 9 basis points; and the 30-year bond, down 10 basis points. The 3-month T-bill oscillated up 1 basis point.
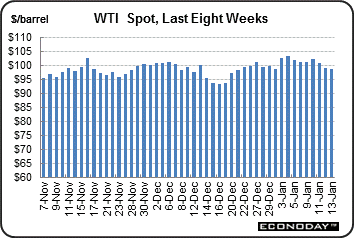 The spot price of crude fell notably this past week. Spot WTI dropped a little under a buck and a half at mid-week on higher than expected supply and on news that the German economy had shrank. The spot price for West Texas Intermediate fell somewhat over a buck and a half Thursday after officials with the European Union indicated that it would take about six months to implement an embargo of Iranian oil in response to that country’s lack of compliance with international supervision with its nuclear program. The spot price of crude fell notably this past week. Spot WTI dropped a little under a buck and a half at mid-week on higher than expected supply and on news that the German economy had shrank. The spot price for West Texas Intermediate fell somewhat over a buck and a half Thursday after officials with the European Union indicated that it would take about six months to implement an embargo of Iranian oil in response to that country’s lack of compliance with international supervision with its nuclear program.
Net for the week, the spot price for West Texas Intermediate dropped $2.45 per barrel to settle at $98.69.
Economic news was mixed as retail sales gained at a slower pace, consumer sentiment jumped, consumer credit surged, the trade deficit worsened, business inventories rose moderately, and the Beige Book was a little more upbeat.
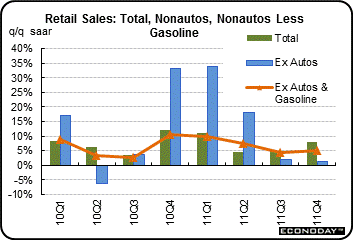
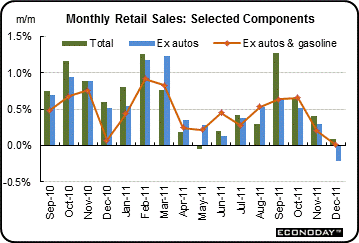 The year for consumer spending ended with a whimper rather than the hoped for roar. December retail sales advanced but less than expected but part of the slowing was due to upward revisions to November and October. Retail sales in December edged up 0.1 percent, following a 0.4 percent rise in November (originally up 0.2 percent) and 0.7 percent gain in October (previously up 0.6 percent). The latest strength came from motor vehicles which increased 1.5 percent, after a 0.9 percent rise the prior month. The year for consumer spending ended with a whimper rather than the hoped for roar. December retail sales advanced but less than expected but part of the slowing was due to upward revisions to November and October. Retail sales in December edged up 0.1 percent, following a 0.4 percent rise in November (originally up 0.2 percent) and 0.7 percent gain in October (previously up 0.6 percent). The latest strength came from motor vehicles which increased 1.5 percent, after a 0.9 percent rise the prior month.
 Excluding autos, retail sales actually fell 0.2 percent in December after increasing 0.3 percent in November and gaining 0.5 percent in October. Gasoline sales dropped 1.6 percent after a 0.9 percent increase in November. Excluding autos, retail sales actually fell 0.2 percent in December after increasing 0.3 percent in November and gaining 0.5 percent in October. Gasoline sales dropped 1.6 percent after a 0.9 percent increase in November.
Sales excluding autos and gasoline in December were flat, following a modest 0.2 percent increase in November. Within the core (excluding autos and gasoline), gains were led by building materials, clothing, and food services & drinking places. Weakness was led by a drop in electronics & appliance stores with general merchandise stores posting a notable dip also.
 Consumers were still spending in December and front loaded a bit in November. But some subsectors apparently did a bit of price discounting (likely electronics among others) and we may see that in quarterly earnings. Consumers were still spending in December and front loaded a bit in November. But some subsectors apparently did a bit of price discounting (likely electronics among others) and we may see that in quarterly earnings.
However, for GDP purposes, real spending likely was stronger than suggested at face value in December retail sales since inflation was almost certainly negative for some retail components such as gasoline, electronics, and perhaps clothing. As shown in the quarterly chart, the gasoline component has caused large swings in the ex-autos series (note how much ex autos growth swings relative to the total). After autos and gasoline are taken out, the fourth quarter actually looks a little better than the third quarter with annualized nominal growth of 5.1 percent versus 4.6 percent in the third.
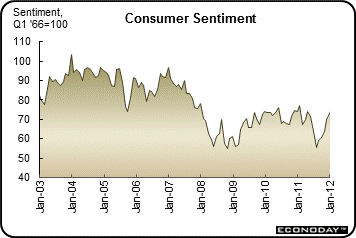 It has been coming off gloomy levels, but the consumer mood has steadily improved since mid-2011. The consumer sentiment index extended its move higher, to 74.0 at mid-month versus 69.9 in December. The index has been moving straight up since the August low of 55.7. It has been coming off gloomy levels, but the consumer mood has steadily improved since mid-2011. The consumer sentiment index extended its move higher, to 74.0 at mid-month versus 69.9 in December. The index has been moving straight up since the August low of 55.7.
Consumers are more upbeat about the current economy and future conditions. Composite components both show solid gains with current conditions up 3 points to 82.6 and expectations up nearly 5 points to 68.4.
 How healthy is the consumer sector' The latest consumer credit outstanding report may be suggesting that consumers are feeling financially healthy enough to take on more debt—although a negative interpretation is possible. How healthy is the consumer sector' The latest consumer credit outstanding report may be suggesting that consumers are feeling financially healthy enough to take on more debt—although a negative interpretation is possible.
Not since 10 years ago, since the aftermath of 9/11 did consumers take on debt like they did in November. Consumer credit jumped a huge $20.4 billion in the month led by non-revolving credit, up $14.8 billion, and including a very large gain for revolving credit, up $5.6 billion. The non-revolving gain largely reflects strength in car sales with the gain on the revolving side reflecting credit card use.
There are no details within the consumer credit report to specifically indicate whether consumers are using credit because they are more confident about jobs and income or because they do not have enough income to cover spending and use credit to fill the gap. Whether the surge is good or bad can only be possibly inferred in the context of other consumer data. On the favorable argument are mostly improved unemployment numbers, somewhat better hiring, and improved consumer confidence. On the negative side is very sluggish real income growth—although some argue that the cash economy has grown significantly since the start of the last recession and that official data may be underestimating income growth. Somewhere in the middle, banks have cut back on access to credit to less creditworthy consumers, so the boost in credit is likely centered in those with at least decent credit and not by consumers with no or restricted credit. Net, the context of the consumer sector indicates that for the most part the surge in credit reflects consumers feeling better about the economy and seeing lower odds of losing a job.
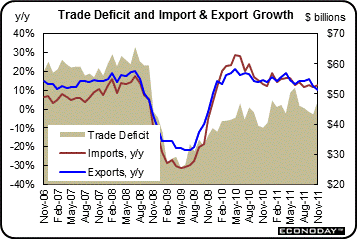 In November, the U.S. trade deficit widened sharply due largely to a jump in oil imports but also due to a dip in exports. The trade gap grew to $47.8 billion from $43.3 billion in October (originally $43.5 billion). The latest shortfall was much more negative than the consensus forecast for $45.0 billion. Exports declined 0.9 percent after dipping 0.7 percent in October. Imports rebounded 1.3 percent in November, following a 1.0 percent decline the prior month. In November, the U.S. trade deficit widened sharply due largely to a jump in oil imports but also due to a dip in exports. The trade gap grew to $47.8 billion from $43.3 billion in October (originally $43.5 billion). The latest shortfall was much more negative than the consensus forecast for $45.0 billion. Exports declined 0.9 percent after dipping 0.7 percent in October. Imports rebounded 1.3 percent in November, following a 1.0 percent decline the prior month.
 The worsening in the trade gap was led by the petroleum gap which expanded to $27.6 billion from $24.2 billion in October. The nonpetroleum goods deficit widened to $34.8 billion from $33.2 billion the month before. Several factors were behind this, including a drop in exports of nonmonetary gold and a boost in automotive imports. The services surplus was slightly improved at $15.4 billion from $15.3 billion in September. The worsening in the trade gap was led by the petroleum gap which expanded to $27.6 billion from $24.2 billion in October. The nonpetroleum goods deficit widened to $34.8 billion from $33.2 billion the month before. Several factors were behind this, including a drop in exports of nonmonetary gold and a boost in automotive imports. The services surplus was slightly improved at $15.4 billion from $15.3 billion in September.
On a not seasonally adjusted basis, the November figures show surpluses, in billions of dollars, in part with Hong Kong $3.2 ($3.0 for October), Australia $1.5 ($2.1), and Singapore $1.0 ($1.0). Deficits were recorded, in billions of dollars, in part with China $26.9 ($28.1), the European Union $9.7 ($8.0), OPEC $9.1 ($8.3), Japan $6.2 ($6.2), Mexico $5.5 ($5.3), Germany $4.7 ($4.3), and Canada $3.0 ($2.2).
The latest international trade report is moderately complex. You cannot attribute the huge worsening to any one fact. Due to special factors, it is very likely that the November number will be partially reversed soon and significantly. Exports of nonmonetary gold have been volatile recently. The surge in oil imports cannot continue at that pace. And the jump in auto imports probably was just American auto companies taking delivery of production in Canadian facilities outside of Detroit. So, economists will be shaving their forecasts for fourth quarter GDP but underlying trends appear to be changed only very slightly with weakness in exports to Europe likely real but not that significant.
 Businesses are keeping a close watch on inventories in response to changes in sales. There is no sign of unwanted inventories creating significant overhang and, in turn, sizeable production cutbacks. Businesses are keeping a close watch on inventories in response to changes in sales. There is no sign of unwanted inventories creating significant overhang and, in turn, sizeable production cutbacks.
Business inventories rose 0.3 percent in November as did business sales, keeping the stock-to-sales ratio unchanged for a fifth straight month at a lean 1.27.
Among components, retail inventories rose 0.3 percent in November in line with a 0.4 percent rise for sales. Component data show a moderate 0.5 percent build in factory inventories and a marginal 0.1 percent build in wholesale inventories.
Overall, inventory build is steady, moderate and in line with growth in final demand. However, it will be interesting to see how inventories stack up in December against that month’s sluggish retail sales. January may be a good month to pick up some good sales!
The latest Beige Book for the upcoming January 24-25 FOMC meeting reported that in general the economy is showing improvement with national economic activity expanding at a “modest to moderate pace.” Overall, this is better than the description of “slow to moderate” improvement cited in the November 30 Beige Book. Seven Districts described growth as modest. Two stated that growth was accelerating (New York and Chicago), two indicated growth is moderate (Dallas and San Francisco), and one described activity as flattened or improved slightly (Richmond). Most Districts highlighted more favorable conditions than identified in reports from the late spring through early fall.
Consumer spending picked up in most Districts, with significant gains in holiday sales. This is somewhat contradictory with the latest Commerce Department numbers, however. Retail inventories are reported to be near desired levels, consistent with retailers' sales expectations. Internet sales for selected items were strong in some Districts. Sales of new automobiles continued to pick up in most Districts.
Overall, the Beige Book shows the economy about where most expected. The recovery is improving but slowly. The report probably does not change the views of FOMC members and earlier individual inclinations to ease or caution likely remain.
The latest economic news was mixed but importantly the consumer is feeling a little more upbeat. Europe is still making Wall Street look over its collective shoulder but traders appear to be giving the U.S. economy greater weight and Europe less.
In this holiday shortened week, manufacturing, housing and inflation are highlighted. Manufacturing begins with the Empire State report on Tuesday followed by industrial production on Wednesday and the Philly Fed, Thursday. The PPI and CPI post on Wednesday and Thursday respectively. The NAHB housing market index (Wednesday) and existing home sales (Friday) wrap up the week.
U.S. Holiday—Martin Luther King, Jr. Holiday. Bond and Equity Markets Closed.
The Empire State manufacturing index in December jumped to 9.53 from November’s 0.61—both topping breakeven of zero. Prior to November, there had been a run of negative numbers through June. The new orders index was up to 5.10 versus minus 2.07 in November with shipments especially strong at 20.87.
Empire State Manufacturing Survey Consensus Forecast for January 12: 10.50
Range: 9.00 to 13.90
The producer price index picked up in November but it was due to food, not energy. Producer prices rebounded 0.3 percent after falling 0.3 percent in October. Energy rose 0.1 percent, following a 1.4 percent drop in October. Leading this increase was a 9.4-percent advance in home heating oil prices. Gasoline actually dipped 0.1 percent. Food cost inflation spiked to a 1.0 percent gain after decelerating to a 0.1 percent rise in October. At the core level, the PPI gained a modest 0.1 percent, following no change in October.
PPI Consensus Forecast for December 11: 0.0 percent
Range: -0.3 to +0.3 percent
PPI ex food & energy Consensus Forecast for December 11: +0.1 percent
Range: 0.0 to +0.2 percent
Industrial production in November declined 0.2 percent after surging 0.7 percent in October. By major components, manufacturing dropped 0.4 percent after gaining 0.5 percent the prior month. For November, utilities output advanced 0.2 percent while mining edged up 0.1 percent. Manufacturing was pulled down largely by a 3.4 percent drop in output for motor vehicles and parts, following a 3.4 percent jump in October. Excluding autos, manufacturing still slipped 0.2 percent, following a 0.3 percent rise the prior month. Overall capacity utilization eased to 77.8 percent from the recovery’s high of 78.0 percent in October.
Industrial production Consensus Forecast for December 11: +0.5 percent
Range: 0.0 to +0.7 percent
Manufacturing production component Consensus Forecast for December 11: +0.5 percent
Range: +0.4 to +0.8 percent
Capacity utilization Consensus Forecast for December 11: 78.1 percent
Range: 77.8 to 80.1 percent
NAHB housing market index rose two points in December to 21 for its best reading since May last year when government efforts were stimulating buying (November revised to 19). And for the first time since mid-2009, the index has posted three consecutive gains. Home builders are reporting more interest from potential buyers, reflected in a big three point jump in the traffic component to 18. This component was at 11 as recently as September.
NAHB housing market index Consensus Forecast for January 12: 21
Range: 21 to 23
The consumer price index in November was unchanged after declining 0.1 percent in October. Excluding food and energy, the CPI increased 0.2 percent after a 0.1 percent advance in October. By major components, energy fell 1.6 percent after declining 2.0 percent in October. Food price inflation increased 0.1 percent after rising 0.1 percent the prior month. Within the core, the indexes for shelter, medical care, apparel, and personal care all rose. On the down side for November, indexes for new vehicles and for used cars and trucks declined.
CPI Consensus Forecast for December 11: +0.1 percent
Range: -0.1 to +0.2 percent
CPI ex food & energy Consensus Forecast for December 11: +0.1 percent
Range: +0.1 to +0.2 percent
Housing starts in November rebounded 9.3 percent after slipping 2.9 percent in October. The November annualized pace of 0.685 million was up 24.3 percent on a year-ago basis. The gain in November was led by a 25.3 percent jump in the multifamily component, following a 15.2 percent decrease in October. The single-family component improved 2.3 percent after a 3.6 percent rise the month before. Housing permits advanced 5.7 percent after jumping 9.3 percent in October. The November rate of 0.681 million units annualized was up 20.7 percent on a year-ago basis.
Housing starts Consensus Forecast for December 11: 0.678 million-unit rate
Range: 0.625 million to 0.722 million-unit rate
Housing permits Consensus Forecast for December 11: 0.680 million-unit rate
Range: 0.665 million to 0.712 million-unit rate
Initial jobless claims in the January 7 week rose a very steep 24,000 to 399,000. The good news was that claims were still under 400,000 for a ninth time in 10 weeks. Continuing claims also rose, up 19,000 in data for the December 31 week to 3.629 million.
Jobless Claims Consensus Forecast for 1/14/12: 383,000
Range: 370,000 to 400,000
The general business conditions index of the Philadelphia Fed's Business Outlook Survey for December rose to 6.8 from November's 3.1 to signal monthly expansion at an accelerating rate. Forward momentum picked up as the new orders index jumped to 10.7 from 3.5 in the prior month. The week prior to this January release, the Philly Fed updated seasonal factors which affected some monthly values, including for the December report. We incorporate the latest numbers here and the forecast sample appears to have incorporated new numbers also.
Philadelphia Fed survey Consensus Forecast for January 12: 10.0
Range: 5.3 to 15.0
Existing home sales in November rose 4.0 percent to 4.42 million units annualized. However, the report incorporated recent annual revisions which sharply lowered five years of existing home sales data including October which was sharply revised to a 4.25 million annual rate from an initial reading of 4.97 million. Details through most of the report were solidly positive. Prices firmed, up 2.1 percent on the median to $164,200, and supply went down, to 7.0 months at the current sales versus 7.6 months in the October report.
Existing home sales Consensus Forecast for December 11: 4.65 million-unit rate
Range: 4.45 to 4.76 million-unit rate
R. Mark Rogers is the author of The Complete Idiot’s Guide to Economic Indicators, Penguin Books, 2009.
Econoday Senior Writer Mark Pender contributed to this article.
|
