|
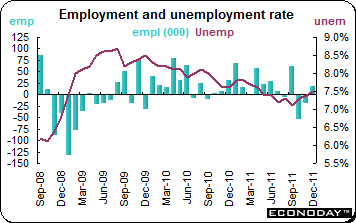
After beginning the year with a strong rally, stocks quickly ate into those gains as investors remembered 2011's woes and realized that they have not gone away. Once again, European banks were in the spotlight as the need to raise capital continues. The euro slithered lower, at one point on Friday trading below the $1.27 mark after favorable U.S. employment data were released. Throughout the week, U.S. economic data were mostly better than expected while those from Europe, worse. For example, while manufacturing purchasing managers’ surveys in Europe indicated contraction, the ISM showed that growth is strengthening. And only German data kept Eurozone unemployment data from swooning even more than it did. In the U.S., the December employment situation report was better than anticipated with employment jumping by 200,000 jobs and the unemployment rate slipping to 8.5 percent from 8.7 percent the month before.
After nearly three years of halting response to Europe’s crisis, the European Central Bank appears now to be making vigorous efforts to prevent the debt problems of Eurozone governments from further damaging the continent’s weakened banking system. A program of low interest loans to commercial banks that the central bank started in December has contributed to that sense of calm. But what calm there is being tested. Milan trading of UniCredit shares, Italy’s biggest bank, was suspended Thursday after the stock lost nearly 25 percent of its value. The stock plunged on concerns that the bank might have trouble raising the billions of euros in new capital that regulators are demanding to insulate it from any deterioration of the European crisis. And with much of Europe seen as heading into regional recession this year, it is not clear whether the ECB can continue to put out all the fires that keep breaking out across the continent.
Most global indexes were up in the first week of the year. The exceptions were the Nikkei, Shanghai Composite and KLCI in the Asia Pacific region, the CAC, FTSE MIB and IBEX 35 in Europe and the Bolsa in the Americas. Losses ranged from 0.7 percent (CAC and Bolsa) to 3.2 percent (IBEX 35). Gains ranged from 0.7 percent (Taiex) to 2.7 percent (Sensex, DAX and Nasdaq).
|
|
2011 |
2012 |
2011 |
% Change |
|
Index |
Dec 30 |
Jan 6 |
Dec 30 |
Week |
Year |
| Asia/Pacific |
|
|
|
|
|
|
| Australia |
All Ordinaries |
4111.0 |
4164.5 |
4111.0 |
1.3% |
1.3% |
| Japan |
Nikkei 225 |
8455.4 |
8390.4 |
8455.4 |
-0.8% |
-0.8% |
| Hong Kong |
Hang Seng |
18434.4 |
18593.1 |
18434.4 |
0.9% |
0.9% |
| S. Korea |
Kospi |
1825.7 |
1843.1 |
1825.7 |
1.0% |
1.0% |
| Singapore |
STI |
2646.4 |
2715.6 |
2646.4 |
2.6% |
2.6% |
| China |
Shanghai Composite |
2199.4 |
2163.4 |
2199.4 |
-1.6% |
-1.6% |
|
|
|
|
|
|
|
| India |
Sensex 30 |
15454.9 |
15867.7 |
15454.9 |
2.7% |
2.7% |
| Indonesia |
Jakarta Composite |
3822.0 |
3869.4 |
3822.0 |
1.2% |
1.2% |
| Malaysia |
KLCI |
1530.7 |
1514.1 |
1530.7 |
-1.1% |
-1.1% |
| Philippines |
PSEi |
4372.0 |
4483.4 |
4372.0 |
2.5% |
2.5% |
| Taiwan |
Taiex |
7072.1 |
7120.5 |
7072.1 |
0.7% |
0.7% |
| Thailand |
SET |
1025.3 |
1036.3 |
1025.3 |
1.1% |
1.1% |
|
|
|
|
|
|
|
| Europe |
|
|
|
|
|
|
| UK |
FTSE 100 |
5572.3 |
5649.7 |
5572.3 |
1.4% |
1.4% |
| France |
CAC |
3159.8 |
3137.4 |
3159.8 |
-0.7% |
-0.7% |
| Germany |
XETRA DAX |
5898.4 |
6057.9 |
5898.4 |
2.7% |
2.7% |
| Italy |
FTSE MIB |
15089.7 |
14645.6 |
15089.7 |
-2.9% |
-2.9% |
| Spain |
IBEX 35 |
8566.3 |
8289.1 |
8566.3 |
-3.2% |
-3.2% |
| Sweden |
OMX Stockholm 30 |
987.9 |
1002.2 |
987.9 |
1.5% |
1.5% |
| Switzerland |
SMI |
5936.2 |
6013.8 |
5936.2 |
1.3% |
1.3% |
|
|
|
|
|
|
|
| North America |
|
|
|
|
|
|
| United States |
Dow |
12217.6 |
12359.9 |
12217.6 |
1.2% |
1.2% |
|
NASDAQ |
2605.2 |
2674.2 |
2605.2 |
2.7% |
2.7% |
|
S&P 500 |
1257.6 |
1277.8 |
1257.6 |
1.6% |
1.6% |
| Canada |
S&P/TSX Comp. |
11955.1 |
12188.6 |
11955.1 |
2.0% |
2.0% |
| Mexico |
Bolsa |
37077.5 |
36804.1 |
37077.5 |
-0.7% |
-0.7% |
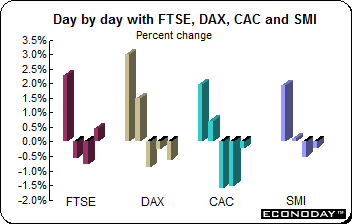 Indexes were mixed in the first week of the New Year as debt worries continued to make investors wary. On the week, the FTSE was up 1.4 percent, the DAX jumped 2.7 percent and the SMI advanced 1.3 percent. However, France’s CAC slipped 0.7 percent while Italy’s MIB and Spain’s IBEX 35 dropped 2.9 percent and 3.2 percent respectively. Indexes were mixed in the first week of the New Year as debt worries continued to make investors wary. On the week, the FTSE was up 1.4 percent, the DAX jumped 2.7 percent and the SMI advanced 1.3 percent. However, France’s CAC slipped 0.7 percent while Italy’s MIB and Spain’s IBEX 35 dropped 2.9 percent and 3.2 percent respectively.
A string of poor economic data — especially on Friday — underpinned a grim economic outlook and added to speculation the European Central Bank will soon act to stimulate the economy. Eurozone consumer and business confidence continued to wilt in December while volatile German factory orders swung to the negative side. For the Eurozone as a whole, retail sales dropped while the unemployment hit a new record high since records for the 17 nations were first compiled in January 1995. On the other hand, some data surprised on the upside in the UK including both the manufacturing and services purchasing mangers’ surveys. However, Halifax house price index continued to show prices declining both on the month and year.
Investors were concerned about the withering situation in Hungary, which is a member of the European Union but not the European Monetary Union. The cost of insuring Hungarian debt against default climbed for the third day in a row over concerns about the country's access to International Monetary Fund financing. There also were worries about a raft of new laws passed, including a constitutional revision. However, Hungary’s Premier Viktor Orban retreated in his confrontation with Andras Simor, governor of the Magyar Nemzeti Bank — Hungary’s central bank — and showed a new willingness to discuss changes to a controversial law curbing the bank's independence that has become a stumbling block to international financial help after a market rout last week. The forint and bonds gained even though the country received its third downgrade to junk.
The International Monetary Fund and the European Union broke off talks last month on Hungary’s bid for a bailout after Orban refused to withdraw a new central bank regulation that may undermine monetary policy independence and Simor’s authority. The forint fell to a record low against the euro Thursday as investors speculated an IMF accord may be delayed. Talks for Hungary’s second bailout in four years broke down following the central bank law that takes away Simor’s right to name deputies, expands the rate setting Monetary Council and adds a new vice president. A separate law makes it possible to demote the central bank president if the institution is combined with the financial regulator.
In Greece, Prime Minister Lucas Papademos warned that the nation faces the prospect of a disorderly default and that it could leave the euro, if negotiations with the so-called troika of the European Commission, the European Central Bank and the International Monetary Fund are not completed by March.
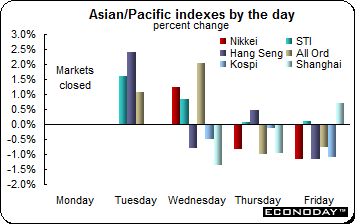 Equity indexes began the holiday shortened week on an exuberant note that quickly faded as the week progressed. Fears that the European debt crisis is deepening outweighed a continuing stream of positive U.S. economic news after French and Italian government borrowing costs increased in recent auctions. Investors here were also concerned about potential sovereign downgrades. The euro continued its swoon putting downward pressure on exporters with large exposure to Europe, especially in Japan. The currency dropped to an 11 year low against the yen. On the week, the Nikkei slipped 0.8 percent while the Shanghai Composite dropped 1.6 percent. The KLCI was down 1.1 percent. Equity indexes began the holiday shortened week on an exuberant note that quickly faded as the week progressed. Fears that the European debt crisis is deepening outweighed a continuing stream of positive U.S. economic news after French and Italian government borrowing costs increased in recent auctions. Investors here were also concerned about potential sovereign downgrades. The euro continued its swoon putting downward pressure on exporters with large exposure to Europe, especially in Japan. The currency dropped to an 11 year low against the yen. On the week, the Nikkei slipped 0.8 percent while the Shanghai Composite dropped 1.6 percent. The KLCI was down 1.1 percent.
After declining the first two days of a holiday shortened week, the Shanghai Composite finally advanced after Beijing raised a threshold for a so-called windfall tax, effectively reducing oil producers' taxes. Banks and resource stocks also climbed after hefty recent losses, although many property developers declined. But those gains in Hong Kong were far outweighed by losses in financial and other shares amid worries over Europe. Speculation gained ground that the Peoples’ Bank of China will cut banks' reserve requirements as early as Friday to accelerate lending to small businesses, hurt by relatively tight liquidity in the real economy.
 The U.S. dollar was up against its major counterparts last week as a combination of better than expected U.S. data combined with a flight to safety. The dollar was unchanged against the Australian dollar and the yen. The U.S. dollar was up against its major counterparts last week as a combination of better than expected U.S. data combined with a flight to safety. The dollar was unchanged against the Australian dollar and the yen.
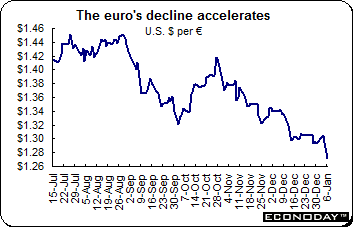
On Friday, the euro hit a 15 month low against the dollar after the positive employment situation report and investors speculated that Europe’s debt crisis is deteriorating. The euro dropped for the fifth consecutive week, its longest losing streak since February 2010. The euro dropped to an 11 year low against the yen.
Along with a slew of negative factors encompassing the Eurozone, the U.S. job market data firmly favored the dollar. The latest data from the European Central Bank suggested banks were hoarding cash rather than lending to each other despite the ECB providing almost half a trillion euros of ultra-cheap three year loans last month. Analysts said further signs of trouble in the banking sector could trigger more weakness in the shared currency.
S&P is reviewing the top ratings of both France and Germany and said last month that the euro area’s rescue fund, the European Financial Stability Facility, may lose its top credit rating should one of its AAA rated guarantors, which include France and Germany, be downgraded.
Selected currencies — weekly results
|
|
2011 |
2011 |
2012 |
% Change |
|
|
Dec 30 |
Dec 30 |
Jan 6 |
Week |
2011 |
| U.S. $ per currency |
|
|
|
|
|
|
| Australia |
A$ |
1.023 |
1.023 |
1.023 |
0.0% |
0.1% |
| New Zealand |
NZ$ |
0.778 |
0.778 |
0.781 |
0.3% |
0.2% |
| Canada |
C$ |
0.982 |
0.982 |
0.974 |
-0.8% |
-2.9% |
| Eurozone |
euro (€) |
1.294 |
1.294 |
1.272 |
-1.7% |
-4.8% |
| UK |
pound sterling (£) |
1.554 |
1.554 |
1.543 |
-0.7% |
-1.1% |
|
|
|
|
|
|
|
| Currency per U.S. $ |
|
|
|
|
|
|
| China |
yuan |
6.295 |
6.295 |
6.310 |
-0.2% |
4.7% |
| Hong Kong |
HK$* |
7.767 |
7.767 |
7.765 |
0.0% |
0.1% |
| India |
rupee |
53.065 |
53.065 |
52.723 |
0.6% |
-15.2% |
| Japan |
yen |
76.975 |
76.975 |
76.998 |
0.0% |
5.5% |
| Malaysia |
ringgit |
3.168 |
3.168 |
3.151 |
0.5% |
-2.8% |
| Singapore |
Singapore $ |
1.297 |
1.297 |
1.294 |
0.3% |
-0.9% |
| South Korea |
won |
1152.450 |
1152.450 |
1162.750 |
-0.9% |
-3.2% |
| Taiwan |
Taiwan $ |
30.279 |
30.279 |
30.233 |
0.2% |
-3.1% |
| Thailand |
baht |
31.580 |
31.580 |
31.680 |
-0.3% |
-5.1% |
| Switzerland |
Swiss franc |
0.939 |
0.939 |
0.955 |
-1.6% |
-2.2% |
| *Pegged to U.S. dollar |
|
|
|
|
|
|
| Source: Bloomberg |
|
|
|
|
|
|
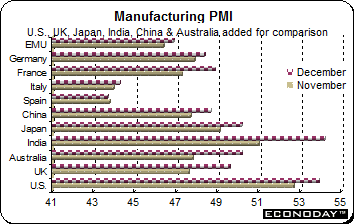 December final manufacturing PMI was unrevised from its flash estimate at 46.9 and continues to signal another decline in manufacturing activity. Although the latest reading was up slightly from November's 28-month low (46.4), the average for the fourth quarter was the weakest since the second quarter of 2009. Output was down for the fifth month in a row and new orders (seventh consecutive drop) were down especially steeply with declines in both the domestic and overseas markets. Moreover, backlogs dropped sharply too. Prices charged fell marginally on the back of weak demand and a further moderation in cost inflation. In Germany, the national PMI crept up a firmer revised 0.5 points but only to a still lowly 48.4. In France the index was up a larger 1.6 points but at 48.9 (a 4-month high), also pointed to another contraction in manufacturing activity. Readings in Italy (44.3 after 44.0) and Spain (43.7 after 43.8) were especially ominous. December final manufacturing PMI was unrevised from its flash estimate at 46.9 and continues to signal another decline in manufacturing activity. Although the latest reading was up slightly from November's 28-month low (46.4), the average for the fourth quarter was the weakest since the second quarter of 2009. Output was down for the fifth month in a row and new orders (seventh consecutive drop) were down especially steeply with declines in both the domestic and overseas markets. Moreover, backlogs dropped sharply too. Prices charged fell marginally on the back of weak demand and a further moderation in cost inflation. In Germany, the national PMI crept up a firmer revised 0.5 points but only to a still lowly 48.4. In France the index was up a larger 1.6 points but at 48.9 (a 4-month high), also pointed to another contraction in manufacturing activity. Readings in Italy (44.3 after 44.0) and Spain (43.7 after 43.8) were especially ominous.
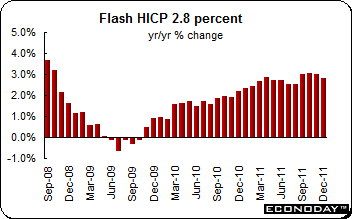 December flash harmonized index of consumer prices was up 2.9 percent on the year, down from the 3.0 percent pace posted in each of the previous three months. As usual Eurostat provided no details behind what was the first easing in inflation since July, but national data suggest that favorable developments in food and, particularly, energy prices had a major impact. However, there have also been some positive signals on underlying developments in keeping with the slowdown in the region's economic momentum. December flash harmonized index of consumer prices was up 2.9 percent on the year, down from the 3.0 percent pace posted in each of the previous three months. As usual Eurostat provided no details behind what was the first easing in inflation since July, but national data suggest that favorable developments in food and, particularly, energy prices had a major impact. However, there have also been some positive signals on underlying developments in keeping with the slowdown in the region's economic momentum.
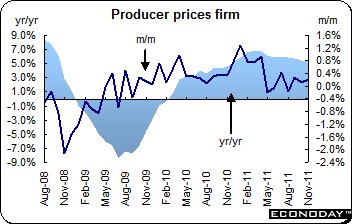 November producer prices (excluding construction) were up 0.2 percent on the month and were 5.3 percent higher on the year. The overall PPI was boosted by energy costs which jumped 0.9 percent from October and without which the headline index would have slipped 0.1 percent on the month and risen 3.0 percent on the year. Capital goods costs were unchanged and intermediates were down 0.4 percent. Consumer goods were something of an exception as durables were up 0.2 percent from October and nondurables were 0.3 percent. November producer prices (excluding construction) were up 0.2 percent on the month and were 5.3 percent higher on the year. The overall PPI was boosted by energy costs which jumped 0.9 percent from October and without which the headline index would have slipped 0.1 percent on the month and risen 3.0 percent on the year. Capital goods costs were unchanged and intermediates were down 0.4 percent. Consumer goods were something of an exception as durables were up 0.2 percent from October and nondurables were 0.3 percent.
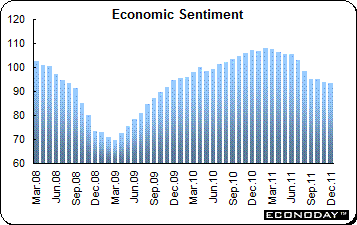 December EU Commission measure of economic sentiment slipped to a reading of 93.3 from 93.8 in November. This extended the monthly slide that began back in March and also constituted a 25-month low. The dip in overall sentiment was largely due to minor declines in morale in the consumer sector (minus 21.1 after minus 20.4), services (minus 2.1 after minus 1.6) and retail (minus 11.7 after minus 11.1). Confidence in construction also edged lower (minus 25.2 after minus 25.0) but industrial morale held steady (minus 7.1). Regionally Italy posted a sizeable decline and sentiment also weakened in Spain. However, France, the Netherlands and Germany all saw limited gains. December EU Commission measure of economic sentiment slipped to a reading of 93.3 from 93.8 in November. This extended the monthly slide that began back in March and also constituted a 25-month low. The dip in overall sentiment was largely due to minor declines in morale in the consumer sector (minus 21.1 after minus 20.4), services (minus 2.1 after minus 1.6) and retail (minus 11.7 after minus 11.1). Confidence in construction also edged lower (minus 25.2 after minus 25.0) but industrial morale held steady (minus 7.1). Regionally Italy posted a sizeable decline and sentiment also weakened in Spain. However, France, the Netherlands and Germany all saw limited gains.
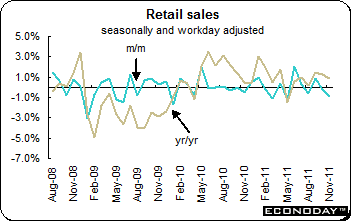
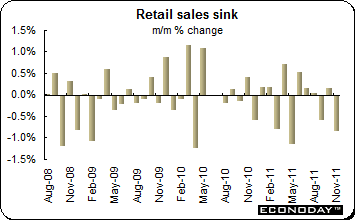 November retail sales dropped 0.8 percent and were down 2.5 percent from a year ago. The decline was almost evenly split between the food, drink & tobacco sector where purchases were off 0.8 percent on the month and the non-food (ex-fuel) category where demand dropped 0.7 percent. Purchases were down on the month in most states in November. Among the larger members, France declined 0.4 percent, Germany 0.9 percent and Spain 0.7 percent and within this group only Germany posted positive annual growth. Of note among the other countries, Portugal registered a worryingly steep 2.6 percent monthly slide, its third fall in as many months. November retail sales dropped 0.8 percent and were down 2.5 percent from a year ago. The decline was almost evenly split between the food, drink & tobacco sector where purchases were off 0.8 percent on the month and the non-food (ex-fuel) category where demand dropped 0.7 percent. Purchases were down on the month in most states in November. Among the larger members, France declined 0.4 percent, Germany 0.9 percent and Spain 0.7 percent and within this group only Germany posted positive annual growth. Of note among the other countries, Portugal registered a worryingly steep 2.6 percent monthly slide, its third fall in as many months.
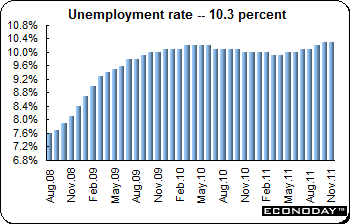 November unemployment across the region was up a further 45,000, boosting the number of people out of work to 16.372 million. However, the unemployment rate held steady at 10.3 percent. Not for the first time, the headline data were flattered by the relative strength of the German labor market which saw its jobless rate edge another tick lower to 5.3 percent as calculated by Eurostat. France (9.8 percent) and Italy (8.6 percent) both saw 0.1 percentage point gains and Spain (22.9 percent) a particularly unwelcome 0.2 percentage point rise. Portugal similarly posted a 0.2 percentage point increase to 13.2 percent. November unemployment across the region was up a further 45,000, boosting the number of people out of work to 16.372 million. However, the unemployment rate held steady at 10.3 percent. Not for the first time, the headline data were flattered by the relative strength of the German labor market which saw its jobless rate edge another tick lower to 5.3 percent as calculated by Eurostat. France (9.8 percent) and Italy (8.6 percent) both saw 0.1 percentage point gains and Spain (22.9 percent) a particularly unwelcome 0.2 percentage point rise. Portugal similarly posted a 0.2 percentage point increase to 13.2 percent.
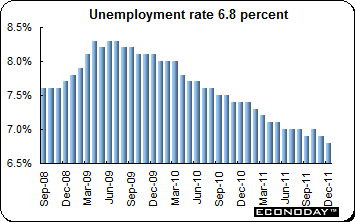 December joblessness declined by 22,000 after a slightly steeper revised 23,000 slide in November. The latest drop was sufficiently large to shave another 0.1 percentage point off the unemployment rate which now stands at a record low of 6.8 percent. Seasonally adjusted the number of people out of work at year-end was 2.888 million. Some warning signals of a possible cooling in market conditions were provided in the vacancies figures which showed an increase of 5,000 or less than half the 11,000 mid-quarter gain. The ILO data showed a surprisingly strong 50,000 increase in employment in November, up from gains of 22,000 in September and 11,000 in October. December joblessness declined by 22,000 after a slightly steeper revised 23,000 slide in November. The latest drop was sufficiently large to shave another 0.1 percentage point off the unemployment rate which now stands at a record low of 6.8 percent. Seasonally adjusted the number of people out of work at year-end was 2.888 million. Some warning signals of a possible cooling in market conditions were provided in the vacancies figures which showed an increase of 5,000 or less than half the 11,000 mid-quarter gain. The ILO data showed a surprisingly strong 50,000 increase in employment in November, up from gains of 22,000 in September and 11,000 in October.
 November retail sales dropped 0.9 percent on the month after slipping a revised 0.2 percent in October. On the year, sales were up 0.8 percent. November saw the steepest slide in volumes since May. The limited breakdown of the data showed that the main areas of weakness in terms of annual growth were clothing & shoes (down 0.3 percent) and the other goods category (also down 0.3 percent). By contrast, mail order was up 5.2 percent and furniture & household goods 2.5 percent. Total food, drink & tobacco sales were 0.4 percent higher than in November 2010 while non-food was up 1.8 percent. November retail sales dropped 0.9 percent on the month after slipping a revised 0.2 percent in October. On the year, sales were up 0.8 percent. November saw the steepest slide in volumes since May. The limited breakdown of the data showed that the main areas of weakness in terms of annual growth were clothing & shoes (down 0.3 percent) and the other goods category (also down 0.3 percent). By contrast, mail order was up 5.2 percent and furniture & household goods 2.5 percent. Total food, drink & tobacco sales were 0.4 percent higher than in November 2010 while non-food was up 1.8 percent.
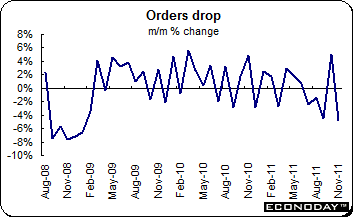 November manufacturing orders dropped 4.8 percent on the month after increasing by a revised 5.0 percent in October. Undermined by a strong rise in the year ago period, the decline left workday adjusted orders down 4.3 percent on the year in sharp contrast to the solid 5.4 percent annual rise reported last time. The drop in orders reflected weakness in all areas, notably capital goods which slumped 6.5 percent on the month. Basics were off 2.9 percent and consumer & durables goods down 2.0 percent. Domestic orders were down 1.1 percent while overseas demand contracted 7.8 percent. Within the former, consumer & durables were down 3.4 percent on the month and basics 2.5 percent weaker but a 0.6 percent increase in capital goods provided at least a partial offset. The collapse in foreign orders was led by the non-EMU area (down 10.3 percent) although demand from other Eurozone countries (down 4.1 percent) was nothing to write home about. Both markets saw declines in all the major product areas with the most marked decline in non-Eurozone capital goods (13.1 percent). November manufacturing orders dropped 4.8 percent on the month after increasing by a revised 5.0 percent in October. Undermined by a strong rise in the year ago period, the decline left workday adjusted orders down 4.3 percent on the year in sharp contrast to the solid 5.4 percent annual rise reported last time. The drop in orders reflected weakness in all areas, notably capital goods which slumped 6.5 percent on the month. Basics were off 2.9 percent and consumer & durables goods down 2.0 percent. Domestic orders were down 1.1 percent while overseas demand contracted 7.8 percent. Within the former, consumer & durables were down 3.4 percent on the month and basics 2.5 percent weaker but a 0.6 percent increase in capital goods provided at least a partial offset. The collapse in foreign orders was led by the non-EMU area (down 10.3 percent) although demand from other Eurozone countries (down 4.1 percent) was nothing to write home about. Both markets saw declines in all the major product areas with the most marked decline in non-Eurozone capital goods (13.1 percent).
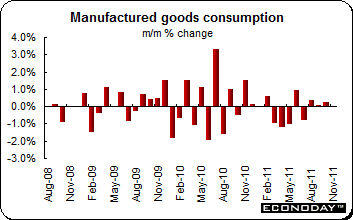 November household purchases of manufactured goods were unchanged on the month following an unrevised 0.3 percent increase in October. On the year, purchases were down 1.8 percent after declining just 0.2 percent in October. Purchases were held in check by a 2.1 percent monthly drop in textiles which, combined with a 0.5 percent decline in household goods and a 0.5 percent slide in the other products category, offset a strong gain in autos (3.2 percent). Total consumption edged 0.1 percent down from its October level following a marginally steeper revised 0.2 percent contraction at the start of the quarter. However, thanks to a solid 0.6 percent increase in September, average sales in October/November were still 0.2 percent above their third quarter mean. November household purchases of manufactured goods were unchanged on the month following an unrevised 0.3 percent increase in October. On the year, purchases were down 1.8 percent after declining just 0.2 percent in October. Purchases were held in check by a 2.1 percent monthly drop in textiles which, combined with a 0.5 percent decline in household goods and a 0.5 percent slide in the other products category, offset a strong gain in autos (3.2 percent). Total consumption edged 0.1 percent down from its October level following a marginally steeper revised 0.2 percent contraction at the start of the quarter. However, thanks to a solid 0.6 percent increase in September, average sales in October/November were still 0.2 percent above their third quarter mean.
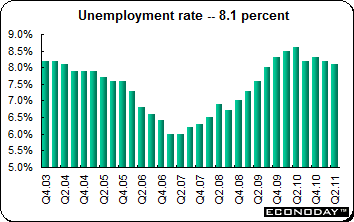 Third quarter joblessness held steady at 8.1 percent from the second quarter rate. The steady outcome reflected an unchanged 7.2 percent unemployment rate among male workers and a 0.1 percentage point uptick to 9.4 percent among female workers. However, the monthly data showed the jobless rate climbing another notch on the month and 0.4 percentage points on the year to 8.6 percent in November. This suggests that the quarterly figures will also deteriorate in the period just ended. Third quarter joblessness held steady at 8.1 percent from the second quarter rate. The steady outcome reflected an unchanged 7.2 percent unemployment rate among male workers and a 0.1 percentage point uptick to 9.4 percent among female workers. However, the monthly data showed the jobless rate climbing another notch on the month and 0.4 percentage points on the year to 8.6 percent in November. This suggests that the quarterly figures will also deteriorate in the period just ended.
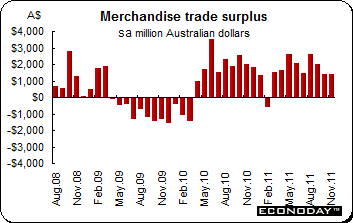 November merchandise trade surplus was A$1.38 billion, down from October’s A$1.42 billion surplus. Exports edged up 0.2 percent on the month and were 11.2 percent higher from a year ago. Imports were up 0.4 percent and 14.9 percent. Exports of non-monetary gold jumped 32 percent while rural goods shipments edged up 1.0 percent. Non-rural exports were down 1.0 percent. Services were down 2.0 percent. Imports of capital goods were up 6.0 percent while imports of intermediate and other merchandise and consumption goods edged lower. Service inched up 1.0 percent. November merchandise trade surplus was A$1.38 billion, down from October’s A$1.42 billion surplus. Exports edged up 0.2 percent on the month and were 11.2 percent higher from a year ago. Imports were up 0.4 percent and 14.9 percent. Exports of non-monetary gold jumped 32 percent while rural goods shipments edged up 1.0 percent. Non-rural exports were down 1.0 percent. Services were down 2.0 percent. Imports of capital goods were up 6.0 percent while imports of intermediate and other merchandise and consumption goods edged lower. Service inched up 1.0 percent.
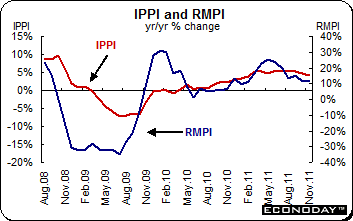 November industrial product price index was up 0.2 percent and was 4.2 percent higher on the year. The monthly gain, which followed an unrevised 0.1 percent decline in October, was largely due to petroleum and coal where costs were up a relatively sharp 1.1 percent. Excluding this sub-sector, the headline index would have risen a slightly more modest 0.1 percent from October for a 12-month growth rate of 2.1 percent. Most other categories saw only minor monthly changes in prices although miscellaneous non-manufactures (0.8 percent) and miscellaneous manufactures (0.7 percent) were both on the high side. The auto area (0.3 percent) also provided a small boost as did the Canadian dollar. Without exchange rate effects the IPPI would have been flat from October. Raw material and fuel costs jumped a hefty 3.8 percent on the month to boost the annual increase in the RMPI to 11.7 percent. The monthly surge was dominated by an 8.2 percent leap in the cost of mineral fuels without which the index would have fallen 0.3 percent from October and risen 4.1 percent from a year ago. The only other monthly advance of any size was in non-ferrous metals (0.9 percent). Declines in prices were recorded by both ferrous materials (1.9 percent) and vegetable products (2.5 percent). November industrial product price index was up 0.2 percent and was 4.2 percent higher on the year. The monthly gain, which followed an unrevised 0.1 percent decline in October, was largely due to petroleum and coal where costs were up a relatively sharp 1.1 percent. Excluding this sub-sector, the headline index would have risen a slightly more modest 0.1 percent from October for a 12-month growth rate of 2.1 percent. Most other categories saw only minor monthly changes in prices although miscellaneous non-manufactures (0.8 percent) and miscellaneous manufactures (0.7 percent) were both on the high side. The auto area (0.3 percent) also provided a small boost as did the Canadian dollar. Without exchange rate effects the IPPI would have been flat from October. Raw material and fuel costs jumped a hefty 3.8 percent on the month to boost the annual increase in the RMPI to 11.7 percent. The monthly surge was dominated by an 8.2 percent leap in the cost of mineral fuels without which the index would have fallen 0.3 percent from October and risen 4.1 percent from a year ago. The only other monthly advance of any size was in non-ferrous metals (0.9 percent). Declines in prices were recorded by both ferrous materials (1.9 percent) and vegetable products (2.5 percent).
 December employment was up by 17,500 after declining in the previous two months. However, the unemployment rate edged up to 7.5 percent from 7.4 percent in November. The modest improvement in headcount was wholly attributable to part time jobs which were up by 43,100. Full time positions declined a disappointingly large 43,100. Private sector payrolls grew 3,800 but the bulk of the overall increase in employment was due to a 31,100 advance in the number of self-employed. The public sector shed a net 17,300 workers. The goods producing sector employment was up 18,500. Within this, manufacturing was 30,400 higher and found support from both agriculture (5,700) and natural resources (2,400). However, construction (down 12,800) and utilities (down 7,200) both had a negative impact. Services struggled, registering a 900 decline on the month as a 16,100 increase in professional, scientific & technical providers and 5,000 plus gains in both trade and information, culture & recreation were essentially wiped out by declines in finance, insurance, real estate & leasing (14,500) and health care & social assistance (7,900). Other categories saw just small changes on the month. December employment was up by 17,500 after declining in the previous two months. However, the unemployment rate edged up to 7.5 percent from 7.4 percent in November. The modest improvement in headcount was wholly attributable to part time jobs which were up by 43,100. Full time positions declined a disappointingly large 43,100. Private sector payrolls grew 3,800 but the bulk of the overall increase in employment was due to a 31,100 advance in the number of self-employed. The public sector shed a net 17,300 workers. The goods producing sector employment was up 18,500. Within this, manufacturing was 30,400 higher and found support from both agriculture (5,700) and natural resources (2,400). However, construction (down 12,800) and utilities (down 7,200) both had a negative impact. Services struggled, registering a 900 decline on the month as a 16,100 increase in professional, scientific & technical providers and 5,000 plus gains in both trade and information, culture & recreation were essentially wiped out by declines in finance, insurance, real estate & leasing (14,500) and health care & social assistance (7,900). Other categories saw just small changes on the month.
The New Year began pretty much where the old one ended — investors looking for protection from the sovereign debt crisis. In Europe, new economic data pointed to probable recessions in many of the euro area’s member states while in the U.S., data pointed to an improving economy.
Next week brings the monthly meetings of the Bank of England and the European Central Bank. Both are expected to maintain current policy. Industrial production and merchandise trade data dominate the calendars in Europe and the UK. China releases monthly data for producer and consumer prices and its merchandise trade balance.
| Central Bank activities |
|
| January 11, 12 |
UK |
Bank of England Monetary Policy Announcement |
| January 11 |
United States |
Federal Reserve Beige Book |
| January 12 |
Eurozone |
European Central Bank Announcement |
|
|
|
| The following indicators will be released this week... |
| Europe |
|
|
| January 9 |
Germany |
Industrial Production (November) |
|
|
Retail Sales (November) |
|
|
Merchandise Trade (November) |
|
France |
Merchandise Trade (November) |
| January 10 |
France |
Industrial Production (November) |
| January 11 |
Eurozone |
Gross Domestic Product (Q3.2011 final) |
|
UK |
Merchandise Trade (November) |
| January 12 |
Eurozone |
Industrial Production (November) |
|
Italy |
Industrial Production (November) |
|
UK |
Industrial Production (November) |
| January 13 |
Eurozone |
Merchandise Trade (November) |
|
UK |
Producer Price Index (December) |
|
|
|
| Asia/Pacific |
|
|
| January 9 |
Australia |
Retail Sales (November) |
| January 10 |
Australia |
Merchandise Trade (November) |
|
|
|
| Americas |
|
|
| January 13 |
Canada |
International Trade Balance (November) |
Anne D Picker is the author of International Economic Indicators and Central Banks.
|
