|
Simply Economics will be taking next week off
Simply Economics will return on Friday, December 30, 2011
Merry Christmas and Happy Holidays
from all of us at Econoday!
Not every economic report was positive but the overall picture is that the U.S. economy is growing at a moderately positive rate. The recovery continues to gain traction. While Europe continued to weigh on equities this past week, favorable U.S. news limited the damage and led some to think that there are upside risks for the U.S.
 Sentiment was negative the first three days of trading for the past week. Stocks dropped Monday after Moody’s Investors Service and Fitch Ratings issued new warnings. They said that European leaders have failed to take the coordinated action necessary to tackle the region's debt crisis. The warnings come on worries that the previous Friday’s European summit deal is insufficient. Stocks treaded water Tuesday until the Fed’s policy announcement in the afternoon. Shares declined after the Fed left its policy rates unchanged and took no immediate actions to bolster the economy. Some had expected the Fed to expand on its communication policy. Also weighing on stocks were comments by German Chancellor Angela Merkel rejecting the idea of increasing Europe's bailout fund. Sentiment was negative the first three days of trading for the past week. Stocks dropped Monday after Moody’s Investors Service and Fitch Ratings issued new warnings. They said that European leaders have failed to take the coordinated action necessary to tackle the region's debt crisis. The warnings come on worries that the previous Friday’s European summit deal is insufficient. Stocks treaded water Tuesday until the Fed’s policy announcement in the afternoon. Shares declined after the Fed left its policy rates unchanged and took no immediate actions to bolster the economy. Some had expected the Fed to expand on its communication policy. Also weighing on stocks were comments by German Chancellor Angela Merkel rejecting the idea of increasing Europe's bailout fund.
At mid-week, fears about European debt pushed stocks down as rates on Italian bonds rose, boosting the odds of fiscal difficulties, including the ability for that country to afford its debt. A stronger dollar bumped down commodities prices and related stocks.
Equities generally made a partial comeback the last two days of trading. Economic news won out with a score of 3 to 1. Initial jobless claims unexpectedly fell sharply, Empire State topped expectations for December, and Philly Fed jumped for the same month. However, national industrial production for November declined modestly.
Stocks were mostly up Friday despite headwinds. After markets closed Thursday, Fitch downgraded several global banks, including Bank of America and Goldman Sachs. Fitch cited “increased challenges the financial markets face,” including a rocky economy and regulatory risk. Also after Thursday close, Research In Motion said its fiscal third quarter earnings dropped sharply. Stocks started Friday with notable gains with support from news that Congress was enacting another temporary boost to the federal debt ceiling. But the gains unwound in part on concern about Europe as Fitch Ratings lowered France’s rating outlook to negative and put Belgium, Spain, Slovenia, Italy, Ireland and Cyprus on review for a downgrade. Fitch cited the reason as Europe’s failure to find a “comprehensive solution” to the debt crisis. Friday also marked "quadruple witching," when four types of contracts expire—those tied to market index futures, market index options, stock options and stock futures. However, many traders take positions on Thursday for these expirations.
Equities were down this past week. The Dow was down 2.6percent; the S&P 500, down 2.8 percent; the Nasdaq, down 3.5 percent; and the Russell 2000, down 3.1 percent.
For the year-to-date, major indexes are mostly down as follows: the S&P 500, down 3.0 percent; the Nasdaq, down 3.7 percent; and the Russell 2000, down 7.9 percent. However, the Dow is up 2.5 percent.
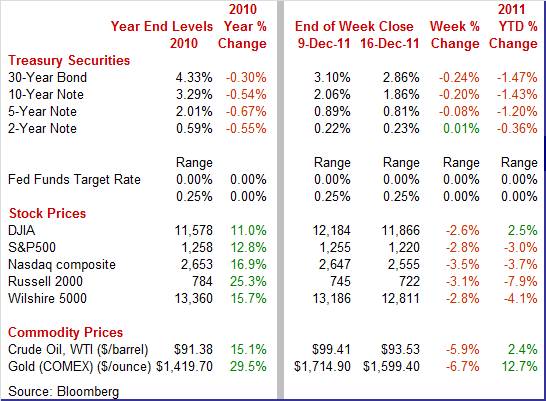
Weekly percent change column reflects percent changes for all components except interest rates. Interest rate changes are reflected in simple differences.
 Treasury yields mostly dropped sharply this past week. Rates dipped four of the week’s trading days, marginally pausing Thursday. Basically, throughout the week, Treasury prices benefitted from flight to safety over concern about European sovereign debt. Monday started with investors seeking refuge after Moody’s said it will review ratings for all European Union countries because the prior Friday’s summit failed to produce “decisive” measures to end the two-year-old crisis. Rates generally eased Tuesday after the Fed left policy unchanged but cited downside risks to the economy from “strains in global financial markets.” European concerns weighed on rates Wednesday also. Treasury yields mostly dropped sharply this past week. Rates dipped four of the week’s trading days, marginally pausing Thursday. Basically, throughout the week, Treasury prices benefitted from flight to safety over concern about European sovereign debt. Monday started with investors seeking refuge after Moody’s said it will review ratings for all European Union countries because the prior Friday’s summit failed to produce “decisive” measures to end the two-year-old crisis. Rates generally eased Tuesday after the Fed left policy unchanged but cited downside risks to the economy from “strains in global financial markets.” European concerns weighed on rates Wednesday also.
Favorable economic news on Thursday led to a pause in the decline in Treasury rates as jobless claims fell sharply and the Empire State and Philly Fed reports topped expectations. Rates resumed their decline on Friday on negative news on ratings for Europe. Fitch Ratings lowered France’s rating outlook and put the grades of other European nations on review for a downgrade.
For this past week Treasury rates were mostly down as follows: 3-month T-bill, down 1 basis point; the 5-year note, down 8 basis points; the 7-year note, down 16 basis points; the 10-year note, down 20 basis points; and the 30-year bond, down 24 basis points. The 2-year note edged up 1 basis point.
 The spot price of crude dropped sharply this past week with concerns about growth in Europe being the primary factor. At the start of the week, sluggish growth in Chinese exports also added to the downtrend in crude prices. Tuesday saw an interruption in the weekly downtrend, however, on news that Iran planned to hold drills for practicing closing the Strait of Hormuz. The biggest downward move was Wednesday after OPEC decided on an output target of 30 million barrels a day at its meeting in Vienna. Crude fell more than $4-1/2 per barrel for the day. Throughout the week, a strengthening dollar also added to downward pressure on the price of crude. The spot price of crude dropped sharply this past week with concerns about growth in Europe being the primary factor. At the start of the week, sluggish growth in Chinese exports also added to the downtrend in crude prices. Tuesday saw an interruption in the weekly downtrend, however, on news that Iran planned to hold drills for practicing closing the Strait of Hormuz. The biggest downward move was Wednesday after OPEC decided on an output target of 30 million barrels a day at its meeting in Vienna. Crude fell more than $4-1/2 per barrel for the day. Throughout the week, a strengthening dollar also added to downward pressure on the price of crude.
Net for the week, the spot price for West Texas Intermediate dropped a sharp $5.88 per barrel to settle at $93.53.
Economic news was mostly positive this past week with favorable data for the consumer sector, mixed news on manufacturing, and mixed inflation news. But on the margin, manufacturing and inflation news was favorable.
 Retail sales in November advanced but not as strongly as expected. However, October and September were revised up and weakness in November was largely in components that had surged earlier. Overall retail sales in November grew 0.2 percent, following a 0.6 percent boost in October (originally up 0.5 percent) and a 1.3 percent spike in September (previously up 1.1 percent). Retail sales in November advanced but not as strongly as expected. However, October and September were revised up and weakness in November was largely in components that had surged earlier. Overall retail sales in November grew 0.2 percent, following a 0.6 percent boost in October (originally up 0.5 percent) and a 1.3 percent spike in September (previously up 1.1 percent).
 Excluding autos, retail sales gained 0.2 percent in November after increasing 0.6 percent in October (unrevised) and increasing 0.6 percent in September (previously up 0.5 percent). Gasoline sales declined marginally in November. Sales excluding autos and gasoline in November rose 0.2 percent, following a healthy 0.7 percent increase in October. Excluding autos, retail sales gained 0.2 percent in November after increasing 0.6 percent in October (unrevised) and increasing 0.6 percent in September (previously up 0.5 percent). Gasoline sales declined marginally in November. Sales excluding autos and gasoline in November rose 0.2 percent, following a healthy 0.7 percent increase in October.
Within the core (excluding autos and gasoline), gains were mixed but mostly positive. Overall components were largely favorable. Once again, the strongest component was for electronics & appliance stores. Also seeing gains were nonstore retailers, furniture & home furnishing, clothing & accessory stores, sporting goods & hobby, and general merchandise.
The largest decline was for miscellaneous store retailers, down 1.2 percent. Modest decreases also were seen in building materials & garden equipment, food & beverage, health & personal care, gasoline stations, and food services & drinking places.
The headline numbers for November retail sales were disappointing but upward revisions were partially offsetting. The trend still appears to be moderately healthy spending gains, taking into account earlier robust increases.
 Industrial product dipped in November but hopefully with the uptrend still intact. November's weakness was largely on a decline in auto assemblies. Industrial production declined 0.2 percent after surging 0.7 percent in October. By major components, manufacturing dropped 0.4 percent after gaining 0.5 percent the prior month. For November, utilities output advanced 0.2 percent while mining edged up 0.1 percent. Industrial product dipped in November but hopefully with the uptrend still intact. November's weakness was largely on a decline in auto assemblies. Industrial production declined 0.2 percent after surging 0.7 percent in October. By major components, manufacturing dropped 0.4 percent after gaining 0.5 percent the prior month. For November, utilities output advanced 0.2 percent while mining edged up 0.1 percent.
 Manufacturing was pulled down largely by a 3.4 percent drop in output for motor vehicles and parts, following a 3.4 percent jump in October. Excluding autos, manufacturing still slipped 0.2 percent, following a 0.3 percent rise the prior month. Manufacturing was pulled down largely by a 3.4 percent drop in output for motor vehicles and parts, following a 3.4 percent jump in October. Excluding autos, manufacturing still slipped 0.2 percent, following a 0.3 percent rise the prior month.
On a seasonally adjusted year-on-year basis, overall industrial production was up 3.7 percent in November, compared to 4.3 percent the month before.
Overall capacity utilization eased to 77.8 percent from the recovery’s high of 78.0 percent in October. Analysts had called for 77.8 percent for November.
Although November’s manufacturing number is disappointing, it may be temporary. Given continued healthy sales, auto production is likely to rebound. Also, recent regional indexes were improved in December for both Empire State manufacturing and Philly Fed.
 Both the New York Fed’s and Philly Fed’s manufacturing surveys show strengthening in December. The Empire State index in December jumped to 9.53 from November’s 0.61—both topping breakeven of zero. Prior to November, there had been a run of negative numbers through June. Both the New York Fed’s and Philly Fed’s manufacturing surveys show strengthening in December. The Empire State index in December jumped to 9.53 from November’s 0.61—both topping breakeven of zero. Prior to November, there had been a run of negative numbers through June.
The new orders index was up to 5.10 versus minus 2.07 in November with shipments especially strong at 20.87. Manufacturers in the region added to their workforces in the month with the employment index at 2.33 compared to minus 3.66 in the prior month.
Manufacturers are more optimistic for the coming months as the six-month outlook for general business conditions really picked up--to 52.33 versus 39.02 in November and 6.74 in October.
The mid-Atlantic region also is regaining momentum as the Philly Fed's general activity index rose to 10.3 from November's 3.6 to signal monthly expansion at an accelerating rate. Forward momentum picked up as the new orders index jumped to 9.7 from 1.3 in the prior month. In a special positive for the Philly Fed report, backlog orders rose to 7.2 versus a long trend of contraction. Data on the six-month outlook indicate building optimism.
An interesting angle to the regional numbers is that they recently have been underperforming relative to national manufacturing readings. If that recent pattern holds true for December, then the month may be more favorable than suggested at face value by the Empire State and Philly Fed headline numbers.
 It looks like the Fed is getting its wish for easing inflation with lower energy costs coming into play—at least for now. The consumer price index in November was unchanged after declining 0.1 percent in October. November’s number posted. Excluding food and energy, the CPI increased 0.2 percent after a 0.1 percent advance in October. Analysts projected a 0.1 percent rise. It looks like the Fed is getting its wish for easing inflation with lower energy costs coming into play—at least for now. The consumer price index in November was unchanged after declining 0.1 percent in October. November’s number posted. Excluding food and energy, the CPI increased 0.2 percent after a 0.1 percent advance in October. Analysts projected a 0.1 percent rise.
By major components, energy fell 1.6 percent after declining 2.0 percent in October. Gasoline fell 2.4 percent, following a 3.1 percent drop in October. Food price inflation increased 0.1 percent after rising 0.1 percent the prior month.
Within the core, the indexes for shelter, medical care, apparel, and personal care all rose. Upward pressure primarily came from a 0.6 percent jump in apparel prices, following a 0.4 percent increase in October. Apparel price inflation is somewhat volatile due to less predictable discounting by merchants. Shelter costs rose 0.2 percent in each of the latest two months. Medical care cost inflation remains well above overall inflation, jumping 0.4 percent in November after a 0.5 percent increase the month before.
On the down side for November, indexes for new vehicles and for used cars and trucks declined 0.3 percent and 0.1 percent, respectively.
 Year-on-year, overall CPI inflation decelerated to 3.4 percent from 3.6 percent in October (seasonally adjusted). The core rate firmed to 2.2 percent from 2.1 percent the month before on a year-ago basis. Year-on-year, overall CPI inflation decelerated to 3.4 percent from 3.6 percent in October (seasonally adjusted). The core rate firmed to 2.2 percent from 2.1 percent the month before on a year-ago basis.
Despite the firming in the core rate, the overall picture for consumer price inflation is favorable for the Fed to continue to expect within or below target inflation in coming quarters.
On a separate note on consumer demand, the strong price data for apparel hint that either sales are healthy or that apparel inventories are somewhat tight. Either situation is likely a positive for apparel merchants after negative inflation numbers in August and September.
 Producer price inflation picked up in November but it was due to food, not energy. Producer prices rebounded 0.3 percent after falling 0.3 percent in October. Producer price inflation picked up in November but it was due to food, not energy. Producer prices rebounded 0.3 percent after falling 0.3 percent in October.
Turning to major components, energy rose 0.1 percent, following a 1.4 percent drop in October. Leading this increase was a 9.4-percent advance in home heating oil prices. Gasoline actually dipped 0.1 percent, following a 2.4 percent decrease in October. Food cost inflation spiked to a 10 percent gain after decelerating to a 0.1 percent rise in October. Over half of the November advance can be attributed to the index for fresh and dry vegetables, which rose 11.5 percent.
 At the core level, the PPI gained a modest 0.1 percent, following no change in October. For the core, upside pressure came from passenger cars (0.6 percent) and pharmaceuticals (up 0.9 percent) with a decline in prices for light trucks (down 0.2 percent) softening the overall core. At the core level, the PPI gained a modest 0.1 percent, following no change in October. For the core, upside pressure came from passenger cars (0.6 percent) and pharmaceuticals (up 0.9 percent) with a decline in prices for light trucks (down 0.2 percent) softening the overall core.
For the overall PPI, the year-ago rate in November was 5.9 percent versus October’s 6.1 percent (seasonally adjusted). The core rate in November firmed to 2.9 percent from 2.8 percent in October.
 For once in some time, the Fed statement was almost entirely as expected with policy steady. The only disappointment for markets, however, was that the Fed did not include any comments about whether the Fed was thinking about changes in its communications strategy. For once in some time, the Fed statement was almost entirely as expected with policy steady. The only disappointment for markets, however, was that the Fed did not include any comments about whether the Fed was thinking about changes in its communications strategy.
The Fed retained the current policy rate range of 0.0 to 0.25 percent and kept language saying the policy rate will remain exceptionally low likely through mid-2013. However, Chicago Fed President Charles Evans dissented leaving the vote 9 to 1. The statement said Evans "supported additional policy accommodation at this time."
The Fed noted that "the economy has been expanding moderately, notwithstanding some apparent slowing in global growth." However, the Fed justified its continued very loose policy by stating that the unemployment rate remains elevated despite some improvement in labor markets. Economic growth is too slow, downside risks remain from Europe, and inflation is expected to settle at acceptable rates.
"The Committee continues to expect a moderate pace of economic growth over coming quarters and consequently anticipates that the unemployment rate will decline only gradually toward levels that the Committee judges to be consistent with its dual mandate. Strains in global financial markets continue to pose significant downside risks to the economic outlook. The Committee also anticipates that inflation will settle, over coming quarters, at levels at or below those consistent with the Committee's dual mandate."
Regarding the economy, the Fed sees continued gains in household spending but noted that "business fixed investment appears to be increasing less rapidly and the housing sector remains depressed."
On other policy issues, the Fed is continuing to reinvest principal payments from its holdings of agency debt and agency mortgage-backed securities in agency mortgage-backed securities and also is rolling over maturing Treasury securities at auction.
The Fed did not include further detail about possible changes or additions in the form of guidance the Fed uses in the meeting statement.
Overall, the economy is about where the Fed expected in recent weeks along with most economists. Currently, the Fed is going through a greater diversity of debate about the direction of policy as inflation hawks remain (though some rotate off voting status in 2013) but at least one dove is more vocal. However, Evans will not be a voting member in 2012.
Turning to more recent policy moves, the latest weekly data on the Fed’s balance sheet (out each Thursday afternoon) indicate that the Fed has provided a huge amount of liquidity to Europe to stabilize financial markets. And Operation Twist is focusing on mortgage-backed securities. For the December 14 week, the Fed's balance sheet spiked a massive $81.8 billion after expanding $6.4 billion the week before. The surge in the latest week was led by a $52.0 billion increase in central bank liquidity swaps. These swaps provide dollars to European central banks but at no risk to the Fed since the borrowing central bank agrees to return the money at the same exchange rate as the initial loan.
 Also for the Fed’s latest balance sheet report, mortgage-backed securities gained a huge $31.0 billion and "other assets" (largely those denominated in foreign currencies) rose $3.9 billion. Holdings of Treasuries slipped $1.5 billion. Total assets for the December 14 week increased to $2.905 trillion. The latest number is a record high for the Fed’s balance sheet. So, a slightly technical question that markets have not noticed is the Fed now in QE3' Based on the balance sheet expansion, the answer is yes. QE3—or whatever the policy name—is helping Europe and indirectly helping the U.S. by stabilizing financial markets. Also for the Fed’s latest balance sheet report, mortgage-backed securities gained a huge $31.0 billion and "other assets" (largely those denominated in foreign currencies) rose $3.9 billion. Holdings of Treasuries slipped $1.5 billion. Total assets for the December 14 week increased to $2.905 trillion. The latest number is a record high for the Fed’s balance sheet. So, a slightly technical question that markets have not noticed is the Fed now in QE3' Based on the balance sheet expansion, the answer is yes. QE3—or whatever the policy name—is helping Europe and indirectly helping the U.S. by stabilizing financial markets.
The recovery in the U.S. continues to gain traction and financial markets clearly look more attractive in the U.S. than in Europe.
The week is jam packed with economic news as the holiday schedule moved some releases forward to this week. Housing is a major focus beginning with starts (Tuesday), existing home sales (Wednesday), FHFA home prices (Thursday) and new home sales (Friday). GDP and personal income post on Thursday and Friday respectively. Durable goods orders Friday will wrap up the week.
Housing starts in October unexpectedly held up instead of retreating after a strong gain the month before. Housing starts in October nudged back only 0.3 percent, after rebounding a sharp 7.7 percent the prior month. The October annualized pace of 0.628 million units was up 16.5 percent on a year-ago basis. The dip in October was led by an 8.3 percent decline in the multifamily component, following a 35.0 percent spike in September. The single-family component rebounded 3.9 percent after a 2.6 percent decrease the month before. Housing permits jumped 10.9 percent after declining 5.8 percent in September. But the optimism was mainly for multifamily construction.
Housing starts Consensus Forecast for November 11: 0.636 million-unit rate
Range: 0.600 million to 0.650 million-unit rate
Housing permits Consensus Forecast for November 11: 0.645 million-unit rate
Range: 0.610 million to 0.679 million-unit rate
Existing home sales rose 1.4 percent in October to a 4.97 million annual rate. At $162,500, the median price was down 2.0 percent on the month for a year-on-year decrease of 4.7 percent.
Supply fell 2.2 percent in the month to 3.33 million units on the market. When measured against the current sales rate, supply is down to 8.0 months from 8.3 months in September and well down from 10.6 months in October last year.
Existing home sales Consensus Forecast for November 11: 5.08 million-unit rate
Range: 4.38 to 5.19 million-unit rate
GDP in the Commerce Department's second estimate for third quarter growth was bumped down to an increase of 2.0 percent annualized, compared to the initial estimate of 2.5 percent and to second quarter growth of 1.3 percent. The downward revision primarily was largely due to a downward revision to inventory investment-from plus $5.4 billion initially to minus $8.5 billion. This revision is the equivalent of a 0.43 percentage point lower contribution to GDP growth. Final sales of domestic product were unrevised from the initial estimate of 3.6 percent. Final sales to domestic purchasers were down to 3.0 percent from the original estimate of 3.2 percent annualized. Economy-wide inflation was unrevised at 2.5 percent and compares to the second quarter rise of 2.5 percent.
Real GDP Consensus Forecast for third estimate Q3 11: +2.0 percent annual rate
Range: +1.5 to +2.3 percent annual rate
GDP price index Consensus Forecast for third estimate Q3 11: +2.5 percent annual rate
Range: +2.5 to +2.5 percent annual rate
Initial jobless claims for the December 10 week dropped and unexpected and sharp 19,000 to
366,000. The 366,000 level was the lowest since May 2008. The four-week average was down 6,500 to 387,750 for the lowest level since July 2008.
Jobless Claims Consensus Forecast for 12/17/11: 380,000
Range: 365,000 to 390,000
The Reuter's/University of Michigan's consumer sentiment index for mid-December a strong 3.6 points to 67.7, led by a healthy 5.7 point jump in the leading component of expectations to 61.1. The gain in expectations suggests that consumers see improvement for their job prospects and for their income prospects, keys for acceleration in consumer spending. The consumer's assessment of current conditions is also showing improvement but to a lesser degree with the component up only three tenths to a still soft level of 77.9.
Consumer sentiment Consensus Forecast for final December 11: 68.0
Range: 65.5 to 69.2
The FHFA purchase only house price index in September gained 0.9 percent after slipping 0.2 percent the month before. Eight of the nine Census Divisions posted gains in September, led by a 2.5 percent jump for the West North Central region. Only the East South Central region declined, down 0.2 percent. On a year-on-year basis, the FHFA HPI was down 2.2 percent versus down 4.2 percent in August.
FHFA purchase only house price index Consensus Forecast for October 11: +0.3 percent
Range: 0.0 to +1.0 percent
The Conference Board's index of leading indicators posted a very strong 0.9 percent rise for October. Gains among the components were wide and convincing. The largest positive contribution came from building permits (0.27 percentage points), followed by the rates spread between the 10-year T-bond and fed funds (0.22 percent points). Also providing positive lift were the factory workweek, the stock market, consumer expectations, new orders for consumer goods & materials, new orders for nondefense capital goods, and an easing number of unemployment claims. There's only one negative in the month and it is marginal with vendor deliveries coming in with a 0.01 percentage point negative contribution.
Leading indicators Consensus Forecast for November 11: +0.3 percent
Range: +0.2 to +0.6 percent
Durable goods orders in October fell a revised 0.5 percent, following a decline of 1.4 percent the prior month. Excluding transportation, durables advanced 1.1 percent after a 0.8 percent rebound in September. Weakness in October was led by transportation which fell 5.1 percent after dropping 7.5 percent in September. Within transportation, weakness was in nondefense aircraft.
New orders for durable goods Consensus Forecast for November 11: +1.9 percent
Range: +0.5 percent to +5.5 percent
New orders for durable goods, ex-trans., Consensus Forecast for November 11: +0.4 percent
Range: -0.5 percent to +0.9 percent
Personal income in October advanced 0.4 percent, following a 0.1 percent increase in September. The wages & salaries component posted an even stronger 0.5 percent boost after rebounding 0.4 percent the month before. The pace of consumer spending eased in October but followed a strong gain the prior month. Personal consumption expenditures rose 0.1 percent in October, following a 0.7 percent surge in September. Headline inflation turned negative while the core rate was soft. The headline PCE price index declined 0.1percent, following a 0.2 percent increase in September.
Personal income Consensus Forecast for November 11: +0.2 percent
Range: 0.0 to +0.4 percent
Personal consumption expenditures Consensus Forecast for November 11: +0.3 percent
Range: +0.2 to +0.5 percent
PCE price index Consensus Forecast for November 11: +0.1 percent
Range: 0.0 to +0.2 percent
Core PCE price index Consensus Forecast for November 11: +0.1 percent
Range: +0.1 to +0.2 percent
New home sales in October rose 1.3 percent. Strength varied widely by region with the largest increase seen in the Midwest with a 22.2 percent jump, followed by the West which increased 14.9 percent for the month. The Northeast was unchanged while sales in the South declined 9.5 percent. On a year-ago basis, U.S. sales were up 1.3 percent, compared to 3.4 percent in September.
New home sales Consensus Forecast for November 11: 0.314 thousand-unit annual rate
Range: 0.301 thousand to 0.325 thousand-unit annual rate
SIFMA Recommended Early Close 2:00 ET
Consensus numbers are not yet available at time of publication.
U.S. Holiday: Christmas Day Observed
All Markets Closed
The S&P/Case-Shiller 20-city home price index (SA) for September showed a notable 0.6 percent monthly decline for the both adjusted and unadjusted 20-city indexes. In a mild offset, contraction in year-on-year rates moderated slightly to minus 3.6 percent, again for both the adjusted and unadjusted 20-city indexes.
The Conference Board's consumer confidence index surged in November with improvement centered in employment. The Conference Board's measure jumped 15.1 points to 56.0 from an upwardly revised 40.9 in September. November was the best reading since prior to the debt-ceiling debacle this past summer. The prior high was 59.2 in July.
The Richmond Fed manufacturing index for November ended four months of contraction, coming in at zero to show no monthly change in activity. In a negative, new orders were at minus 2 to show a fifth monthly contraction. Backlog orders were also a negative, extending contraction to seven months at minus 10. But shipments were a positive, at plus 1 to end six straight negative readings.
The Dallas Fed general business activity index in November posted its second positive reading in a row, edging up from 2.3 to 3.2. The company outlook index remained positive but moved down from 7.2 to 4.7. More than 90 percent of manufacturers said their outlooks were unchanged or improved from last month. However, the production index dipped from 4.1 to minus 5.1, registering its first negative reading in two years. The new orders index suggested deterioration of demand, falling to minus 5.1 from plus 8.3 in October and after a year in positive territory.
Initial jobless claims for the week of December 24 will be posted.
The pending home sales index jumped 10.4 percent in October, following a 4.6 percent decline the prior month. The gain points to strength in final sales of existing homes for November and December though cancellations, tied to low appraisals that keep buyers from selling their own homes and to restrictions to credit access, have been cutting into the proportion of contracts that make it to closing.
The Kansas City Fed manufacturing index eased slightly in November, but expectations for future months remained relatively solid. The month-over-month composite index eased to 4 in November, down from 8 in October and 6 in September. The composite index is an average of the production, new orders, employment, supplier delivery time, and raw materials inventory indexes. Manufacturing activity slowed in nondurable goods factories, while growth increased in durable goods producing plants, particularly for aerospace and fabricated metal products.
The Chicago PMI in November improved significantly, rising 62.6 from October’s 58.4 and far above 50 to indicate monthly growth. The November reading was the highest since April of this year. Leading indications in the report showed significant monthly acceleration led by an 8.9 point surge in new orders to 70.2 together with a 3.9 point gain for backlog orders to 55.1. The new orders index is showing is fastest rate of monthly growth since March with backlogs showing their fastest rate of build since April.
SIFMA Recommended Early Close 2:00 ET
R. Mark Rogers is the author of The Complete Idiot’s Guide to Economic Indicators, Penguin Books, 2009.
Econoday Senior Writer Mark Pender contributed to this article.
|
