|
While European concerns continue to wreak volatility on global financial markets, the U.S. recovery continues to gain traction, albeit slowly.
 Equities ended the week up although it looked uncertain until the last trading day. The big swings during the week were over changing views on progress or lack of progress toward containing fallout from European sovereign debt problems. Equities ended the week up although it looked uncertain until the last trading day. The big swings during the week were over changing views on progress or lack of progress toward containing fallout from European sovereign debt problems.
On Monday equities were up early in trading after French President Nicolas Sarkozy and German Chancellor Angela Merkel met Monday morning and came to terms on a new agreement that they argue will enforce fiscal discipline in the euro zone. Stocks pared gains later in the day after the Financial Times reported that Standard & Poor’s may downgrade euro nations. After markets closed, S&P announced that it put 15 euro nations on review for possible downgrade. Stock indexes were little changed Tuesday as the adverse news from S&P was factored into Monday’s activity and there little news on the U.S. front.
Most indexes were mostly little changed at mid-week although blue chips were up somewhat. Financials (notably JPMorgan Chase and Morgan Stanley) led the Dow up on optimism about potential solutions for European sovereign debt coming from Thursday’s European Central Bank policy decision and from a Friday meeting of European Union officials.
On Thursday, the ECB indeed announced a 25 basis point cut in its policy rate to 1.0 percent but markets were disappointed that ECB President Mario Draghi in the post-decision press conference discouraged expectations the Bank would massively step up buying of government bonds. That disappointed tugged stocks down for the day. Earlier in the day, an unexpectedly strong drop in initial jobless claims supported equity gains.
But at week’s close, equities rebounded significantly after a majority of European leaders agreed on a new plan to resolve the euro zone debt crisis. At a meeting in Brussels on Friday, the 17 members of the euro zone agreed on a plan for a new intergovernmental treaty to tighten the integration of national budgets. Six additional European Union nations (not in the euro zone) supported the deal, but Britain rejected it. The three remaining EU countries tentatively supported the deal, but must secure approval from their parliaments. While financial markets reacted quite favorably to the developments in Europe, progress is still very tentative and hardly guaranteed.
Also adding lift to equities on the last day of trading was a better-than-expected consumer sentiment reading. Additionally, traders refocused somewhat on the U.S. economy, remembering that Thursday’s jobless claims numbers were favorable.
Equities were up this past week. The Dow was up 1.4 percent; the S&P 500, up 0.9 percent; the Nasdaq, up 0.8 percent; and the Russell 2000, up 1.4 percent.
For the year-to-date, major indexes are mostly down as follows: the S&P 500, down 0.2 percent; the Nasdaq, down 0.2 percent; and the Russell 2000, down 4.9 percent. However, the Dow is up 5.2 percent.
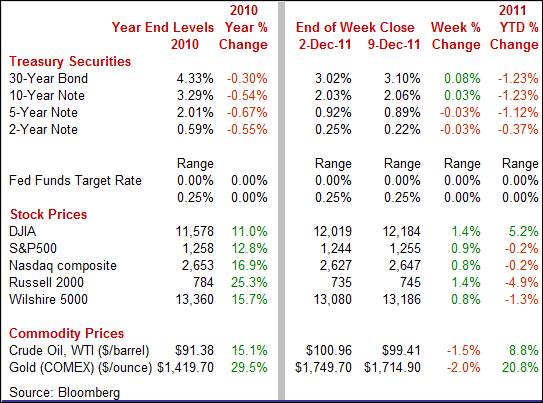
Weekly percent change column reflects percent changes for all components except interest rates. Interest rate changes are reflected in simple differences.
 Treasury yields were mixed this past week with mid-maturity rates down slightly and longer-term yields up. During the week, there was notably daily volatility. Treasury yields were mixed this past week with mid-maturity rates down slightly and longer-term yields up. During the week, there was notably daily volatility.
The week started quietly as rates were little changed on Monday. Yields firmed Tuesday on belief that European leaders would succeed in resolving the debt crisis. The S&P downgrade warning for 15 euro-area governments was seen as motivating European officials.
Rates swung up Tuesday and then down on Wednesday on alternating views of how well European leaders were seen being able to come up with an agreed upon plan at week’s end. On Wednesday, Germany stated it would oppose any attempt to change an agreed-upon sequence in which the permanent European Stability Mechanism will take over from the current rescue fund.
Rates dropped Thursday despite a sizeable fall in initial jobless claims as the ECB president indicated that the ECB would not be purchasing sizeable amounts of European bonds. Traders had built in expectations that the ECB would do more than merely cut its policy rate. But on Friday, rates jumped as funds flowed into equities on believed to be favorable news out of Europe of progress on containing debt problems.
 For this past week Treasury rates were mixed as follows: 3-month T-bill, up 1 basis point; the 2-year note, down 3 basis points; the 5-year note, down 3 basis points; the 7-year note, down 1 basis point; the 10-year note, up 3 basis points; and the 30-year bond, up 8 basis points. For this past week Treasury rates were mixed as follows: 3-month T-bill, up 1 basis point; the 2-year note, down 3 basis points; the 5-year note, down 3 basis points; the 7-year note, down 1 basis point; the 10-year note, up 3 basis points; and the 30-year bond, up 8 basis points.
Overall, developments in Europe have made traders more nervous than not with U.S. paper seen as a safe haven. Nervousness also has shown up in an uptrend in the TED spread (the 3-month LIBOR rate less the 3-month T-bill rate). The TED spread is now 54 basis points—back to levels seen at the height of the PIIGS crisis in 2010 but still well below the worst of the global financial crisis in 2008.
 The spot price of crude eased modestly this past week but remains elevated. Trading was quiet until Thursday. The spot price of West Texas Intermediate dropped more than $2 per barrel on disappointing news from the European Central Bank—notably that it did not announce large purchases of European bonds. Spot crude firmed a little over a buck a barrel on Friday on news of progress from the Friday summit meeting of European Union leaders on a potential long-term solution to sovereign debt problems. The spot price of crude eased modestly this past week but remains elevated. Trading was quiet until Thursday. The spot price of West Texas Intermediate dropped more than $2 per barrel on disappointing news from the European Central Bank—notably that it did not announce large purchases of European bonds. Spot crude firmed a little over a buck a barrel on Friday on news of progress from the Friday summit meeting of European Union leaders on a potential long-term solution to sovereign debt problems.
Net for the week, the spot price for West Texas Intermediate declined $1.55 per barrel to settle at $99.41.
The limited economic calendar posted mixed results with the consumer more upbeat, the trade gap improving, but non-manufacturing activity decelerating. Nonetheless, the recovery appears to continue to improve net.
 Recent trade numbers have been somewhat volatile by components. But on average, the trade deficit has been shrinking in recent months as exports have been outstripping import growth Recent trade numbers have been somewhat volatile by components. But on average, the trade deficit has been shrinking in recent months as exports have been outstripping import growth
In October, the U.S. trade deficit shrank as a recently atypical drop in imports outpaced a dip in exports. The trade gap narrowed to $43.5 billion from $44.2 billion in September (originally $43.1 billion). Exports slipped 0.8 percent after jumping 1.4 percent in September. Imports declined 1.0 percent in October, following a 0.6 percent gain the month before.
 The improvement in the trade gap was led by the petroleum gap which narrowed to $24.4 billion from $26.6 billion in September. The nonpetroleum goods worsened to $33.2 billion from $31.8 billion in September. Most of this widening was due to a reversal of nonmonetary gold exports which had jumped in September on flight to safety when the stock market was dropping sharply. The services surplus in October was little changed at $36.1 billion from $36.0 billion in September. The improvement in the trade gap was led by the petroleum gap which narrowed to $24.4 billion from $26.6 billion in September. The nonpetroleum goods worsened to $33.2 billion from $31.8 billion in September. Most of this widening was due to a reversal of nonmonetary gold exports which had jumped in September on flight to safety when the stock market was dropping sharply. The services surplus in October was little changed at $36.1 billion from $36.0 billion in September.
The October decrease in exports of goods reflected declines in industrial supplies and materials ($1.3 billion); consumer goods ($0.6 billion); foods, feeds, and beverages ($0.1 billion); and automotive vehicles, parts, and engines ($0.1 billion). Increases occurred in capital goods ($0.5 billion) and other goods ($0.2 billion).
The October decrease in imports of goods reflected decreases in industrial supplies and materials ($3.6 billion) which was largely crude oil ($1.5 billion); automotive vehicles, parts, and engines ($0.6 billion); and other goods ($0.1 billion). Increases occurred in capital goods ($1.1 billion); consumer goods ($0.7 billion); and foods, feeds, and beverages ($0.2 billion).
On a year-ago basis, exports of goods and services were up 12.3 percent while imports were up 11.9 percent.
Essentially, most of the movement in the October trade data was in oil and nonmonetary gold. It appears that the underlying trend of continued export growth continues while import growth is trending positive, reflecting moderate demand.
 The non-manufacturing sector decelerated in November, according to the Institute for Supply Management. A drop in employment pulled down the ISM's non-manufacturing composite by 0.9 point in November to 52.0, still above 50 to indicate monthly growth in business activity but at a slightly slower rate than October. The November composite is at its level since January 2010, suggesting sluggish growth. The non-manufacturing sector decelerated in November, according to the Institute for Supply Management. A drop in employment pulled down the ISM's non-manufacturing composite by 0.9 point in November to 52.0, still above 50 to indicate monthly growth in business activity but at a slightly slower rate than October. The November composite is at its level since January 2010, suggesting sluggish growth.
Two of the four components of the composite were behind the dip in the overall index. The employment index fell 4.4 points to a sub-50 level of 48.9 to indicate a decline in the size of the ISM sample's workforce. The supplier deliveries index slipped 2.0 points to 50.0. On the positive side, the business activity/production index gained 2.4 points to 56.2. And the new orders index advanced 0.6 point to 53.0. New orders are still sluggish—being only moderately above breakeven—but do suggest continued gains in production in coming months.
 Consumer spending has been healthier than the consumer mood in recent months. However, in early December consumers have started to admit to themselves that the economy is improving. But the improvement is from deeply depressed levels. The Reuters/University of Michigan mid-December consumer sentiment index rose a strong 3.6 points to 67.7, led by a healthy 5.7 point jump in the leading component of expectations to 61.1. The gain in expectations suggests that consumers see improvement for their job prospects and for their income prospects, keys for acceleration in consumer spending. Consumer spending has been healthier than the consumer mood in recent months. However, in early December consumers have started to admit to themselves that the economy is improving. But the improvement is from deeply depressed levels. The Reuters/University of Michigan mid-December consumer sentiment index rose a strong 3.6 points to 67.7, led by a healthy 5.7 point jump in the leading component of expectations to 61.1. The gain in expectations suggests that consumers see improvement for their job prospects and for their income prospects, keys for acceleration in consumer spending.
The consumer's assessment of current conditions is also showing improvement but to a lesser degree with the component up only three tenths to a still soft level of 77.9. Inflation expectations are benign despite $100 oil which has, however, yet to inflate prices at the gas pump due to relatively sizeable supply of refined oil products.
 While there has been a disconnect in recent months between strong consumer spending and depressed consumer sentiment, the improvement in the consumer mood can only be a positive toward adding momentum to the recovery. While there has been a disconnect in recent months between strong consumer spending and depressed consumer sentiment, the improvement in the consumer mood can only be a positive toward adding momentum to the recovery.
 More data are coming in that confirm that the strength in consumer spending is real. Credit-cautious consumers are starting to tip-toe into tapping their credit lines again. Outstanding consumer credit grew $7.6 billion in October following a revised $6.9 billion increase in September. The increase once again is centered in nonrevolving credit, which reflects strength in vehicle sales. Nonrevolving credit gained $7.3 billion in October after a $6.5 billion rise the prior month. More data are coming in that confirm that the strength in consumer spending is real. Credit-cautious consumers are starting to tip-toe into tapping their credit lines again. Outstanding consumer credit grew $7.6 billion in October following a revised $6.9 billion increase in September. The increase once again is centered in nonrevolving credit, which reflects strength in vehicle sales. Nonrevolving credit gained $7.3 billion in October after a $6.5 billion rise the prior month.
 A steady but modest increase appears for non-revolving credit, up $0.4 billion for a second consecutive month and offering evidence that consumers are once again, at least to a limited extent, using their credit cards. The big question is whether consumers are nudging up credit card use because they are more confident about personal finances and future income or because their income is tight and credit card usage is filling the gap. The Fed’s consumer credit report does not provide details for that insight which can only be inferred to some degree from other data—such as delinquency rates. A steady but modest increase appears for non-revolving credit, up $0.4 billion for a second consecutive month and offering evidence that consumers are once again, at least to a limited extent, using their credit cards. The big question is whether consumers are nudging up credit card use because they are more confident about personal finances and future income or because their income is tight and credit card usage is filling the gap. The Fed’s consumer credit report does not provide details for that insight which can only be inferred to some degree from other data—such as delinquency rates.
 And recent data on consumer delinquency rates suggest that consumer finances on average are on the mend. Based on data from commercial banks, delinquency rates on consumer credit cards are down significantly from recession highs and are almost down to where there were before the recent recession. This rate was 3.5 percent in the third quarter of 2011 versus the recession peak of 6.8 percent for the second quarter of 2009. However, delinquency rates on residential real estate remain near the historical high—likely due to a significant percentage of mortgages being “under water,” combined with a high unemployment rate. And recent data on consumer delinquency rates suggest that consumer finances on average are on the mend. Based on data from commercial banks, delinquency rates on consumer credit cards are down significantly from recession highs and are almost down to where there were before the recent recession. This rate was 3.5 percent in the third quarter of 2011 versus the recession peak of 6.8 percent for the second quarter of 2009. However, delinquency rates on residential real estate remain near the historical high—likely due to a significant percentage of mortgages being “under water,” combined with a high unemployment rate.
Nonetheless, consumers on average have been cleaning up their financial act and are a little more positive about the economy based on an increased willingness to spend and take on additional debt—albeit incrementally.
The U.S. economy continues to expand. Improvement in the consumer mood is particularly encouraging even though consumers have been spending better than they have been feeling for a number of months. However, Europe will likely continue to sway markets in the U.S. and globally for some time.
The economic calendar is heavy with inflation and the manufacturing sector in focus. The highlights are on Tuesday with an update on consumer spending with retail sales and then later in the afternoon with the Fed’s FOMC meeting statement. On the inflation front, import prices post Wednesday, the PPI on Thursday and CPI on Friday. Manufacturing updates are released Thursday for Empire State, Philly Fed and industrial production
The U.S. Treasury monthly budget report showed an October deficit of $98.5 billion which would have been about $129 billion if not for a calendar shift that moved Treasury payments into September. The receipt side of the government's ledger was dominated by individual income taxes which, at $86.8 billion in the month, were up 21.5 percent year-on-year. Looking ahead, November typically shows a deficit for the month. Over the past 10 years, the average deficit for the month of November has been $73.7 billion and $100.0 billion over the past five years. The November 2010 deficit came in at $150.4 billion.
Treasury Statement Consensus Forecast for November 11: -$139.0 billion
Range: -$155.0 billion to -$139.0 billion.
Retail sales in October advanced 0.5 percent, following a 1.1 percent jump in September. Excluding autos, retail sales increased a strong 0.6 percent in October after gaining a robust 0.5 percent in September. Due to a decline in prices, gasoline sales tugged down on the core, dipping 0.4 percent, following a 0.7 percent jump the month before. However, sales excluding autos and gasoline in October jumped a strong 0.7 percent, following a 0.5 percent gain in September. Component gains were widespread. Looking ahead, overall retail sales for November are likely to get lift from a 2.8 percent boost in unit new motor vehicles sales for the month.
Retail sales Consensus Forecast for November 11: +0.5 percent
Range: +0.2 to +0.8 percent
Retail sales excluding motor vehicles Consensus Forecast for November 11: +0.4 percent
Range: +0.1 to +0.6 percent
Business inventories were unchanged in September with business sales up 0.6 percent, a combination that kept the inventory-to-sales ratio at 1.27. This ratio has been relatively steady for the last two years after spiking as high as 1.49 during the recession when sales of course plunged. Looking ahead, recently released components show a 0.9 percent jump in manufacturers’ inventories for October and a 1.6 surge in wholesale trade inventories.
Business inventories Consensus Forecast for October 11: +0.6 percent
Range: +0.2 to +1.0 percent
The FOMC announcement at 2:15 p.m. ET for the December 13 FOMC policy meeting is expected to leave the fed funds target rate unchanged. However, more extensive discussion is expected on whether the Fed should provide more detailed guidance on the contingency timing of upcoming tightening or loosening. For example, should the Fed announce in advance that it will tighten or loosen if the unemployment rate or inflation rate hits a certain number' And, as usual, traders will be parsing the statement for an upgrade or downgrade on the economy.
FOMC Consensus Forecast for 12/13/11 policy vote on fed funds target range: unchanged at a range of 0.0 to 0.25 percent
Import prices declined 0.6 percent in October, following no change in September. The headline decline reflected a third straight decline for petroleum prices which fell 1.0 percent in the month and which pulled a host of petroleum-related categories lower including industrial supplies which fell 1.4 percent. Yet in isolated but still important signs of pressure, import prices for consumer goods excluding autos jumped 0.7 percent following a run going back to June of 0.3 percent gains.
Import prices Consensus Forecast for November 11: +1.2 percent
Range: -0.2 to +2.0 percent
Initial jobless claims for the December 3 week fell a sizable 23,000 to 381,000, the lowest level since February. Although the BLS reported no unusual factors in the data, the unadjusted week-to-week increase for the post-Thanksgiving week was the largest of the year, a factor that seasonal adjustments smooth though these adjustments are less reliable for weekly data than monthly numbers. The holidays are always a tough time to get a clear read on weekly claims data.
Jobless Claims Consensus Forecast for 12/10/11: 390,000
Range: 383,000 to 400,000
The producer price index fell 0.3 percent in October after jumping 0.8 percent in September. By major components, energy fell 1.4 percent after rebounding 2.3 percent in September. Gasoline dropped 2.4 percent, following an increase of 4.2 percent. Food costs decelerated to a 0.1 percent rise, following a 0.6 percent boost in September. At the core level, the PPI was unchanged in October, following a 0.2 percent rise the month before. Declines in prices for prices of passenger cars and light trucks played a key role in keeping the core flat.
PPI Consensus Forecast for November 11: +0.2 percent
Range: -0.3 to +0.6 percent
PPI ex food & energy Consensus Forecast for November 11: +0.2 percent
Range: +0.1 to +0.3 percent
The Empire State manufacturing index in November improved to plus 0.61 from minus 8.48 the month before. The November reading was the first positive number since May. However, the new orders index was still soft at minus 2.07, showing a monthly contraction with unfilled orders, at minus 7.32, showing a slightly deeper contraction. But manufacturers in the region see this contraction as temporary with their six-month outlooks pointing to growth for each but especially for new orders.
Empire State Manufacturing Survey Consensus Forecast for December 11: 3.0
Range: 0.0 to 7.0
Industrial production surged a convincing 0.7 percent in October, following a 0.1 percent dip the prior month. The latest boost reflected a very strong 0.5 percent rise in manufacturing output and a 2.3 percent rebound in mining output. Within the manufacturing component, gains were led by a 3.1 percent surge in autos as the rebound from prior Japan-supply dislocations appears to be hitting a peak. Excluding autos, manufacturing still posted a second-straight and respectable 0.3 percent gain. Capacity utilization jumped five-tenths to 77.8 percent which is the highest reading of the recovery. Looking ahead to November, the manufacturing component is likely to be weak as aggregate production hours in manufacturing fell 0.5 percent for the month.
Industrial production Consensus Forecast for November 11: +0.2 percent
Range: -0.2 to +0.5 percent
Capacity utilization Consensus Forecast for November 11: 77.8 percent
Range: 77.5 to 78.1 percent
The general business conditions index of the Philadelphia Fed's Business Outlook Survey eased to 3.6 from 8.7 in October. Most indicators for current activity decelerated. The new orders index slowed to 1.3 in November from 7.8 in October, indicating softness in future activity. Also, unfilled orders turned to a negative 1.5 from plus 3.4 in October. The shipments index decelerated to 7.3 from 13.6. On the plus side, the six months outlook index for general business activity jumped to 41.9 from 27.2 in October.
Philadelphia Fed survey Consensus Forecast for December 11: 5.0
Range: 0.0 to 10.0
Quadruple Witching
The consumer price index in October declined 0.1 percent, following a 0.3 percent boost in September. Excluding food and energy, the CPI rose a modest 0.1 percent, matching September’s gain. By major components, energy declined 2.0 percent, following a jump of 2.0 percent in September. Food price inflation softened to a 0.1 percent rise after jumping 0.4 percent. Within the core, upward pressure was seen in medical care and apparel with declines in new vehicles and used cars partially offsetting.
CPI Consensus Forecast for November 11: +0.1 percent
Range: -0.1 to +0.2 percent
CPI ex food & energy Consensus Forecast for November 11: +0.1 percent
Range: 0.0 to +0.2 percent
R. Mark Rogers is the author of The Complete Idiot’s Guide to Economic Indicators, Penguin Books, 2009.
Econoday Senior Writer Mark Pender contributed to this article.
|
