|
Most economic indicators were better than expected this past week although the employment report was about as expected net. The recovery continues to build momentum although at a modest pace. Even housing is improving but apparently at the expense of prices.
 It was an outstanding week for equities with the big moves on Monday and especially Wednesday. The week got off to a good start with news from the National Retail Federation on Sunday that major retailers reported record sales of $52.4 billion over Black Friday weekend. Also, equities got lift from news that Germany and France were stepping up efforts to fast track European budget and financial coordination. Sentiment was also boosted after an Italian newspaper report suggested the International Monetary Fund was preparing a rescue plan for Italy worth up to €600 billion even though the IMF denied the report. It was an outstanding week for equities with the big moves on Monday and especially Wednesday. The week got off to a good start with news from the National Retail Federation on Sunday that major retailers reported record sales of $52.4 billion over Black Friday weekend. Also, equities got lift from news that Germany and France were stepping up efforts to fast track European budget and financial coordination. Sentiment was also boosted after an Italian newspaper report suggested the International Monetary Fund was preparing a rescue plan for Italy worth up to €600 billion even though the IMF denied the report.
 Most indexes saw continued but modest gains on Tuesday with a better-than-expected consumer confidence number offsetting a negative Case-Shiller home price report. Most indexes saw continued but modest gains on Tuesday with a better-than-expected consumer confidence number offsetting a negative Case-Shiller home price report.
Stocks soared Wednesday after six major central banks jointly added liquidity to the world's financial system, easing worries about a global downturn. The Fed and other central banks announced pending central bank swaps to reduce the cost of lending in U.S. dollars to help alleviate financial stress in Europe and elsewhere. Also, economic news on ADP private employment, pending home sales, and the Chicago PMI were positive and topped expectations.
Stock indexes were mixed Thursday but mostly down, largely on profit taking after the Wednesday surge. Also, a mildly disappointing jobless claims report outweighed good news on ISM manufacturing and construction spending.
Equities were mixed but little changed Friday on as news from the November employment situation report was a little below expectations overall although still notably positive with payrolls up and earlier months revised up. The unemployment rate dropped unexpectedly but analysts discounted the drop in terms of statistical reliability.

Equities were up significantly this past week. The Dow was up 7.0 percent; the S&P 500, up 7.4 percent; the Nasdaq, up 7.6 percent; and the Russell 2000, up 10.3 percent.
Equities were mostly down in November. The S&P 500 was down 0.5 percent; the Nasdaq, down 2.4 percent; and the Russell 2000, down 0.5 percent. However, the Dow was up 0.8 percent.
For the year-to-date, major indexes are mostly down as follows: the S&P 500, down 1.1 percent; the Nasdaq, down 1.0 percent; and the Russell 2000, down 6.2 percent. The Dow is up 3.8 percent.
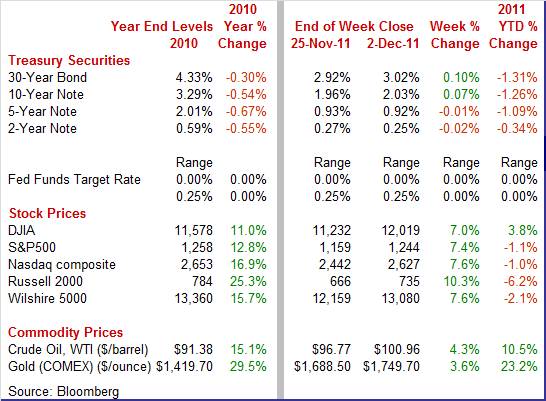
Weekly percent change column reflects percent changes for all components except interest rates. Interest rate changes are reflected in simple differences.
 Treasury yields were mixed this past week with longer-maturity yields up and the short end down slightly. The week started quietly with rates little changed on Monday. On Tuesday, yields firmed modestly on a positive consumer confidence report. Rates jumped significantly at mid-week on the announcement by six central banks of coordinated central bank liquidity swap programs with favorable ADP, pending home sales, and Chicago PMI report adding lift. Treasury yields were mixed this past week with longer-maturity yields up and the short end down slightly. The week started quietly with rates little changed on Monday. On Tuesday, yields firmed modestly on a positive consumer confidence report. Rates jumped significantly at mid-week on the announcement by six central banks of coordinated central bank liquidity swap programs with favorable ADP, pending home sales, and Chicago PMI report adding lift.
 Rates were little changed Thursday. At the close of the week, Treasury yields slipped moderately as expectations for payroll jobs had been bumped up after a healthy ADP report but actual numbers were positive but fell short of revised expectations. Rates were little changed Thursday. At the close of the week, Treasury yields slipped moderately as expectations for payroll jobs had been bumped up after a healthy ADP report but actual numbers were positive but fell short of revised expectations.
For this past week Treasury rates were mixed as follows: 3-month T-bill, down 3 basis points; the 2-year note, down 2 basis points; the 5-year note, down 1 basis point; the 7-year note, up 3 basis points; the 10-year note, up 7 basis points; and the 30-year bond, up 10 basis points.
The spot price of West Texas Intermediate rose significantly this past week, closing over $100 per barrel the last three days of trading. However, the big moves in prices were on Monday and Tuesday.
 Prices jumped a buck and a half Monday on strong reports of retail sales over the Black Friday weekend. Spot WTI rose by about the same amount on Tuesday with a sizeable gain in consumer confidence the main factor. During the early part of the week, tensions between Britain and Iran also added support to oil prices. Prices jumped a buck and a half Monday on strong reports of retail sales over the Black Friday weekend. Spot WTI rose by about the same amount on Tuesday with a sizeable gain in consumer confidence the main factor. During the early part of the week, tensions between Britain and Iran also added support to oil prices.
Net for the week, the spot price for West Texas Intermediate jumped $4.19 per barrel to settle at $100.96.
The economy continues to gain momentum although growth remains subpar for a recovery. Sector improvement has been seen not just in manufacturing but also services and even construction.
 The U.S. labor market is improving, although gradually. The November jobs report overall came in with improvement, though there were mixed results. Payroll jobs in November advanced a relatively strong 120,000 after gaining a revised 100,000 in October (originally 80,000) and increased a revised 210,000 in September (previously 158,000). Analysts forecast a 131,000 boost in overall payrolls. Revisions for September and October were up net 72,000. The U.S. labor market is improving, although gradually. The November jobs report overall came in with improvement, though there were mixed results. Payroll jobs in November advanced a relatively strong 120,000 after gaining a revised 100,000 in October (originally 80,000) and increased a revised 210,000 in September (previously 158,000). Analysts forecast a 131,000 boost in overall payrolls. Revisions for September and October were up net 72,000.
 Once again, private payrolls gained more than overall. Private nonfarm payrolls gained 140,000, following a 117,000 increase in October and 220,000 rise in September. The November boost fell short of market expectations for a 150,000 increase. Once again, private payrolls gained more than overall. Private nonfarm payrolls gained 140,000, following a 117,000 increase in October and 220,000 rise in September. The November boost fell short of market expectations for a 150,000 increase.
In the private sector, goods-producing jobs slipped 6,000 after a 4,000 decrease in October and 36,000 boost in September. Construction jobs fell 12,000 in October after decreasing 15,000 the month before. Manufacturing employment edged up 2,000 after a 6,000 rise in October. Mining increased 2,000, following a 6,000 rise the prior month.
Private service-providing jobs advanced 146,000 in November, following a 121,000 gain the prior month. The November increase was led by trade & transportation (up 58,000), professional & business services (up 33,000), leisure & hospitality (up 22,000), health care (up 12,000). The temp help subcomponent of professional & business services rose 22,000 after a 16,000 gain.
The public sector continued to decline as government employment decreased 20,000, following a 17,000 drop in October.
Wage growth has been volatile recently as average hourly earnings in November slipped 0.1 percent, following an upwardly revised 0.3 percent gain the month before. Analysts predicted a 0.2 percent increase for November. On average, wage growth has been growing but at an anemic pace. Given the upward revision to October, the November dip should not been so disconcerting. Still, the uptrend is modest. Average hourly earnings are up 1.6 percent on a year-ago basis compared to 1.5 percent in October. The average workweek for all workers in November was unchanged at 34.3 hours, matching the market median forecast.
 From the household survey, the unemployment rate unexpectedly dropped to 8.6 percent from 9.0 percent in October. November’s number was a two and a half year low. The rate decline reflected a 594,000 fall in the number of unemployed and a 278,000 increase in household employment. The labor force dropped 315,000. Basically, the unemployment rate fell largely due to a decline in the participation rate although household employment growth recently continues to exceed payroll jobs growth by a notable degree. From the household survey, the unemployment rate unexpectedly dropped to 8.6 percent from 9.0 percent in October. November’s number was a two and a half year low. The rate decline reflected a 594,000 fall in the number of unemployed and a 278,000 increase in household employment. The labor force dropped 315,000. Basically, the unemployment rate fell largely due to a decline in the participation rate although household employment growth recently continues to exceed payroll jobs growth by a notable degree.
Over the last four months, household employment gains have averaged a monthly 321,000 versus 134,000 for payroll gains. The household survey may be picking up contract employment and small business hiring that the payroll survey is not catching. Overall, the latest employment report is favorable for the recovery continuing to gain traction.
 Consumer spending continues to best measures of the consumer mood, according to the latest auto sales numbers. Unit new motor vehicle sales—combined domestics and imports—rose 2.8 percent in November, following a 1.2 percent rise the prior month. The November pace of 13.6 million units annualized is the strongest since the “cash for clunkers” program sent sales soaring a monthly 25.4 percent in August 2009 to 14.2 million units sold. Consumer spending continues to best measures of the consumer mood, according to the latest auto sales numbers. Unit new motor vehicle sales—combined domestics and imports—rose 2.8 percent in November, following a 1.2 percent rise the prior month. The November pace of 13.6 million units annualized is the strongest since the “cash for clunkers” program sent sales soaring a monthly 25.4 percent in August 2009 to 14.2 million units sold.
For November, sales show mild strength for both cars and light trucks and mild strength for both North American made and foreign made. The latest unit sales numbers suggest a healthy gain in the auto component of retail sales. The Commerce Department uses different source data for retail sales.
 Consumer confidence surged in November with improvement centered in employment. The Conference Board's measure jumped 15.1 points to 56.0 from an upwardly revised 40.9 in September. November is the best reading since prior to the debt-ceiling debacle and cut of the US credit rating in August. The prior high was 59.2 in July. Consumer confidence surged in November with improvement centered in employment. The Conference Board's measure jumped 15.1 points to 56.0 from an upwardly revised 40.9 in September. November is the best reading since prior to the debt-ceiling debacle and cut of the US credit rating in August. The prior high was 59.2 in July.
Some warming in the jobs market is behind the better mood. Those saying jobs are currently hard to get fell nearly five percentage points to 42.1 percent. Another key reading was a sharp improvement in income expectations over the next six months with more, 14.9 percent, seeing an increase and fewer, 13.8 percent, seeing a decrease. This is the first time since April that optimists have outnumbered pessimists.
 The latest report from the Institute for Supply Management added to the argument that the manufacturing sector is regaining momentum. The ISM composite index moved further into positive territory, rising 1.2 points in November to a reading of 52.7. The latest report from the Institute for Supply Management added to the argument that the manufacturing sector is regaining momentum. The ISM composite index moved further into positive territory, rising 1.2 points in November to a reading of 52.7.
The gain in the composite was led by a 6.5 point jump in the production index to 56.6. Importantly, the new orders index was up a very strong 4.3 points to 56.7, above 50 to indicate monthly growth and pointing to continuing momentum. The inventory component improved slightly but remained somewhat below breakeven, indicating softness in inventories and likely little if any overhang. The delivery time index edged down as did employment. However, the employment index did remain above 50, indicating continued modest gains in hiring.
 The pace of activity in the Chicago area picked up in November with the business barometer at 62.6, far above 50 to indicate monthly growth and well above October's 58.4 to indicate acceleration in monthly growth. The November reading is the highest since April of this year. The pace of activity in the Chicago area picked up in November with the business barometer at 62.6, far above 50 to indicate monthly growth and well above October's 58.4 to indicate acceleration in monthly growth. The November reading is the highest since April of this year.
Leading indications in the report showed significant monthly acceleration led by an 8.9 point surge in new orders to 70.2 together with a 3.9 point gain for backlog orders to 55.1. The new orders index is showing is fastest rate of monthly growth since March with backlogs showing their fastest rate of build since April.
The latest report is good news for the overall economy as this Chicago area measure covers manufacturing and nonmanufacturing—indicating a broad strengthening by sectors.
 Housing activity is showing signs of modest improvement. New home sales in October rose 1.3 percent. Strength varied widely by region with the largest increase seen in the Midwest with a 22.2 percent jump, followed by the West which increased 14.9 percent for the month. The Northeast was unchanged while sales in the South declined 9.5 percent. On a year-ago basis, U.S. sales were up 1.3 percent, compared to 3.4 percent in September. Housing activity is showing signs of modest improvement. New home sales in October rose 1.3 percent. Strength varied widely by region with the largest increase seen in the Midwest with a 22.2 percent jump, followed by the West which increased 14.9 percent for the month. The Northeast was unchanged while sales in the South declined 9.5 percent. On a year-ago basis, U.S. sales were up 1.3 percent, compared to 3.4 percent in September.
Price pressures continue but were less severe than prior months. The median price slipped 0.5 percent in the month to $212,300 but the year-on-year rate turned positive, at plus 4.0 percent versus a revised minus 6.5 percent in the prior month. Supply on the market continues to become less bloated, falling slightly to 6.3 months 6.4 months in September and compared to the recent cycle high of 12.2 months for January 2009. October's supply reading is the best since April last year when government programs were stimulating sales.
The latest new home sales report joins a growing list of housing indicators that are pointing to limited recovery for this sector—a recovery supported by very low mortgage rates but still held down by foreclosures, high unemployment, and tight credit conditions.
 Despite headwinds, the latest pending home sales report indicates that housing may be back on a modest uptrend—at least for sales. Low prices and low interest rates appear to be creating traction as the pending home index, which is a measure of contract signings for sales of existing homes, jumped 10.4 percent in October, following a 4.6 percent decline the prior month. The gain points to strength in final sales of existing homes for November and December though cancellations, tied to low appraisals that keep buyers from selling their own homes and to restrictions to credit access, have been cutting into the proportion of contracts that make it to closing. Despite headwinds, the latest pending home sales report indicates that housing may be back on a modest uptrend—at least for sales. Low prices and low interest rates appear to be creating traction as the pending home index, which is a measure of contract signings for sales of existing homes, jumped 10.4 percent in October, following a 4.6 percent decline the prior month. The gain points to strength in final sales of existing homes for November and December though cancellations, tied to low appraisals that keep buyers from selling their own homes and to restrictions to credit access, have been cutting into the proportion of contracts that make it to closing.
One caveat to the latest numbers is that we are now looking at monthly data during the period when sales typically soften on a seasonal basis—though such seasonal softness is greatest during winter months. But atypical strength during fall and winter are notably boosted by seasonal factors. However, the seasonality issue appears to have lifted October by only about 3 percentage points as not seasonally adjust pending sales gained 8.3 percent on a month-ago basis.
 Two key measures of home prices painted different pictures of price conditions in October. First, according to the FHFA (Federal Housing Finance Agency) house prices in September gained 0.9 percent after slipping 0.2 percent the month before (originally down 0.1 percent). The September increase came in higher than analysts' expectation for no change. Eight of the nine Census Divisions posted gains in September, led by a 2.5 percent jump for the West North Central region. Only the East South Central region declined, down 0.2 percent. On a year-on-year basis, the FHFA HPI is down 2.2 percent versus down 4.2 percent in August. Two key measures of home prices painted different pictures of price conditions in October. First, according to the FHFA (Federal Housing Finance Agency) house prices in September gained 0.9 percent after slipping 0.2 percent the month before (originally down 0.1 percent). The September increase came in higher than analysts' expectation for no change. Eight of the nine Census Divisions posted gains in September, led by a 2.5 percent jump for the West North Central region. Only the East South Central region declined, down 0.2 percent. On a year-on-year basis, the FHFA HPI is down 2.2 percent versus down 4.2 percent in August.
In contrast, Case-Shiller data for September showed a notable 0.6 percent monthly decline for the both adjusted and unadjusted 20-city indexes. Published monthly data are based on three-month averages which indicate an especially severe decline for underlying September alone. In a mild offset, contraction in year-on-year rates moderated slightly to minus 3.6 percent, again for both the adjusted and unadjusted 20-city indexes.
 Some metro areas are under significant downward price pressure. Atlanta, together with Phoenix and Las Vegas, posted new crisis lows. However, the Case-Shiller report stated that it is confident that, for the nation as a whole, the price collapse of 2007 through 2009 will not be repeated. Some metro areas are under significant downward price pressure. Atlanta, together with Phoenix and Las Vegas, posted new crisis lows. However, the Case-Shiller report stated that it is confident that, for the nation as a whole, the price collapse of 2007 through 2009 will not be repeated.
The two reports on home prices give at face value contradictory reports. The difference in recent trends likely is tied to differences in coverage. The FHFA index includes only sales funded by conventional loans either financed or bundled by government housing agencies. In contrast, the Case-Shiller index includes sales funded by all types of loans and does not have a price cap on the mortgage as does FHFA. Housing price weakness currently appears to be greatest at the low end and high end. FHFA would not capture the increased share of cash sales involving distressed sales. High foreclosure rates are still weighing on the broad housing market but less so for homes in the mid-price range.
 It may not be a lot (coming from a low base) but it is starting to look like the construction sector is incrementally adding to overall economic growth. Construction spending in October advanced 0.8 percent after rising an unrevised 0.2 percent in September. It may not be a lot (coming from a low base) but it is starting to look like the construction sector is incrementally adding to overall economic growth. Construction spending in October advanced 0.8 percent after rising an unrevised 0.2 percent in September.
The October increase was led by a 3.4 percent boost in private residential outlays, following a 0.6 percent rise in September. Private nonresidential construction spending also posted a gain, rising 1.3 percent, following a 0.1 percent dip the month before. Public outlays declined 1.8 percent after a 0.3 percent increase the prior month.
Construction outlays have risen three months in a row and in six of the last seven months. The level of activity is still subdued but it now appears to be growing and adding to overall economic growth. It is not an “engine” like manufacturing but it is in better shape than even less than a year ago.
The latest Beige Book confirmed the mainstream view of most economists that the economy is improving but gradually. All but one Fed District reported increased economic activity. Consumer spending is rising—especially for motor vehicles. Manufacturing continues to bolster economic growth and even bank lending is showing modest improvement. Not unexpectedly, hiring is seen as “generally subdued,” wages are stable, and some cost pressures have eased.
Reports on consumer spending were mixed with most Districts reporting improved sales although a few described sales as moderating or weaker. Increases in motor vehicle sales were broad based. Manufacturing activity grew at a steady pace across most of the country, with all Districts other than St. Louis reporting increases in orders, shipments, or production. A sore point in the recovery has been the alleged reluctance of banks to lend. That appears to be changing for the better net overall—but not dramatically.
Overall residential real estate activity increased, but conditions were varied across Districts. Residential construction remained sluggish. Single-family home construction remained weak, while multifamily construction picked up in a number of Districts. San Francisco remained "anemic," while St. Louis and Kansas City reported decreased activity. Commercial real estate markets remained sluggish across most of the nation.
Hiring was generally subdued, but some firms with open positions reported difficulty finding qualified applicants. Wages and salaries remained stable across Districts, although some exceptions were noted. Overall price increases remained subdued, and some cost pressures were reported to have eased.
Essentially, the recovery continues but on a low trajectory. Strength was about as expected and there were no surprise weak spots.
On Wednesday of this past week, the Fed and other central banks announced measures to ease financial stress related to the euro zone's financial crisis. The Federal Reserve, European Central Bank, the Banks of England, Japan and Canada and the Swiss National Bank moved to buttress the financial system by increasing the availability of US dollars outside the United States with central bank liquidity swaps.
Under the plan, the foreign central bank sells a specified amount of its currency to the Federal Reserve in exchange for dollars at the prevailing market exchange rate. The Federal Reserve holds the foreign currency in an account at the foreign central bank. The dollars that the Federal Reserve provides are deposited in an account that the foreign central bank maintains at the Federal Reserve Bank of New York. At the same time, the Federal Reserve and the foreign central bank enter into a binding agreement for a second transaction that obligates the foreign central bank to buy back its currency on a specified future date at the same exchange rate. The Fed is not a counterparty to loans made to other parties by other central banks.
The liquidity swap arrangements are intended to lower the cost of borrowing in U.S. dollars so as to support bailout efforts in Europe and elsewhere. The ability of countries in Europe to constrain the impact of sovereign debt problems depends in part on the interest rates that the various countries must pay on debt. Higher rates reduce the ability to pay and reduce the ability to prevent contagion. Recently, interest rates in Europe have risen due to concern over contagion from sovereign debt problems.
The Banks announced that they would reduce the cost of existing dollar swap lines by 50 basis points to 0.5 percent from December 5th and said the loans would be available until February 2013. Many analysts believe that the central banks’ move is just a temporary fix to buy time, noting that the program does not address the root causes of the European crisis. The shortage of dollars in Europe results partly from the pullback of American money market funds, which cut their investments in European banks significantly.
Again, the U.S. economy is gaining strength but at a low trajectory. The big risk remains European sovereign debt.
This week's calendar is light. International trade (Thursday) and ISM nonmanufacturing index (Monday) are the main events of the week. However, investors also will eye factory orders (Monday) and the first reading of December consumer sentiment (Friday).
Factory orders in September rose 0.3 percent. New orders for nondurables, up a strong 1.0 percent, got a lift from petroleum and coal, products that are sensitive to price changes. The durables component was revised to minus 0.6 percent from an initial reading from the advance report of minus 0.8 percent. More recently, in the advance report, new factory orders for durables in October fell 0.7 percent, following a revised decline of 1.5 percent the prior month.
Factory orders Consensus Forecast for October 11: -0.3 percent
Range: -1.1 to +0.7 percent
The composite index from the ISM non-manufacturing survey was essentially unchanged in October at 52.9 versus 53.0 the prior month. Recent numbers have been above the breakeven reading of 50, indicating expansion but at a modest pace. Forward momentum also is modest as the new orders index slowed to 52.4 from September's 56.5 while backlog orders moved back to monthly contraction at a sub-50 reading of 47.0.
ISM non-manufacturing composite index Consensus Forecast for November 11: 53.9
Range: 51.5 to 54.6
Consumer credit outstanding expanded $7.4 billion in September benefiting once again from strength in nonrevolving credit. Nonrevolving credit outstanding, reflecting strong vehicle sales, rose $8.0 billion in the month to $1.662 trillion. This offsets another contraction in revolving credit, down $0.6 billion to $789.6 billion outstanding.
Consumer credit Consensus Forecast for October 11: +$7.5 billion
Range: -$5.0 billion to +$16.0 billion
Initial jobless claims in the shortened Thanksgiving November 26 week posted a 6,000 rise to 402,000. This ended three straight weeks under 400,000. The four-week average, which helps smooth out distortions in any one week, showed its first increase in five weeks, up a marginal 500 to 395,750. Continuing claims in data for the November 19 week rose 35,000 to 3.740 million which is the highest level in two months. The four-week average is up 12,000 to 3.683 million.
Jobless Claims Consensus Forecast for 12/3/11: 395,000
Range: 375,000 to 410,000
Wholesale inventories slipped 0.1 percent in September to show the first monthly draw in nearly two years. Underscoring the draw was a downward revision to the build in August to plus 0.1 percent from plus 0.4 percent. September's draw comes against a relatively healthy 0.5 percent rise in monthly sales at the wholesale level.
Wholesale inventories Consensus Forecast for October 11: +0.4 percent
Range: +0.2 to +0.9 percent
The U.S. international trade gap unexpectedly improved in September but a significant part of it appears to have been related to flight to safety to gold during September’s weak financial markets. The September trade gap shrank to $43.1 billion from $44.9 billion in August. Exports gained 1.4 percent after edging up 0.1 percent in August. September exports hit a record high level. Imports rose 0.3 percent in September, following a 0.2 percent decline the prior month. The improvement in the trade gap was led by the nonpetroleum goods gap which shrank to $31.5 billion from $33.9 billion in August. Exports of industrial supplies jumped $1.4 billion with $1.6 billion coming from nonmonetary gold. This was likely flight to safety with demand for gold up in the month. The petroleum gap worsened to $26.6 billion from $26.0 billion the prior month. The services surplus slipped to $15.8 billion from $16.0 billion in August.
International trade balance Consensus Forecast for October 11: -$43.4 billion
Range: -$45.2 billion to -$40.3 billion
The Reuter's/University of Michigan's consumer sentiment index held steady the last half of November, indicated by a full-month 64.1 composite reading that was little changed from 64.2 in the first half of the month. The current conditions component improved, up one point from mid-month to 77.6, though the expectations component, which is the composite's leading component, fell nearly one point to 55.4.
Consumer sentiment Consensus Forecast for preliminary December 11: 66.0
Range: 63.0 to 68.0
R. Mark Rogers is the author of The Complete Idiot’s Guide to Economic Indicators, Penguin Books, 2009.
Econoday Senior Writer Mark Pender contributed to this article.
|
