|
It was Europe just about all the time once again last week as markets moved to the cadence of the political machinations in Greece, Italy and the EU. After what seemed like inertia in Greece and Italy concerning their respective political leadership, both countries moved to replace their prime ministers. In Greece after several days of dithering, missed deadlines and public and private outrage, there finally is a new prime minister. On November 10th, Lucas Papademos, a former vice president of the European Central Bank, was named to replace George Papandreou, who had pledged to stand down four days earlier. Mr Papademos, an academic economist and a member of no political party, has the reputation that is reassuring to Greece’s bailout partners. His financial expertise should prove useful when it comes to implementing the complexities of the agreements reached with the EU and IMF.
There is also progress in Italy which is getting necessary reforms approved. On Friday, the Senate approved reforms to cut the budget deficit and liberalize the economy. It is expected that the Chamber of Deputies, or lower house of Parliament, will pass the measures over the weekend.
This sets the stage for the expected resignation of Silvio Berlusconi as prime minister and his replacement by an interim government. Italy’s president, Giorgio Napolitano is expected to name former EU commissioner Mario Monti to head an interim government, though last-minute changes remain a possibility in Italy's volatile political landscape. If Mr. Monti is tapped, he will come under immediate pressure from investors and European regulators to take steps, such as a wealth tax, to lower Italy's €1.9 trillion debt. Italy has also faced repeated calls to free up its restrictive labor market and make further cuts to red tape.
|
|
2010 |
2011 |
% Change |
|
Index |
Dec. 31 |
Nov 4 |
Nov 11 |
Week |
Year |
| Asia/Pacific |
|
|
|
|
|
|
| Australia |
All Ordinaries |
4846.9 |
4342.5 |
4358.6 |
0.4% |
-10.1% |
| Japan |
Nikkei 225 |
10228.9 |
8801.4 |
8514.5 |
-3.3% |
-16.8% |
|
Topix |
898.8 |
752.0 |
729.1 |
-3.0% |
-18.9% |
| Hong Kong |
Hang Seng |
23035.5 |
19842.8 |
19137.2 |
-3.6% |
-16.9% |
| S. Korea |
Kospi |
2051.0 |
1928.4 |
1863.5 |
-3.4% |
-9.1% |
| Singapore |
STI |
3190.0 |
2848.2 |
2790.9 |
-2.0% |
-12.5% |
| China |
Shanghai Composite |
2808.1 |
2528.3 |
2481.1 |
-1.9% |
-10.1% |
| |
|
|
|
|
|
|
| India |
Sensex 30 |
20509.1 |
17562.6 |
17192.8 |
-2.1% |
-16.2% |
| Indonesia |
Jakarta Composite |
3703.5 |
3783.6 |
3778.9 |
-0.1% |
2.0% |
| Malaysia |
KLCI |
1518.9 |
1477.5 |
1468.8 |
-0.6% |
-3.3% |
| Philippines |
PSEi |
4201.1 |
4271.7 |
4313.0 |
1.0% |
2.7% |
| Taiwan |
Taiex |
8972.5 |
7603.2 |
7367.3 |
-3.1% |
-17.9% |
| Thailand |
SET |
1032.8 |
957.3 |
971.0 |
1.4% |
-6.0% |
| |
|
|
|
|
|
|
| Europe |
|
|
|
|
|
|
| UK |
FTSE 100 |
5899.9 |
5527.2 |
5545.4 |
0.3% |
-6.0% |
| France |
CAC |
3804.8 |
3123.6 |
3149.4 |
0.8% |
-17.2% |
| Germany |
XETRA DAX |
6914.2 |
5966.2 |
6057.0 |
1.5% |
-12.4% |
| Italy |
FTSE MIB |
20173.3 |
15346.6 |
15778.9 |
2.8% |
-21.8% |
| Spain |
IBEX 35 |
9859.1 |
8596.4 |
8556.1 |
-0.5% |
-13.2% |
| Sweden |
OMX Stockholm 30 |
1155.6 |
987.2 |
976.5 |
-1.1% |
-15.5% |
| Switzerland |
SMI |
6436.0 |
5659.8 |
5649.0 |
-0.2% |
-12.2% |
| |
|
|
|
|
|
|
| North America |
|
|
|
|
|
|
| United States |
Dow |
11577.5 |
11983.2 |
12153.7 |
1.4% |
5.0% |
|
NASDAQ |
2652.9 |
2686.2 |
2678.8 |
-0.3% |
1.0% |
|
S&P 500 |
1257.6 |
1253.2 |
1263.9 |
0.8% |
0.5% |
| Canada |
S&P/TSX Comp. |
13443.2 |
12408.3 |
12276.9 |
-1.1% |
-8.7% |
| Mexico |
Bolsa |
38550.8 |
36689.4 |
37555.7 |
2.4% |
-2.6% |
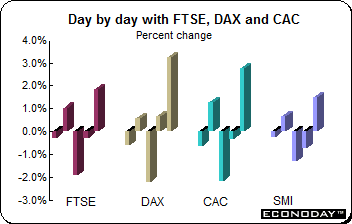 With Friday’s boost from Italy’s Senate approving an austerity package, most equities managed to turn a negative week into a positive one. The approval elevated optimism that the country will contain its debt crisis. Investors were optimistic that the vote will be followed by a new government led by former European Union Competition Commissioner Mario Monti as soon as Monday. The FTSE was up 0.3 percent, the CAC gained 0.8 percent while the DAX was 1.5 percent higher. Although Swiss stocks rallied on Friday, they could not recoup earlier losses, slipping 0.2 percent on the week. Italian equities jumped 2.8 percent. With Friday’s boost from Italy’s Senate approving an austerity package, most equities managed to turn a negative week into a positive one. The approval elevated optimism that the country will contain its debt crisis. Investors were optimistic that the vote will be followed by a new government led by former European Union Competition Commissioner Mario Monti as soon as Monday. The FTSE was up 0.3 percent, the CAC gained 0.8 percent while the DAX was 1.5 percent higher. Although Swiss stocks rallied on Friday, they could not recoup earlier losses, slipping 0.2 percent on the week. Italian equities jumped 2.8 percent.
Friday’s exuberance was a far cry from Wednesday’s plunge as signs of political progress in Italy and Greece — for the moment at least — put worries about both countries' debt burdens aside. On Friday, former European Central Bank Vice President Lucas Papademos was sworn in as Greece's interim prime minister. And there are signs that Italy is heading closer to a national unity government, most likely headed up by Mario Monti.
Bank of England
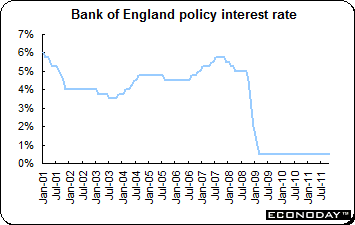 As expected the Bank of England’s monetary policy committee left its key interest rate at 0.5 percent and maintained the size of its asset purchase program at £275 billion. The BoE had increased its QE target by £75 billion to £275 billion in October. Britain’s economic recovery is tightly linked to developments in Europe. The Eurozone is Britain’s biggest export market. The Bank will be releasing its quarterly Inflation Report on Wednesday which will give Bank watchers a window on the MPC’s thinking. At that time, the BoE is expected to lower growth projections. The Bank will also publish new inflation forecasts at that time. Consumer prices jumped 5.2 percent on the year in September — more than twice the Bank’s 2 percent target. However, forecasts say that inflation will be dropping sharply in 2012. As expected the Bank of England’s monetary policy committee left its key interest rate at 0.5 percent and maintained the size of its asset purchase program at £275 billion. The BoE had increased its QE target by £75 billion to £275 billion in October. Britain’s economic recovery is tightly linked to developments in Europe. The Eurozone is Britain’s biggest export market. The Bank will be releasing its quarterly Inflation Report on Wednesday which will give Bank watchers a window on the MPC’s thinking. At that time, the BoE is expected to lower growth projections. The Bank will also publish new inflation forecasts at that time. Consumer prices jumped 5.2 percent on the year in September — more than twice the Bank’s 2 percent target. However, forecasts say that inflation will be dropping sharply in 2012.
EU downgrades growth forecast
In its semiannual forecast, European Commission said that the economy is struggling against weak confidence, financial turmoil, government austerity packages and a slowdown in Europe's main trading partners. The EU expects 2012 gross domestic product to grow just 0.6 percent, sharply down from its forecast six months ago of 1.9 percent. The commission's forecast for the Eurozone is 0.5 percent in 2012, also falling short of the May outlook of 1.8 percent growth. Unemployment is expected to increase slightly next year, to 10.1 percent from 10 percent in 2011. The EU's spring forecast predicted unemployment would fall to 9.7 percent in 2012.
The commission expects the already broad economic disparities between member countries to grow next year. The German economy should expand 2.9 percent this year and 0.8 percent in 2012, with an unemployment rate falling to just 5.9 percent next year. At the other end of the spectrum, the Portuguese economy is expected to contract 3.0 percent next year, with an unemployment rate of nearly 14 percent. Greece is expected to shrink 5.5 percent this year and 2.8 percent next year. The country's unemployment rate is seen jumping next year to 18.4 percent, significantly above the commission's previous forecast of 15.3 percent. Italy's problems are expected to continue, with growth expected to be only 0.1 percent, down sharply from the spring forecast of 1.3 percent. France is expected to grow 0.6 percent next year with unemployment inching up to 10 percent.
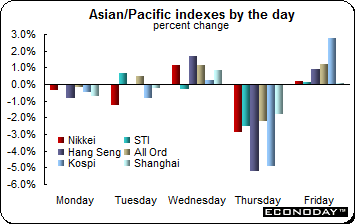 Most equity indexes were down last week, with the steepest declines occurring on Thursday in midst of a rush to safety. While most rebounded on Friday, it was too little and too late to save the week’s results. Losses ranged from 3.6 percent (Hang Seng), 3.4 percent (Kospi) and 3.3 percent (Nikkei) to 0.1 percent (Jakarta Composite). However, the SET, PSEi and All Ordinaries advanced 1.4 percent, 1.0 percent and 0.4 percent respectively. Equity indexes here tended to follow leads from U.S. and European trading. The root cause of the volatility not surprisingly is found in the uncertainty surrounding the European sovereign debt crisis. Thursday’s plunge stemmed from fears regarding Italy's debt crisis and a deadlock in talks on forming a new Greek government. Weaker than expected data on Japanese core machinery orders and Chinese merchandise trade also curbed appetite for risk. Most equity indexes were down last week, with the steepest declines occurring on Thursday in midst of a rush to safety. While most rebounded on Friday, it was too little and too late to save the week’s results. Losses ranged from 3.6 percent (Hang Seng), 3.4 percent (Kospi) and 3.3 percent (Nikkei) to 0.1 percent (Jakarta Composite). However, the SET, PSEi and All Ordinaries advanced 1.4 percent, 1.0 percent and 0.4 percent respectively. Equity indexes here tended to follow leads from U.S. and European trading. The root cause of the volatility not surprisingly is found in the uncertainty surrounding the European sovereign debt crisis. Thursday’s plunge stemmed from fears regarding Italy's debt crisis and a deadlock in talks on forming a new Greek government. Weaker than expected data on Japanese core machinery orders and Chinese merchandise trade also curbed appetite for risk.
At its meeting Friday, the Bank of Korea kept its interest rate unchanged at 3.25 percent for the fourth straight month after unexpectedly increasing it by 25 basis points at its June meeting. Analysts had widely expected no change after October consumer prices were up 3.9 percent on the year, putting overall inflation within the central bank's target range of 2 percent to 4 percent for the first time this year.
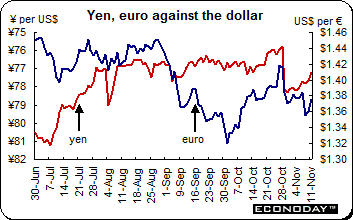 The dollar was mixed against its major counterparts last week. The euro, despite its volatility during the week, managed to regain virtually most of its losses on renewed optimism that European leaders are taking steps to contain the region’s sovereign debt crisis. The euro steadied and advanced as former European Central Bank Vice President Lucas Papademos was sworn in as prime minster of Greece and as Italy’s Senate approved a debt-cutting bill on Friday. The dollar was mixed against its major counterparts last week. The euro, despite its volatility during the week, managed to regain virtually most of its losses on renewed optimism that European leaders are taking steps to contain the region’s sovereign debt crisis. The euro steadied and advanced as former European Central Bank Vice President Lucas Papademos was sworn in as prime minster of Greece and as Italy’s Senate approved a debt-cutting bill on Friday.
The yen reached its highest level against the dollar since Japan intervened on October 31st to weaken it. Japan’s Finance Minister Jun Azumi said that he is on guard against speculative yen trades while declining to comment on whether the nation has been selling the currency this month. Japan sold the yen after it reached a post-World War II high of ¥75.35 per dollar. It is estimated that Japan sold ¥8 trillion that day, based on changes in the Bank of Japan’s balance sheet.
Selected currencies — weekly results
|
|
2010 |
2011 |
% Change |
|
|
Dec 31 |
Nov 4 |
Nov 11 |
Week |
2011 |
| U.S. $ per currency |
|
|
|
|
|
|
| Australia |
A$ |
1.022 |
1.039 |
1.028 |
-1.0% |
0.6% |
| New Zealand |
NZ$ |
0.779 |
0.795 |
0.786 |
-1.2% |
0.9% |
| Canada |
C$ |
1.003 |
0.984 |
0.988 |
0.5% |
-1.4% |
| Eurozone |
euro (€) |
1.337 |
1.377 |
1.375 |
-0.2% |
2.8% |
| UK |
pound sterling (£) |
1.560 |
1.603 |
1.608 |
0.3% |
3.1% |
| |
|
|
|
|
|
|
| Currency per U.S. $ |
|
|
|
|
|
|
| China |
yuan |
6.607 |
6.340 |
6.342 |
0.0% |
4.2% |
| Hong Kong |
HK$* |
7.773 |
7.768 |
7.777 |
-0.1% |
-0.1% |
| India |
rupee |
44.705 |
49.111 |
50.115 |
-2.0% |
-10.8% |
| Japan |
yen |
81.230 |
78.204 |
77.114 |
1.4% |
5.3% |
| Malaysia |
ringgit |
3.064 |
3.114 |
3.142 |
-0.9% |
-2.5% |
| Singapore |
Singapore $ |
1.283 |
1.265 |
1.280 |
-1.2% |
0.2% |
| South Korea |
won |
1126.000 |
1110.700 |
1126.610 |
-1.4% |
-0.1% |
| Taiwan |
Taiwan $ |
29.299 |
30.023 |
30.185 |
-0.5% |
-2.9% |
| Thailand |
baht |
30.060 |
30.645 |
30.770 |
-0.4% |
-2.3% |
| Switzerland |
Swiss franc |
0.934 |
0.886 |
0.901 |
-1.7% |
3.6% |
| *Pegged to U.S. dollar |
|
|
|
|
|
|
| Source: Bloomberg |
|
|
|
|
|
|
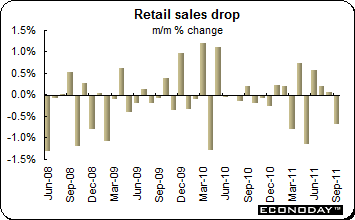 September retail sales dropped 0.7 percent on the month and were 1.5 percent lower on the year. Purchases of food & drink were unchanged. Non-fuel sales excluding food were down 0.8 percent from mid-quarter when they dropped 0.1 percent. The September fall in overall sales essentially wiped out the gains made in July and August and made for an unchanged quarterly level when compared with the previous period when demand was off 0.3 percent. German retail demand grew 0.4 percent on the month but France (down 0.6 percent) and Spain (down 1.7 percent) registered declines. September retail sales dropped 0.7 percent on the month and were 1.5 percent lower on the year. Purchases of food & drink were unchanged. Non-fuel sales excluding food were down 0.8 percent from mid-quarter when they dropped 0.1 percent. The September fall in overall sales essentially wiped out the gains made in July and August and made for an unchanged quarterly level when compared with the previous period when demand was off 0.3 percent. German retail demand grew 0.4 percent on the month but France (down 0.6 percent) and Spain (down 1.7 percent) registered declines.
 September industrial production dropped a sizable 2.7 percent on the month following a smaller revised 0.4 percent contraction in August. The latest decline left output 5.4 percent higher than a year ago. Only consumer goods (1.1 percent) among the major sub-sectors show increasing output from August. The capital goods area (down 4.7 percent) was especially soft and intermediates (down 2.8 percent) were not much better. At the same time, energy slid 0.7 percent and construction was down 0.8 percent. Total manufacturing was off a sizeable 3.0 percent. September industrial production dropped a sizable 2.7 percent on the month following a smaller revised 0.4 percent contraction in August. The latest decline left output 5.4 percent higher than a year ago. Only consumer goods (1.1 percent) among the major sub-sectors show increasing output from August. The capital goods area (down 4.7 percent) was especially soft and intermediates (down 2.8 percent) were not much better. At the same time, energy slid 0.7 percent and construction was down 0.8 percent. Total manufacturing was off a sizeable 3.0 percent.
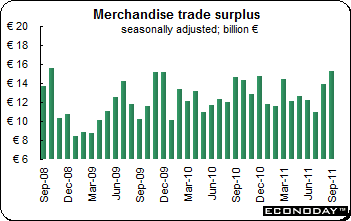 September seasonally adjusted merchandise trade surplus widened out to €15.2 billion from a marginally upwardly revised €13.9 billion in August. The unadjusted surplus was €17.4 billion. The latest improvement, which saw the adjusted black ink hit a 39-month high, was due to a 0.9 percent monthly rise in nominal exports combined with a 0.8 percent decline in imports, their second successive monthly fall. Annual growth of exports was 10.5 percent and of imports, 11.6 percent. September seasonally adjusted merchandise trade surplus widened out to €15.2 billion from a marginally upwardly revised €13.9 billion in August. The unadjusted surplus was €17.4 billion. The latest improvement, which saw the adjusted black ink hit a 39-month high, was due to a 0.9 percent monthly rise in nominal exports combined with a 0.8 percent decline in imports, their second successive monthly fall. Annual growth of exports was 10.5 percent and of imports, 11.6 percent.
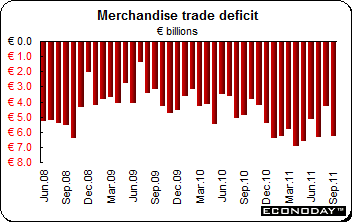 September seasonally adjusted merchandise trade gap widened to €6.3 billion in September. However, the deterioration from a smaller revised €4.3 billion shortfall in August left the quarterly red ink at €17.0 billion, down nearly 10 percent from the previous period. The data reflected a 5.9 percent monthly slump in exports as shipments of aircraft fell back from their August surge. Imports slipped just 0.6 percent but a more substantial decline in purchases of industrial goods was largely masked by a bounce in energy. September seasonally adjusted merchandise trade gap widened to €6.3 billion in September. However, the deterioration from a smaller revised €4.3 billion shortfall in August left the quarterly red ink at €17.0 billion, down nearly 10 percent from the previous period. The data reflected a 5.9 percent monthly slump in exports as shipments of aircraft fell back from their August surge. Imports slipped just 0.6 percent but a more substantial decline in purchases of industrial goods was largely masked by a bounce in energy.
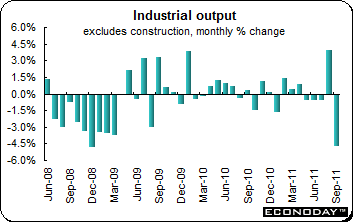
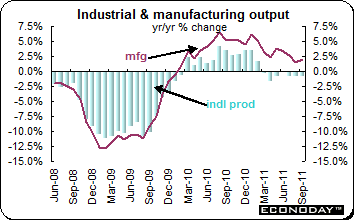
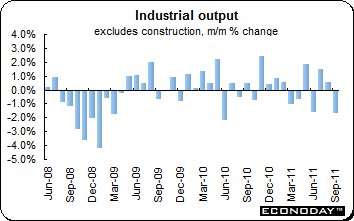 September industrial output (excluding construction) fell 1.7 percent on the month, nearly reversing the combined gains of July and August. Annual growth dropped more than 2 percentage points to 2.3 percent, matching its weakest pace since June. Manufacturing output dropped 1.6 percent on the month led by declines in electronics & machines (3.1 percent), refining (1.3 percent) and the other manufactured goods category (1.9 percent). There was also a minor drop in the transport equipment area (0.2 percent). Weakness here was compounded in the total output figures by a 2.4 percent slump in energy & extracted goods and a 5.8 percent nosedive in construction. September industrial output (excluding construction) fell 1.7 percent on the month, nearly reversing the combined gains of July and August. Annual growth dropped more than 2 percentage points to 2.3 percent, matching its weakest pace since June. Manufacturing output dropped 1.6 percent on the month led by declines in electronics & machines (3.1 percent), refining (1.3 percent) and the other manufactured goods category (1.9 percent). There was also a minor drop in the transport equipment area (0.2 percent). Weakness here was compounded in the total output figures by a 2.4 percent slump in energy & extracted goods and a 5.8 percent nosedive in construction.
 September industrial output plunged 4.8 percent after a surprising revised 3.9 percent spurt in August. On the year, output was down 1.9 percent. Outside of energy where output actually rose 0.2 percent on the month, weakness was broad-based. Consumer goods declined 5.1 percent on the month (durables down 8.3 percent), capital goods were down 5.2 percent and intermediates 2.4 percent lower. For the quarter as a whole, industrial production only fell 0.1 percent but in the absence of the August bounce, the only monthly gain since April, the decline would have been much steeper. September industrial output plunged 4.8 percent after a surprising revised 3.9 percent spurt in August. On the year, output was down 1.9 percent. Outside of energy where output actually rose 0.2 percent on the month, weakness was broad-based. Consumer goods declined 5.1 percent on the month (durables down 8.3 percent), capital goods were down 5.2 percent and intermediates 2.4 percent lower. For the quarter as a whole, industrial production only fell 0.1 percent but in the absence of the August bounce, the only monthly gain since April, the decline would have been much steeper.
 September industrial production was unchanged on the month and down 0.7 percent on the year. Manufacturing output edged up 0.2 percent and 2.0 percent on the year. The modest monthly gain in manufacturing was largely attributable to the transport equipment industry where output jumped 3.9 percent, and basic metals & metal products which saw a 1.9 percent advance. In all, six of the 13 reporting sub-sectors posted increases. However, expansion here was almost offset by declines in five sub-sectors, among which food & drink was down 2.0 percent and computer, electrical & optical industries off 3.3 percent. Total industrial production was held in check by a 0.9 percent monthly decline in mining & quarrying with the oil & gas extraction industries down 1.7 percent on the back of oil rig maintenance. There was also a 0.5 percent slide in utilities but water supply & waste management rose 0.9 percent. September industrial production was unchanged on the month and down 0.7 percent on the year. Manufacturing output edged up 0.2 percent and 2.0 percent on the year. The modest monthly gain in manufacturing was largely attributable to the transport equipment industry where output jumped 3.9 percent, and basic metals & metal products which saw a 1.9 percent advance. In all, six of the 13 reporting sub-sectors posted increases. However, expansion here was almost offset by declines in five sub-sectors, among which food & drink was down 2.0 percent and computer, electrical & optical industries off 3.3 percent. Total industrial production was held in check by a 0.9 percent monthly decline in mining & quarrying with the oil & gas extraction industries down 1.7 percent on the back of oil rig maintenance. There was also a 0.5 percent slide in utilities but water supply & waste management rose 0.9 percent.
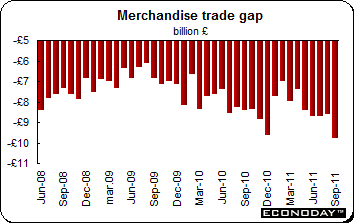 September deficit on merchandise trade widened sharply from a significantly larger revised Stg8.6 billion in August to a record Stg9.8 billion in September. The deterioration reflected a 3.8 percent surge in imports easily eclipsing a minimal 0.2 percent increase in exports. Moreover, the bad news could not be attributed to swings in the more volatile categories since even excluding oil & erratics, the red ink grew from Stg7.6 billion last time to Stg8.4 billion. The damage was widespread with the bilateral deficit with the EU up more than Stg0.6 billion to Stg4.1 billion and the gap with the rest of the world also Stg0.6 billion wider at Stg5.7 billion. September deficit on merchandise trade widened sharply from a significantly larger revised Stg8.6 billion in August to a record Stg9.8 billion in September. The deterioration reflected a 3.8 percent surge in imports easily eclipsing a minimal 0.2 percent increase in exports. Moreover, the bad news could not be attributed to swings in the more volatile categories since even excluding oil & erratics, the red ink grew from Stg7.6 billion last time to Stg8.4 billion. The damage was widespread with the bilateral deficit with the EU up more than Stg0.6 billion to Stg4.1 billion and the gap with the rest of the world also Stg0.6 billion wider at Stg5.7 billion.
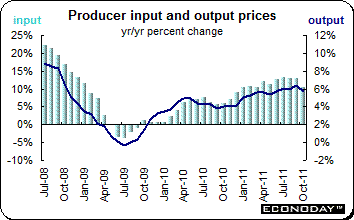 October producer output prices were flat on the month and up 4.6 percent on the year. Input prices were down 0.8 percent but still 14.1 percent higher on the year. Within the monthly decline in overall output prices, chemicals (down 0.7 percent) were especially weak but a number of other categories also saw prices decline. Food, up 0.4 percent, posted the largest gain. The core index dipped 0.1 percent and was up 3.4 percent on the year. Input costs were driven lower by sharply weaker crude oil and imported metals prices which together accounted for the entire monthly headline drop. However, outside of fuel where prices jumped 3.5 percent on the month, all the sub-sectors were well behaved. October producer output prices were flat on the month and up 4.6 percent on the year. Input prices were down 0.8 percent but still 14.1 percent higher on the year. Within the monthly decline in overall output prices, chemicals (down 0.7 percent) were especially weak but a number of other categories also saw prices decline. Food, up 0.4 percent, posted the largest gain. The core index dipped 0.1 percent and was up 3.4 percent on the year. Input costs were driven lower by sharply weaker crude oil and imported metals prices which together accounted for the entire monthly headline drop. However, outside of fuel where prices jumped 3.5 percent on the month, all the sub-sectors were well behaved.
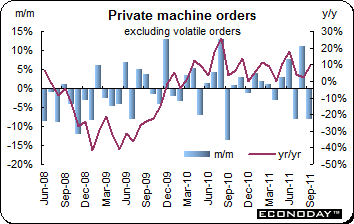 September core private sector machine orders excluding volatile items sank a more than expected 8.5 percent on the month. Analysts were anticipating a decline of 7.5 percent. On the year, orders were up 9.6 percent. Core private sector machinery orders, which exclude volatile demand from electric utilities and for ships, are viewed as a leading indicator of corporate capital investment. Even excluding these items, orders have been volatile on a month to month basis. Manufacturing orders plunged 17.5 percent after jumping 13.7 percent in the previous month while nonmanufacturing orders rebounded 8.5 percent after declining 6.1 percent in august. After soaring 32.3 percent in August, orders from overseas dropped 21.7 percent in September. September core private sector machine orders excluding volatile items sank a more than expected 8.5 percent on the month. Analysts were anticipating a decline of 7.5 percent. On the year, orders were up 9.6 percent. Core private sector machinery orders, which exclude volatile demand from electric utilities and for ships, are viewed as a leading indicator of corporate capital investment. Even excluding these items, orders have been volatile on a month to month basis. Manufacturing orders plunged 17.5 percent after jumping 13.7 percent in the previous month while nonmanufacturing orders rebounded 8.5 percent after declining 6.1 percent in august. After soaring 32.3 percent in August, orders from overseas dropped 21.7 percent in September.
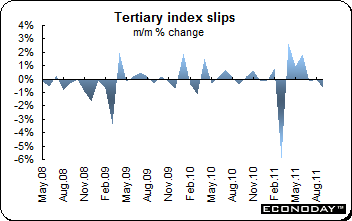 September tertiary index was down a larger than expected 0.7 percent and 0.3 percent lower on the year. Analysts expected a monthly decline of 0.5 percent. Wholesale & retail trade dropped 2.2 percent while information & communications dropped 2.6 percent. Finance & insurance was down 1.0 percent and miscellaneous services except government were down 1.5 percent. Other industry groupings that declined were living related & personal services & amusement services, transport & postal activities and real estate & goods rental & leasing. Industrial that increased in September included scientific research, professional & technical services (up 3.1 percent), medical, health care & welfare (up 0.6 percent), electricity, gas, heat supply & water (up1.1 percent), accommodations, eating & drinking services (0.8 percent), compound services (up 10.1 percent and learning support (up 0.3 percent). September tertiary index was down a larger than expected 0.7 percent and 0.3 percent lower on the year. Analysts expected a monthly decline of 0.5 percent. Wholesale & retail trade dropped 2.2 percent while information & communications dropped 2.6 percent. Finance & insurance was down 1.0 percent and miscellaneous services except government were down 1.5 percent. Other industry groupings that declined were living related & personal services & amusement services, transport & postal activities and real estate & goods rental & leasing. Industrial that increased in September included scientific research, professional & technical services (up 3.1 percent), medical, health care & welfare (up 0.6 percent), electricity, gas, heat supply & water (up1.1 percent), accommodations, eating & drinking services (0.8 percent), compound services (up 10.1 percent and learning support (up 0.3 percent).
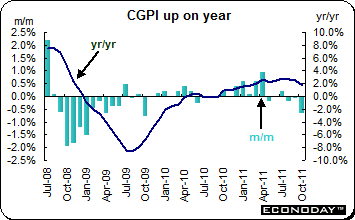 October corporate goods price index was down 0.7 percent on the month and up 1.7 percent on the year. The annual increase was the 13 consecutive gain. The CGPI was up 2.5 percent in September. On the year, manufacturing prices were up 1.5 percent after jumping a revised 2.4 percent the month before. Electric power, gas & water prices were up 7.1 percent after 5.2 percent in September. Within manufacturing, petroleum and coal prices were up 12.8 percent on the year after jumping 17.2 percent last time. Information & communication equipment dropped 7.4 percent after sliding 7.3 percent in September. Domestic sales of audio and visual electronic appliances continue to dwindle after many consumers rushed to buy digital TVs before July 24, when Japan terminated analogue broadcasting services. October corporate goods price index was down 0.7 percent on the month and up 1.7 percent on the year. The annual increase was the 13 consecutive gain. The CGPI was up 2.5 percent in September. On the year, manufacturing prices were up 1.5 percent after jumping a revised 2.4 percent the month before. Electric power, gas & water prices were up 7.1 percent after 5.2 percent in September. Within manufacturing, petroleum and coal prices were up 12.8 percent on the year after jumping 17.2 percent last time. Information & communication equipment dropped 7.4 percent after sliding 7.3 percent in September. Domestic sales of audio and visual electronic appliances continue to dwindle after many consumers rushed to buy digital TVs before July 24, when Japan terminated analogue broadcasting services.
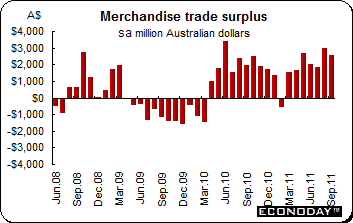 September seasonally adjusted goods and services international trade balance was a surplus of A$2,564 million, down from the August surplus of A$2.953 million. Exports were down 1.3 percent on the month and up 10.7 percent on the year. Imports also were down on the month, dropping 2.5 percent but rising 12.3 percent on the year. Exports of non-monetary gold dropped A$411 million (24 percent) and non-rural goods were down A$295 million (2 percent). Rural goods were up A$45 million (2 percent). Services fell A$52 million (1 percent). Imports of intermediate and other merchandise goods declined A$460 million (5 percent) while consumption goods were down A$155 million (3 percent). Capital goods gained A$302 million (6 percent) and non-monetary gold was up A$39 million (7 percent). Services were down A$47 million (1 percent). September seasonally adjusted goods and services international trade balance was a surplus of A$2,564 million, down from the August surplus of A$2.953 million. Exports were down 1.3 percent on the month and up 10.7 percent on the year. Imports also were down on the month, dropping 2.5 percent but rising 12.3 percent on the year. Exports of non-monetary gold dropped A$411 million (24 percent) and non-rural goods were down A$295 million (2 percent). Rural goods were up A$45 million (2 percent). Services fell A$52 million (1 percent). Imports of intermediate and other merchandise goods declined A$460 million (5 percent) while consumption goods were down A$155 million (3 percent). Capital goods gained A$302 million (6 percent) and non-monetary gold was up A$39 million (7 percent). Services were down A$47 million (1 percent).
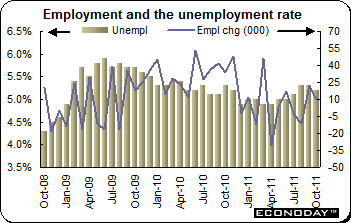 October employment was up by 10,100 jobs as expected after adding a revised 22,500 jobs in September. The increase in employment was driven by full-time employment, up 20,000 people to 8,067,500, and was offset by a decline in part time employment, down 9,900 people to 3,394,800. The seasonally adjusted unemployment rate edged down to 5.2 percent from 5.3 percent in September. The number of people unemployed decreased by 5,700 people to 630,800. he labor force participation rate was 65.6 percent. October employment was up by 10,100 jobs as expected after adding a revised 22,500 jobs in September. The increase in employment was driven by full-time employment, up 20,000 people to 8,067,500, and was offset by a decline in part time employment, down 9,900 people to 3,394,800. The seasonally adjusted unemployment rate edged down to 5.2 percent from 5.3 percent in September. The number of people unemployed decreased by 5,700 people to 630,800. he labor force participation rate was 65.6 percent.
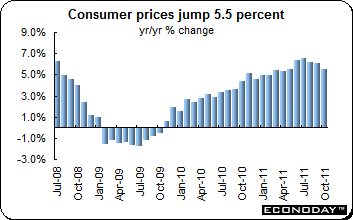 October consumer inflation cooled to 5.5 percent when compared with a year ago from 6.1 percent in September. For the 10 months through October, the CPI was up 5.6 percent. On the month, the CPI edged up 0.1 percent. The Urban CPI was up 5.4 percent while rural prices jumped 5.9 percent, both on the year. Food prices are still recording double digit increases but at a somewhat reduced pace. They were up 11.9 percent after September’s 13.4 percent. Other price increases were more subdued. Non-food prices were up 2.7 percent after climbing 2.9 percent in September and 3.0 percent in August. Both clothing and tobacco & alcohol were up 3.7 percent on the year. Household facilities and health care were up 3.1 percent and 3.5 percent respectively. Housing costs continued to ease – they were up 4.4 percent. October consumer inflation cooled to 5.5 percent when compared with a year ago from 6.1 percent in September. For the 10 months through October, the CPI was up 5.6 percent. On the month, the CPI edged up 0.1 percent. The Urban CPI was up 5.4 percent while rural prices jumped 5.9 percent, both on the year. Food prices are still recording double digit increases but at a somewhat reduced pace. They were up 11.9 percent after September’s 13.4 percent. Other price increases were more subdued. Non-food prices were up 2.7 percent after climbing 2.9 percent in September and 3.0 percent in August. Both clothing and tobacco & alcohol were up 3.7 percent on the year. Household facilities and health care were up 3.1 percent and 3.5 percent respectively. Housing costs continued to ease – they were up 4.4 percent.
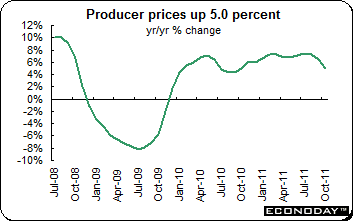 October producer prices were up 5.0 percent after jumping 6.5 percent in September and 7.3 percent in August. For the 10 months through October, the PPI jumped 6.8 percent after increasing 7.0 percent in September. On the month, producer prices slid 0.7 percent. Prices continue to show an easing trend in all sub-categories. Raw materials were up 8.0 percent on the year after increasing 10.0 percent in September. Production materials show the same trend, increasing 15.1 percent after 17.2 percent the month before. Consumer goods prices eased to an increase of 4.2 percent after 4.6 percent last time. Fuel & power prices were up 11.3 percent after 12.3 percent last month. October producer prices were up 5.0 percent after jumping 6.5 percent in September and 7.3 percent in August. For the 10 months through October, the PPI jumped 6.8 percent after increasing 7.0 percent in September. On the month, producer prices slid 0.7 percent. Prices continue to show an easing trend in all sub-categories. Raw materials were up 8.0 percent on the year after increasing 10.0 percent in September. Production materials show the same trend, increasing 15.1 percent after 17.2 percent the month before. Consumer goods prices eased to an increase of 4.2 percent after 4.6 percent last time. Fuel & power prices were up 11.3 percent after 12.3 percent last month.
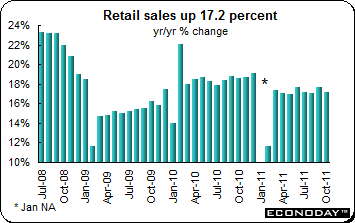 October retail sales were up 1.3 percent on the month and 17.2 percent on the year. The annual rate was down 0.5 percentage points from the pace registered in September. Over the first 10 months of the year, demand was up 17.0 percent. The slowdown in sales growth reversed most of the bounce seen in September but the 12-month expansion rate still matched that seen in July. Urban sales slipped 0.6 percentage points to a 17.2 percent annual rate but rural purchases edged up a tick to 17.4 percent. A particularly marked deceleration was noted in clothing (19.5 percent after 27.6 percent) and growth also eased significantly in home appliances & cosmetics (15.3 percent from 19.5 percent) and autos (12.6 percent from 18.7 percent). However, spending on sports & recreation jumped 1.3 percent to 9.8 percent. October retail sales were up 1.3 percent on the month and 17.2 percent on the year. The annual rate was down 0.5 percentage points from the pace registered in September. Over the first 10 months of the year, demand was up 17.0 percent. The slowdown in sales growth reversed most of the bounce seen in September but the 12-month expansion rate still matched that seen in July. Urban sales slipped 0.6 percentage points to a 17.2 percent annual rate but rural purchases edged up a tick to 17.4 percent. A particularly marked deceleration was noted in clothing (19.5 percent after 27.6 percent) and growth also eased significantly in home appliances & cosmetics (15.3 percent from 19.5 percent) and autos (12.6 percent from 18.7 percent). However, spending on sports & recreation jumped 1.3 percent to 9.8 percent.
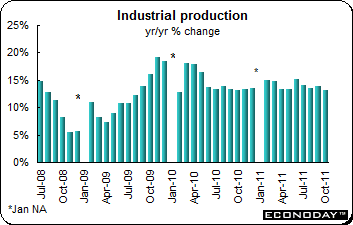 October industrial production growth slowed to 13.2 percent, the weakest in a year. The monthly advance was 0.9 percent. Most sub-sectors saw activity rates ease with steel products (13.4 percent after 18.8 percent) especially badly hit. Communication (15.6 percent after 17.7 percent) also fared badly as did ferrous metals (10.7 percent after 13.6 percent). However, going against the trend, the annual growth rate of general equipment output picked up more than a percentage point to 15.8 percent. October industrial production growth slowed to 13.2 percent, the weakest in a year. The monthly advance was 0.9 percent. Most sub-sectors saw activity rates ease with steel products (13.4 percent after 18.8 percent) especially badly hit. Communication (15.6 percent after 17.7 percent) also fared badly as did ferrous metals (10.7 percent after 13.6 percent). However, going against the trend, the annual growth rate of general equipment output picked up more than a percentage point to 15.8 percent.
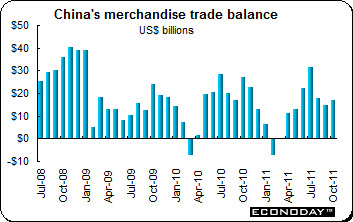 October unadjusted merchandise trade surplus was $17.0 billion, substantially lower than the $24.1 billion surplus expected by analysts. Unadjusted exports were up 15.9 percent on the year while imports surged 28.7 percent. For the 10 months through October, the surplus was $124.03 billion, substantially lower than the $147.78 billion in 2010. Exports for the 10 months were up 22.0 percent on the year while imports were 26.9 percent higher. On a seasonally adjust basis, exports were down 1.4 percent on the month while imports were 3.2 percent higher. Seasonally adjusted exports were 14.4 percent higher on the year while imports gained 22.4 percent. October unadjusted merchandise trade surplus was $17.0 billion, substantially lower than the $24.1 billion surplus expected by analysts. Unadjusted exports were up 15.9 percent on the year while imports surged 28.7 percent. For the 10 months through October, the surplus was $124.03 billion, substantially lower than the $147.78 billion in 2010. Exports for the 10 months were up 22.0 percent on the year while imports were 26.9 percent higher. On a seasonally adjust basis, exports were down 1.4 percent on the month while imports were 3.2 percent higher. Seasonally adjusted exports were 14.4 percent higher on the year while imports gained 22.4 percent.
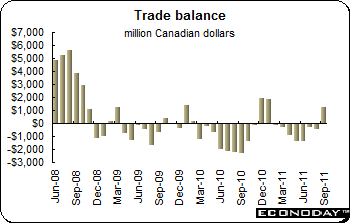 September seasonally adjusted merchandise trade balance returned a surprise surplus of C$1.25 billion, a sharp turnaround from a slightly smaller revised C$0.5 billion deficit in August. This was the first surplus since January 2011. Nominal exports were up 4.2 percent and are 20.3 percent higher on the year. Cash imports fared rather worse, posting a 0.3 percent drop and are now just 8.9 percent firmer than in September 2010. Moreover, the good news on the nominal account was in large part reflected in the real trade position. Although export volumes were up just 0.3 percent on the month, imports were off 3.1 percent. Behind the improvement in the headline was a sharp widening in the bilateral surplus with the U.S which, at C$4.4 billion, was nearly C$1.6 billion larger than last time. A 5 percent monthly jump in exports was largely responsible. Among the main commodity groupings, exports of energy were up 11.3 percent on the month following the reopening of refineries after several months of maintenance. In addition, autos were up 5.6 percent and the other consumer goods category, 6.5 percent. Industrial goods & materials grew 3.4 percent and forestry products, 4.3 percent. Imports were depressed by monthly declines in autos (5.5 percent), machinery & equipment (3.3 percent) and agriculture & fishing products (1.6 percent). However, support was found in energy (5.7 percent), forestry products (5.7 percent) and industrial goods & materials (2.6 percent). September seasonally adjusted merchandise trade balance returned a surprise surplus of C$1.25 billion, a sharp turnaround from a slightly smaller revised C$0.5 billion deficit in August. This was the first surplus since January 2011. Nominal exports were up 4.2 percent and are 20.3 percent higher on the year. Cash imports fared rather worse, posting a 0.3 percent drop and are now just 8.9 percent firmer than in September 2010. Moreover, the good news on the nominal account was in large part reflected in the real trade position. Although export volumes were up just 0.3 percent on the month, imports were off 3.1 percent. Behind the improvement in the headline was a sharp widening in the bilateral surplus with the U.S which, at C$4.4 billion, was nearly C$1.6 billion larger than last time. A 5 percent monthly jump in exports was largely responsible. Among the main commodity groupings, exports of energy were up 11.3 percent on the month following the reopening of refineries after several months of maintenance. In addition, autos were up 5.6 percent and the other consumer goods category, 6.5 percent. Industrial goods & materials grew 3.4 percent and forestry products, 4.3 percent. Imports were depressed by monthly declines in autos (5.5 percent), machinery & equipment (3.3 percent) and agriculture & fishing products (1.6 percent). However, support was found in energy (5.7 percent), forestry products (5.7 percent) and industrial goods & materials (2.6 percent).
Markets were highly volatile last week with equities gyrating between losses and gains mostly on news reports on the progress or lack there of in Greece and Italy. Europe’s equities managed a Friday rally to bring the week to a positive close. Despite the euro’s swings against the U.S. dollar, the currency was virtually unchanged on the week. Economic data from Europe were dismal while in the Asia Pacific region it was mixed. The U.S. released little new economic information — but what was released was positive.
The Bank of Japan meets this week — no policy change is anticipated. The Reserve Bank of Australia will release the minutes of its November meeting. RBA watchers will be looking for the reasons for the interest rate cut. The Bank of England releases its quarterly Inflation Report, which will include its updated projections for growth and inflation. The U.S. will make up for the lack of economic data last week with a plate full this week.
| Central Bank activities |
|
|
| November 15, 16 |
Japan |
Bank of Japan Monetary Policy Meeting |
| November 16 |
UK |
Bank of England Inflation Report |
|
|
|
| The following indicators will be released this week... |
| Europe |
|
|
| November 14 |
Eurozone |
Industrial Production (September) |
| November 15 |
Eurozone |
Gross Domestic Product (Q3.2011 flash) |
|
Germany |
Gross Domestic Product (Q3.2011 flash) |
|
|
ZEW Business Survey (November) |
|
France |
Gross Domestic Product (Q3.2011 flash) |
|
Italy |
Merchandise Trade (September) |
|
UK |
Consumer Price Index (October) |
| November 16 |
Eurozone |
Harmonized Index of Consumer Prices (October final) |
|
UK |
Labour Market Report (October) |
| November 17 |
UK |
Retail Sales (October) |
| November 18 |
Germany |
Producer Price Index (October) |
|
|
|
| Asia/Pacific |
|
|
| November 14 |
Japan |
Gross Domestic Product (Q3.2011) |
|
|
|
| Americas |
|
|
| November 15 |
Canada |
Manufacturing Sales (September) |
| November 18 |
Canada |
Consumer Price Index (October) |
Anne D Picker is the author of International Economic Indicators and Central Banks.
|
