|
There were a number of key indicators this past week, including GDP, personal income, durables orders among others. Outside of housing, the headline numbers generally hid underlying strength. Core numbers or component details generally showed an improving and moderately strong third quarter. Housing numbers were mixed this past week and still depressed.
 Due to progress on solving the European debt crisis, underlying strength in key economic indicators, and generally favorable earnings, stocks posted strong gains for the week. Due to progress on solving the European debt crisis, underlying strength in key economic indicators, and generally favorable earnings, stocks posted strong gains for the week.
Stocks advanced Monday on strong and better-than-expected earnings from Caterpillar and on a number of merger announcements. Also, European leaders said they made progress at a weekend summit and planned to unveil details by Wednesday for containing the crisis.
On Tuesday, traders grew uncertain that European leaders would be able to deliver a comprehensive package on Wednesday to address sovereign debt problems and equities declined. Also weighing on stocks was an unexpected drop in consumer confidence that was dramatically below expectations. From company news, earnings from United Parcel Service and 3M disappointed. Both are seen as representing the overall economy but especially UPS.
Stocks jumped at mid-week on news that European Union leaders reached an agreement on a plan to recapitalize the region’s banks. Chatter that China would likely invest in the European bailout added to lift. Also, core durables orders and new home sales were positive. On the downside, Amazon and Ford disappointed.
Stocks surged Thursday on continued news on progress in resolving the European sovereign debt crisis. The day’s news included reports that private investors will take a voluntary 50 percent write down on sovereign Greek bonds, the eurozone bailout fund will be increased to about US$1.4 trillion and Greece will aim to reduce its debt to 120 percent of gross domestic product by 2020. While Europe was the big news, the advance report on third quarter GDP also was positive—especially in terms of demand numbers. And the Bank of Japan announced Thursday that it is boosting purchases of government bonds to help stimulate the Japanese economy.
At week’s close, stocks were mixed, largely holding on to most of Thursday’s gains or even adding to advances. The personal income report was disappointing at the headline level, but detail was moderately strong. But basically stocks were mostly holding onto gains from the prior day. For the week, equity gains were quite healthy on economic news and company news.
Equities were up sharply this past week. The Dow was up 3.6 percent; the S&P 500, up 3.8 percent; the Nasdaq, up 3.8 percent; and the Russell 2000, up 6.8 percent.
For the year-to-date, most major indexes were back into positive territory as follows: the Dow, up 5.6 percent; the S&P 500, up 2.2 percent; and the Nasdaq, up 3.2 percent. However, the Russell 2000 was down 2.9 percent.
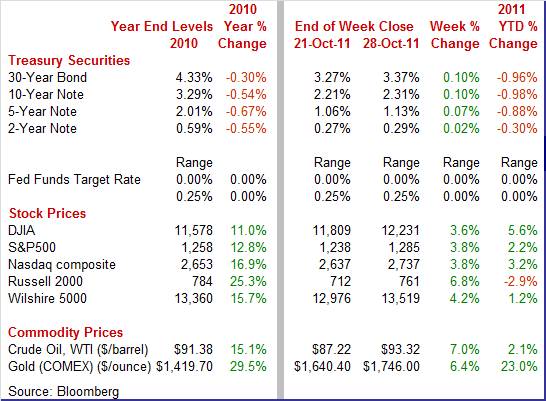
Weekly percent change column reflects percent changes for all components except interest rates. Interest rate changes are reflected in simple differences.
 Treasury yields were up this past week, largely on favorable news from Europe and mostly positive economic data. Treasury yields were up this past week, largely on favorable news from Europe and mostly positive economic data.
However, the first big move for the week was in the other direction on Tuesday as flight to safety bumped rates down on uncertainty about progress on European sovereign debt, scheduled to be announced the next day. Weak consumer confidence also weighed on yields.
 Rates rose notably on Wednesday and especially Thursday. Flight to safety unwound on news of progress on European sovereign debt, on plans to re-capitalize European banks, and on mostly favorable economic news, including durables and new home sales on Wednesday and GDP on Thursday. Rates rose notably on Wednesday and especially Thursday. Flight to safety unwound on news of progress on European sovereign debt, on plans to re-capitalize European banks, and on mostly favorable economic news, including durables and new home sales on Wednesday and GDP on Thursday.
Yields dipped Friday as traders re-evaluated the complexity of solving the European debt crisis and decided that optimism earlier in the week was a little higher than justified.
Throughout the week, gains in equities pressured flows out of fixed income—especially on Thursday.
For this past week Treasury rates were up as follows: the 2-year note, up 2 basis points; the 5-year note, up 7 basis points; the 7-year note, up 9 basis points; the 10-year note, up 10 basis points; and the 30-year bond, up 10 basis points. The 3-month T-bill slipped 2 basis points.
Despite the Fed’s implementation of Operation Twist, longer maturity rates have risen on moderately stronger economic data and reversal of flight to safety on progress in solving European sovereign debt—especially that of Greece.
 The spot price of crude rose sharply this past week. One of the two big jumps was on Monday as spot West Texas Intermediate jumped more than $4 per barrel on reports of a decline in inventories at Cushing, Oklahoma. Also adding to lift were favorable news on Chinese manufacturing, Japanese exports, and on European sovereign debt. Crude gained more than $2 per barrel on Tuesday on the earlier report of a drop in inventories. The spot price of crude rose sharply this past week. One of the two big jumps was on Monday as spot West Texas Intermediate jumped more than $4 per barrel on reports of a decline in inventories at Cushing, Oklahoma. Also adding to lift were favorable news on Chinese manufacturing, Japanese exports, and on European sovereign debt. Crude gained more than $2 per barrel on Tuesday on the earlier report of a drop in inventories.
But at mid-week, the government report on petroleum stocks showed higher-than-expected levels and WTI spot declined a little more than $3-1/2 per barrel. On Thursday, crude rebounded almost $4 per barrel on favorable news out of Europe, healthy GDP, and in sympathy with stock market gains. Prices were little changed on Friday.
Net for the week, the spot price for West Texas Intermediate surged $6.10 per barrel to settle at $93.32.
The third quarter actually is turning out to be moderately stronger than the second quarter. However, it still is not gangbusters and is relatively sluggish compared to past recoveries. But for a number of indicators, the underlying detail was notably stronger than the headline number.
 Economic growth finally strengthened in the third quarter—and the component mix is more favorable than expected. GDP growth improved to a 2.5 percent annualized increase in the third quarter, following an anemic 1.3 percent in the second quarter. The latest is the strongest growth rate since the third quarter of 2010—also posting at 2.5 percent. Economic growth finally strengthened in the third quarter—and the component mix is more favorable than expected. GDP growth improved to a 2.5 percent annualized increase in the third quarter, following an anemic 1.3 percent in the second quarter. The latest is the strongest growth rate since the third quarter of 2010—also posting at 2.5 percent.
The detail is even better than the headline. Demand numbers also improved as final sales of domestic product increased an annualized 3.6 percent in the third quarter after a 1.6 percent rise the prior quarter. Final sales to domestic purchasers (excludes net exports) gained 3.2 percent, following a 1.3 percent gain in the second quarter.
Strength was led by business fixed investment with personal consumption expenditures gaining momentum also. PCEs advanced 2.4 percent, following a 0.7 percent rise the prior quarter. Strength was led by durables with services also accelerating. Nondurables growth was soft. Net exports improved but at a slower rate. Inventory growth was positive but at a slower pace. Government purchases—on weakness in state & local spending—were flat but an improvement over a modest dip in the second quarter. Residential investment posted a modest gain but slowed from the prior quarter.
In terms of business cycle issues, the third quarter was a milestone. The level of real GDP ($13.353 trillion) topped the prior cyclical peak during the fourth quarter of 2007 ($13.326 trillion). Technically, the economy is no longer in recovery but in expansion. Under earlier estimates of GDP, it was believed that this milestone had been passed earlier but downward annual revisions erased the milestone level. This time, it looks a little more certain.
On a year-ago basis, GDP is up 1.6 percent, matching the pace in the second quarter.
Economy-wide inflation according to the GDP price index held steady at a 2.5 percent pace and equaled consensus forecasts for a 2.5 percent boost. The GDP price index, however, is influenced by the interaction of exports and especially imports in the index calculation. Imports are a negative—with the magnitude of the negative contribution being volatile. The Bureau of Economic Analysis focuses on the price index for gross domestic purchases as its headline inflation number. By this measure, inflation has softened. The price index for gross domestic purchases, which measures prices paid by U.S. residents, increased 2.0 percent in the third quarter, compared with an increase of 3.3 percent in the second. Excluding food and energy prices, the price index for gross domestic purchases increased 1.8 percent in the third quarter, compared with an increase of 2.7 percent in the second.
 Headline personal income was sluggish in September but underlying detail was moderately healthy. And spending was up significantly. Personal income in September edged up 0.1 percent, following a 0.1 percent dip in August. Importantly, the wages & salaries component rebounded 0.3 percent, after declining 0.1 percent in August. Sluggishness in income was from a dip in interest income and from flat government benefits. While all sources of income can affect spending, it is the wages & salaries component that matters most and it has regained some strength, though with some volatility. Headline personal income was sluggish in September but underlying detail was moderately healthy. And spending was up significantly. Personal income in September edged up 0.1 percent, following a 0.1 percent dip in August. Importantly, the wages & salaries component rebounded 0.3 percent, after declining 0.1 percent in August. Sluggishness in income was from a dip in interest income and from flat government benefits. While all sources of income can affect spending, it is the wages & salaries component that matters most and it has regained some strength, though with some volatility.
Either the consumer sector is stronger than measures of sentiment or consumers are spending to make themselves feel better. Consumer spending in September ramped up, gaining 0.6 percent, following a 0.2 percent rise in August. Spending was led by purchases of motor vehicles as durables jumped 2.2 percent after a 1.1 percent decline in August. Nondurables increased 1.1 percent, following a 0.6 percent rise. About half of the nondurables increase was price related. Services rose 0.2 percent after a 0.3 percent gain in August.
 Turning to inflation numbers, the headline PCE price index increased 0.2 percent after gaining 0.3 percent in August. The core rate slowed to no change from up 0.2 percent in August. Turning to inflation numbers, the headline PCE price index increased 0.2 percent after gaining 0.3 percent in August. The core rate slowed to no change from up 0.2 percent in August.
Year-on-year, headline prices are up 2.9 percent, compared to 2.9 percent in September. The core is up 1.6 percent on a year-ago basis, down slightly from 1.7 percent in August.
 The September personal income report overall is relatively strong—at least for this recovery. Headline income is sluggish but the important wages & salaries component is moderately healthy. Personal spending is robust although price gains played a partial role. Core inflation softened and this gives the Fed room for further accommodation if the FOMC chooses. The September personal income report overall is relatively strong—at least for this recovery. Headline income is sluggish but the important wages & salaries component is moderately healthy. Personal spending is robust although price gains played a partial role. Core inflation softened and this gives the Fed room for further accommodation if the FOMC chooses.
 The Conference Board’s and University of Michigan measures of the consumer mood headed in opposite directions in October. Both, however, remain at depressed levels. The Conference Board’s and University of Michigan measures of the consumer mood headed in opposite directions in October. Both, however, remain at depressed levels.
The Conference Board’s consumer confidence index fell 6.6 points in October to 39.8 with the current conditions component down a sharp seven points to 26.3 and the expectations component down 6.4 points to 48.7.
Stand-out weakness appeared in the current assessment of business conditions where fewer, 11.0 percent, describe conditions as good and more, 43.7 percent, describe conditions as bad. Stand-out weakness also was in income expectations where fewer, 10.3 percent, see their income rising and more, 19.2 percent, see their income decreasing. One good piece of news is a dip back, to 47.1 percent, in those who say jobs are currently hard to get in what is a mildly positive indication for the October jobs report. Inflation expectations are unchanged at 5.8 percent.
In contrast, the Reuters/University of Michigan consumer sentiment index jumped to 60.9 for final October, a reading that compares with a very weak 57.5 at mid-month to imply a 64.3 level for the final two weeks of the month. Stock market gains during the latter part of the month likely helped lift consumer sentiment. The 64.3 implied reading puts the last two weeks of this month on a par with July which was of course just before the shocks of August threw sentiment to 30 year lows.
The improvement the last two weeks is centered in the leading component of expectations which jumped 4.8 points to 51.8. The current conditions component also rose, up 1.3 points to 75.1. Inflation expectations show no change from mid-month, at 3.2 percent for the one-year outlook and 2.7 percent for the five-year.
Measures of consumer spirits have been severely depressed and have contrasted sharply with overall resilience in the economy and especially strength in consumer spending.
 The headline is soft but outside of transportation, durables orders are showing broad-based strength. New factory orders for durables declined 0.8 percent in September after slipping an unrevised 0.1 percent the prior month. Importantly, excluding transportation, durables rebounded 1.7 percent, following a 0.4 percent decrease in August. The headline is soft but outside of transportation, durables orders are showing broad-based strength. New factory orders for durables declined 0.8 percent in September after slipping an unrevised 0.1 percent the prior month. Importantly, excluding transportation, durables rebounded 1.7 percent, following a 0.4 percent decrease in August.
The only major industry category to decline in September was transportation which dropped 7.5 percent after rising 0.6 percent in August. Weakness was primarily in aircraft with defense down 33.9 percent and nondefense down 25.5 percent. Some of the weakness in transportation was in autos, which is baffling, given recently healthy sales. Motor vehicles dipped 2.7 percent after a 9.1 percent drop in August.
Outside of transportation, orders were healthy across the board. Increases were seen in primary metals, up 2.6 percent; fabricated metals, up 1.9 percent; machinery, up 1.8 percent; computers & electronics, up 1.0 percent; electrical equipment, up 1.9 percent; and "other," up 1.0 percent.
Looking at private capital equipment related numbers, nondefense capital goods orders posted a healthy 2.4 percent gain, following a 0.5 percent rise in August. Shipments for this series, however, softened with a 0.9 percent dip in September but followed a strong 3.1 percent jump in August.
Overall, durables orders point to continued gains in manufacturing. Again, hard data are running stronger than surveys and anecdotes.
 New home sales improved in September but remain at a depressed pace. New home sales jumped 5.7 percent in September to a 313,000 annual rate. The gain was centered in the two largest regions, the South and the West. The rise in sales drew down supply to 6.2 months at the current sales rate for the leanest level in a year-and-a-half and compared 6.6 months in August. Home builders are finally seeing some progress in relief from over supply. New home sales improved in September but remain at a depressed pace. New home sales jumped 5.7 percent in September to a 313,000 annual rate. The gain was centered in the two largest regions, the South and the West. The rise in sales drew down supply to 6.2 months at the current sales rate for the leanest level in a year-and-a-half and compared 6.6 months in August. Home builders are finally seeing some progress in relief from over supply.
But sales either came at the expense of lower prices or merely more sales were on the low price end. The price data are not based on repeat transactions and a change in the mix of sales affects the price numbers. The median price dropped 3.1 percent on the month to $204,400 for the third straight monthly decline. Year-on-year contraction posted at 10.4 percent—the steepest since early 2009 during the recent recession. However, other measures of home prices indicate a little more stability.
New home sales were moderately positive in the latest report but existing home sales may not be so favorable in the next release if pending home sales are accurate.
 Pending sales fell 4.6 percent in September with declines split about evenly across regions. Pending home sales reflect contract signings while existing home sales are based on closings. Pending sales fell 4.6 percent in September with declines split about evenly across regions. Pending home sales reflect contract signings while existing home sales are based on closings.
September's decline was unusually steep, following declines of 1.2 percent in August and 1.3 percent in July. According to the National Association of Realtors, weak consumer confidence and tight credit conditions are holding back home buyers. Credit issues along with the inability of contract signers to sell their own homes have led to higher cancellation rates and are holding down closings.
 Home prices are not improved but neither are they showing a downward drift, based on measures using repeat transactions. First, Case-Shiller data show no change in the seasonally adjusted composite-20 index for August. The reading ends three prior months of 0.1 percent declines. Given that this index is based on a three-month-moving average, it suggests incremental improvement in the underlying data for August. The unadjusted reading was plus 0.2 percent versus plus 0.9 percent and plus 1.1 percent in the two prior months. The unadjusted year-on-year pace of minus 3.8 percent is the best reading since February in what hints at a flattening in the slope of price contraction. The Case-Shiller data cover only metropolitan areas but include the full gamut of types of homes sold. Home prices are not improved but neither are they showing a downward drift, based on measures using repeat transactions. First, Case-Shiller data show no change in the seasonally adjusted composite-20 index for August. The reading ends three prior months of 0.1 percent declines. Given that this index is based on a three-month-moving average, it suggests incremental improvement in the underlying data for August. The unadjusted reading was plus 0.2 percent versus plus 0.9 percent and plus 1.1 percent in the two prior months. The unadjusted year-on-year pace of minus 3.8 percent is the best reading since February in what hints at a flattening in the slope of price contraction. The Case-Shiller data cover only metropolitan areas but include the full gamut of types of homes sold.
According to the FHFA, house prices slipped 0.1 percent in August after edging up 0.1 percent the prior month. The August dip ended a string of four monthly gains in a row. The FHFA house price index covers mortgages financed by or bundled by federal housing agencies.
On a year-on-year basis, the FHFA HPI is down 4.0 percent, compared to down 4.1 percent in July.
The latest Case-Shiller and FHFA reports show house prices stabilizing. However, soft demand and still somewhat high supply continue to constrain prices.
The economy is gradually improving according to the latest economic indicators. And with some progress being made on solving European sovereign debt problems, financial markets are stronger than otherwise. Overall, the financial and economic outlooks are somewhat brighter after this past week’s news. The next hurdle is the October jobs report out this coming week.
The highlight of this coming week will be the October jobs report out on Friday. Strong competition will come from the FOMC policy statement at 12:30 p.m. ET on Wednesday with the chairman’s press conference about two hours later. Also garnering market attention will be ISM manufacturing data and motor vehicle sales on Tuesday and ISM nonmanufacturing data on Thursday.
The Chicago PMI in September advanced 4.9 points to 60.4, showing its best reading since June. The new orders index picked up very sharply in the Chicago area during September, up 8.4 points to 65.3 for the strongest rate of monthly growth since April. Employment rose 8.5 points to 60.6 for its strongest rate of growth since May.
Chicago PMI Consensus Forecast for October 11: 58.0
Range: 56.0 to 60.4
The Dallas Fed general business activity index in its Texas manufacturing survey in September rose from 1.1 to 5.9, suggesting growth picked up after stalling in August.
Most other measures of current manufacturing conditions also indicated growth in September. The new orders index edged down from 4.8 to 3.6 in September, suggesting order volumes continued to increase, but at a slightly decelerated pace. The shipments index rose from 6.7 to 9.4, reaching its highest level since March. However, perceptions of general business conditions worsened in September. The general business activity index remained negative for the fifth month in a row and fell from minus 11.4 in August to minus 14.4 in September.
Dallas Fed general business activity index Consensus Forecast for October 11: -5.0
Range: -6.0 to -5.0
Sales of total light motor vehicles in September jumped 8.0 percent to an annualized 13.1 million units. Sales were boosted by improved inventories after the waning of supply disruptions in Japan and also by higher incentives from auto dealers. Sales of domestic models rose to 10.0 million units in September from 9.4 million the prior month while imports increased to 3.1 million from 2.7 million.
Motor vehicle total sales Consensus Forecast for October 11: 13.2 million-unit rate
Range: 12.8 to 13.4 million-unit rate
The composite index from the ISM manufacturing survey in September rose 1.0 point to 51.6, largely on production and employment. The production index gained 2.6 points to 51.2. And factories were hiring as the employment index rose further into positive territory, moving to 53.8 from 51.8 in August. But the new orders index was under 50 for a third month in a row, though just barely at 49.6.
ISM manufacturing composite index Consensus Forecast for October 11: 52.0
Range: 50.9 to 53.00
Construction spending in August rebounded 1.4 percent, following a 1.4 percent drop in July. The latest month's rebound was led by a 3.1 percent jump in public sector outlays, following a 1.5 percent dip in July. Private residential construction spending made a partial rebound of 0.7 percent, following a 3.2 percent fall the prior month. Private nonresidential outlays edged up 0.2 percent after a 0.3 percent advance the prior month. Housing starts have been volatile in recent months but a 15.0 percent spike in September suggests that at least the residential component of construction outlays posts a gain for the month.
Construction spending Consensus Forecast for September 11: +0.3 percent
Range: -0.5 to +0.7 percent
ADP private payroll employment rose 91,000 in September, little changed from its revised 89,000 estimate for August. From the employment situation report, private jobs grew 95,000 in September.
ADP private payrolls Consensus Forecast for October 11: 100,000
Range: 38,000 to 139,000
The FOMC announcement at 12:30 p.m. ET for the November 1-2 FOMC policy meeting is expected to leave policy rates unchanged. Also, the Fed will release its quarterly forecast between the announcement and the chairman’s press conference. Traders will focus on any language in the statement suggesting that the Fed is or is not moving closer to QE3.
FOMC Consensus Forecast for 11/2/11 policy vote on fed funds target range: unchanged at a range of 0 to 0.25 percent
Chairman press conference after the FOMC meeting statement is scheduled for 2:15 p.m. ET. Fed Chairman Ben Bernanke conducts a press conference after FOMC meetings in which participants present their quarterly economic forecasts. Bernanke is expected to comment on the forecast and take Q&A. The possibility of QE3 is likely the hot topic.
Initial jobless claims for the October 22 week came in at 402,000. The four-week average of 405,500 was 10,000 below the month-ago period. Continuing claims in data for the October 15 week fell 96,000 to 3.645 million with the four-week average of 3.701 million nearly 50,000 lower on the month-ago comparison. Improvement for continuing claims is an uncertain mix between hiring and benefit expiration.
Jobless Claims Consensus Forecast for 10/29/11: 400,000
Range: 399,000 to 410,000
Nonfarm business productivity in the second quarter fell an annualized 0.7 percent, compared to a 0.6 percent decrease in the first quarter. Unit labor costs rose a revised 3.3 percent in the second quarter, compared to the first quarter's 6.2 percent. Based on third quarter GDP growth of 2.5 percent, compared to 1.3 percent the prior quarter, we should see improvement in third quarter productivity as both measures use many of the same source data for output.
Nonfarm Business Productivity Consensus Forecast for initial Q3 11: 2.5 percent annual rate
Range: +1.7 to +4.3 percent annual rate
Unit Labor Costs Consensus Forecast for initial Q3 11: -0.7 percent annual rate
Range: -3.2 to +1.2 percent annual rate
Factory orders fell 0.2 percent in August. Orders for durable goods were down 0.1 percent while nondurables fell 0.3 percent. The dip in nondurables reflected price declines for energy products. More recently, new factory orders for durables declined 0.8 percent in September after slipping an unrevised 0.1 percent the prior month. Excluding transportation, durables rebounded 1.7 percent, following a 0.4 percent decrease in August.
Factory orders Consensus Forecast for September 11: -0.2 percent
Range: -1.0 to +0.5 percent
The composite index from the ISM nonmanufacturing survey posted at 53.0 in September, above breakeven of 50 and barely down from August’s 53.3. The new orders index rose a very solid 3.7 points to 56.5, over 50 to indicate monthly growth and was well above August to indicate an accelerating rate of monthly growth.
ISM nonmanufacturing composite index Consensus Forecast for October 11: 53.5
Range: 52.2 to 54.0
Nonfarm payroll employment in September advanced 103,000, following a 57,000 rise in August and a 127,000 increase in July. Private nonfarm payrolls were somewhat stronger than the total, gaining 137,000 in September, following a 42,000 increase in August and a 173,000 boost in July. A return of striking telecommunications workers added about 45,000 to the payroll total and private tally. Still, prior months’ revisions were substantial at a net gain of 99,000 and more than offset the returning strikers effect. Wages rebounded 0.2 percent in September after dipping 0.2 percent the prior month. The average workweek for all workers in September ticked up to 34.3 hours from 34.2 hours in August. From the household survey, the unemployment rate held steady at 9.1 percent.
Nonfarm payrolls Consensus Forecast for October 11: 90,000
Range: 64,000 to 152,000
Private payrolls Consensus Forecast for October 11: 120,000
Range: 100,000 to 168,000
Unemployment rate Consensus Forecast for October 11: 9.1 percent
Range: 9.0 to 9.2 percent
Average workweek Consensus Forecast for October 11: 34.3 hours
Range: 34.3 to 34.3 hours
Average hourly earnings Consensus Forecast for October 11: +0.2 percent
Range: +0.1 to +0.2 percent
R. Mark Rogers is the author of The Complete Idiot’s Guide to Economic Indicators, Penguin Books, 2009.
Econoday Senior Writer Mark Pender contributed to this article.
|
