|
Despite the off and on angst over European sovereign debt, this past week’s economic news indicated that the third quarter is actually showing mild improvement for the U.S. economy. The goods-producing sectors are leading the way currently as manufacturing is moderately healthy and residential construction has nudged up from rock bottom. Hard data are running a little stronger than the anecdotes and surveys.
 Equities got off to a weak start as German chancellor Angela Merkel dashed hopes for a quick resolution of sovereign debt problems at the European Union summit meeting on October 23. Through her spokesperson, she stated not to expect that everything will be solved at the summit. Equities got off to a weak start as German chancellor Angela Merkel dashed hopes for a quick resolution of sovereign debt problems at the European Union summit meeting on October 23. Through her spokesperson, she stated not to expect that everything will be solved at the summit.
Stocks rebounded Tuesday after the Bank of America reported better than estimated earnings and stated that credit quality had improved. Also, the National Association of Home Builders reported a rise in home builders’ sentiment to the highest level in 17 months.
At mid-week, an unexpectedly strong housing starts report got the day off to a good start but concern about lack of progress in Europe weighed on stocks. Late in the day, the Fed’s Beige Book was released and had no real surprises. However, markets interpreted the report as showing a more sluggish economy and stocks dropped. Apple dragged down the Nasdaq after missing profit estimates for the first time in at least six years.
Stocks were extremely volatile Thursday. A positive Philly Fed report boosted equities early in trading. But reports questioning whether the summit of European leaders would actually take place this weekend rattled markets, sinking equities. Assurance late in the session from German Chancellor Merkel and French President Sarkozy that a comprehensive plan to address the European debt crisis will emerge no later than Wednesday lifted stocks for moderate gains. On the last day of trading, stocks got strong lift on belief that progress is being made to resolve the European sovereign debt crisis. Also, some Fed officials hinted that that odds are rising for QE3.
Equities were mixed this past week with Blue Chip indexes up. The Dow was up 1.4 percent; the S&P 500 advanced 1.1 percent; the Nasdaq declined 1.1 percent; and the Russell 2000 was unchanged.
For the year-to-date, major indexes are down as follows: the S&P 500, down 1.5 percent; the Nasdaq, down 0.6 percent; and the Russell 2000, down 9.1 percent. The Dow is up 2.0 percent.
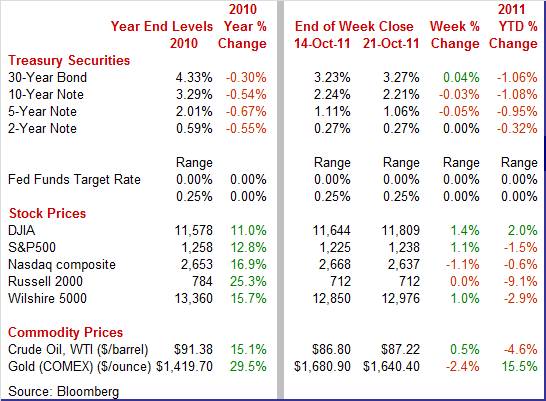
Weekly percent change column reflects percent changes for all components except interest rates. Interest rate changes are reflected in simple differences.
 Treasury yields were mixed but mostly down this past week. The biggest move was Monday on flight to safety after German Chancellor Angela Merkel’s chief spokesperson said that an imminent resolution to the debt crisis was not likely. Also, the Empire State manufacturing index was weaker than expected. After little change Tuesday and Wednesday, rates generally firmed Thursday on the relatively healthy Philly Fed report but which was partially offset by disappointing existing home sales. Also, the announcement of a second meeting of European officials led traders to believe that progress on debt resolution is being made. Optimism about Europe carried into trading the last day of the week, nudging rates up. Treasury yields were mixed but mostly down this past week. The biggest move was Monday on flight to safety after German Chancellor Angela Merkel’s chief spokesperson said that an imminent resolution to the debt crisis was not likely. Also, the Empire State manufacturing index was weaker than expected. After little change Tuesday and Wednesday, rates generally firmed Thursday on the relatively healthy Philly Fed report but which was partially offset by disappointing existing home sales. Also, the announcement of a second meeting of European officials led traders to believe that progress on debt resolution is being made. Optimism about Europe carried into trading the last day of the week, nudging rates up.
 For this past week Treasury rates were mixed as follows. The 5-year note was down 5 basis points; the 7-year note, down 6 basis points; and the 10-year note, down 3 basis points. The 3-month T-bill and the 2-year note were unchanged while the 30-year bond rose 4 basis points. For this past week Treasury rates were mixed as follows. The 5-year note was down 5 basis points; the 7-year note, down 6 basis points; and the 10-year note, down 3 basis points. The 3-month T-bill and the 2-year note were unchanged while the 30-year bond rose 4 basis points.
Longer rates have risen net since the latest FOMC decision on September 21 to implement Operation Twist. Rates were down initially but progress—or apparent progress—on European sovereign debt has reduced the flight to safety.
 The spot price of crude was little changed this past week although there were notable daily swings. West Texas Intermediate gained almost $2 per barrel Tuesday in sympathy with the stock market rally led by results from Bank of America. At mid-week, crude dropped over $2 per barrel on news of a division between France and Germany on how to increase the European bailout fund. Also, the Fed’s Beige Book disappointed. The last day of trading, the spot price for West Texas Intermediate gained almost $2 per barrel on optimism that European officials will conclude an agreement to contain the sovereign debt crisis. The spot price of crude was little changed this past week although there were notable daily swings. West Texas Intermediate gained almost $2 per barrel Tuesday in sympathy with the stock market rally led by results from Bank of America. At mid-week, crude dropped over $2 per barrel on news of a division between France and Germany on how to increase the European bailout fund. Also, the Fed’s Beige Book disappointed. The last day of trading, the spot price for West Texas Intermediate gained almost $2 per barrel on optimism that European officials will conclude an agreement to contain the sovereign debt crisis.
Net for the week, the spot price for West Texas Intermediate edged up 42 cents per barrel to settle at $87.22.
This past week, manufacturing reports were mostly positive while housing construction picked up. However, housing demand is trending flat. Meanwhile, inflation remains hot at the headline level.
 Manufacturing data point to a stronger third quarter—and no recession. Manufacturing—especially autos—continues to lead industrial production. In September, industrial production advanced 0.2 percent, following no change the month before and a 1.1 percent jump in July. Manufacturing data point to a stronger third quarter—and no recession. Manufacturing—especially autos—continues to lead industrial production. In September, industrial production advanced 0.2 percent, following no change the month before and a 1.1 percent jump in July.
 By major industry, manufacturing improved to a 0.4 percent rise after a 0.3 percent boost in August. Auto production is recovering nicely from earlier shortages of parts from Japan. The auto component increased another 0.7 percent after a gain of 1.5 percent in August. Outside of autos, manufacturing is still healthy. Strength was in durables as nondurables declined marginally. Excluding motor vehicles, manufacturing rose 0.3 percent, equaling the pace for the prior month. By major industry, manufacturing improved to a 0.4 percent rise after a 0.3 percent boost in August. Auto production is recovering nicely from earlier shortages of parts from Japan. The auto component increased another 0.7 percent after a gain of 1.5 percent in August. Outside of autos, manufacturing is still healthy. Strength was in durables as nondurables declined marginally. Excluding motor vehicles, manufacturing rose 0.3 percent, equaling the pace for the prior month.
Indeed, motor vehicle production has improved recently. For September, total assemblies for autos and light trucks bumped up to an annualized 8.52 million from 8.49 million in August. The latest is up noticeably from the supply shortage induced 7.64 million in April and sharply higher than the recession low of 3.62 million in June 2009.
 Overall industrial production was weighed down by a dip in utilities where output fell 1.8 percent after declining 2.9 percent in August. However, mining output expanded 0.8 percent, matching the growth rate for August. Overall industrial production was weighed down by a dip in utilities where output fell 1.8 percent after declining 2.9 percent in August. However, mining output expanded 0.8 percent, matching the growth rate for August.
Manufacturing is outpacing growth for the overall economy over the past year. On a seasonally adjusted year-on-year basis, overall industrial production was up 3.2 percent in September, compared to 3.3 percent in August. Through the second quarter, real GDP growth was 1.6 percent on a year-ago basis. Basically, manufacturing is leading the recovery and at the national level is running stronger than implied by manufacturing surveys.
 The latest regional manufacturing surveys came in mixed for October as the Empire State survey headline number remained negative while the Philly Fed index surprised in positive territory. The latest regional manufacturing surveys came in mixed for October as the Empire State survey headline number remained negative while the Philly Fed index surprised in positive territory.
Business conditions in the New York manufacturing region contracted for the fifth month in a row according to the Empire State index for October which showed little change at minus 8.48 versus September's minus 8.82. Positives included new orders which at plus 0.16 showed a fractional monthly gain to end two months of contraction. Shipments, at plus 5.33, reflected a moderate monthly gain. Also positive was employment, at plus 3.37, to indicate a mild monthly rise in the sample's workforce.
 Unfilled orders, however, at minus 4.49, contracted for the fourth month in a row. Inventories, at minus 8.99, suggest that the region's manufacturers see their inventories as too high. Unfilled orders, however, at minus 4.49, contracted for the fourth month in a row. Inventories, at minus 8.99, suggest that the region's manufacturers see their inventories as too high.
In contrast, the Philly Fed report was a little more upbeat though still soft. The Philly Fed general business conditions index ended two months of steep contraction with a moderate 8.7 reading for October. This compares with minus 17.5 in September and a very severe minus 30.7 for August.
 Improvement was also seen in new orders, at plus 7.8, and in shipments, at plus 13.6 which is a six-month high. Likewise, unfilled orders ended a run of monthly contractions with a plus 3.4 reading which is also a six-month high. Employment, at plus 1.4, rose for a second month in a row while the workweek moved to positive ground at plus 3.1. Improvement was also seen in new orders, at plus 7.8, and in shipments, at plus 13.6 which is a six-month high. Likewise, unfilled orders ended a run of monthly contractions with a plus 3.4 reading which is also a six-month high. Employment, at plus 1.4, rose for a second month in a row while the workweek moved to positive ground at plus 3.1.
What is an interesting curiosity is that both the Empire State and Philly Fed surveys have been more pessimistic than hard data from the Fed’s industrial production report. Manufacturing production has been noticeably stronger than the regional indexes in July, August, and September (October is not released yet). This suggests that manufacturing company officials have been “feeling” worse when responding to surveys than the actual data. This is similar to the disconnect between anemic consumer sentiment and moderately healthy consumer spending. The caveat is that surveys currently are not reflecting what is really going on in the economy.
 September housing data appears in part to be coming off hurricane effects in August as starts jumped and permits eased back. But strength also appears to be more broad based than this effect. Housing starts in September rebounded a sharp 15.0 percent after declining 7.0 percent the month before. The September annualized pace of 0.658 million units is up 10.2 percent on a year-ago basis. The comeback in September was led by a monthly 51.3 percent surge in the multifamily component, following a 16.8 percent drop in August. The single-family component edged up 1.7 percent after a 2.8 percent decrease the month before. September housing data appears in part to be coming off hurricane effects in August as starts jumped and permits eased back. But strength also appears to be more broad based than this effect. Housing starts in September rebounded a sharp 15.0 percent after declining 7.0 percent the month before. The September annualized pace of 0.658 million units is up 10.2 percent on a year-ago basis. The comeback in September was led by a monthly 51.3 percent surge in the multifamily component, following a 16.8 percent drop in August. The single-family component edged up 1.7 percent after a 2.8 percent decrease the month before.
By region, the jump in starts was led by an 18.1 percent increase in the West. Other regions also gained with Northeast up 12.7 percent; the Midwest up 9.3 percent; and the South up 15.7 percent. Only the increases in the Northeast and South were partially related to rebounding from hurricane effects in August.
But home builders are remaining cautious and not ramping up planned activity. Housing permits edged slipped 5.0 percent after rebounding 4.0 percent in August. The September rate of 0.594 million units annualized is up 5.7 percent on a year-ago basis.
The September starts report shows new housing activity to be stronger than expected. The big question is whether the demand exists to absorb added supply. The latest existing home sales numbers indicate that demand is not picking up and that caution is still appropriate for home builders.
 Home sales are oscillating around a flat and low level. Existing home sales fell back in September, down 3.0 percent to a 4.91 million annual rate after surging 8.4 percent in August. Home sales are oscillating around a flat and low level. Existing home sales fell back in September, down 3.0 percent to a 4.91 million annual rate after surging 8.4 percent in August.
Three of the four Census regions were down with only the Northeast showing a gain. Supply on the market at the current sales rate inched higher, to 8.5 months. Prices fell 3.4 percent for the median to $165,400. Foreclosures continue to weigh on the housing market which continues to struggle. Higher credit standards also continue to constrain sales.
 Inflation remains on a dual track as headline inflation for the consumer remained on the warm side while core inflation softened. The consumer price index in September increased 0.3 percent, following a 0.4 percent jump the month before. In contrast, excluding food and energy, the CPI posted a mild 0.1 percent boost after rising 0.2 percent in August. Inflation remains on a dual track as headline inflation for the consumer remained on the warm side while core inflation softened. The consumer price index in September increased 0.3 percent, following a 0.4 percent jump the month before. In contrast, excluding food and energy, the CPI posted a mild 0.1 percent boost after rising 0.2 percent in August.
 Turning to major components, energy increased a strong 2.0 percent after rising 1.2 percent in August. Gasoline spurted 2.9 percent higher after increasing 1.9 percent in August. Food price inflation continued hot, rising 0.4 percent in September after accelerating to a 0.5 percent pace the month before. Turning to major components, energy increased a strong 2.0 percent after rising 1.2 percent in August. Gasoline spurted 2.9 percent higher after increasing 1.9 percent in August. Food price inflation continued hot, rising 0.4 percent in September after accelerating to a 0.5 percent pace the month before.
Within the core, apparel declined 1.1 percent after a series of strong gains. Recreation dipped 0.1 percent. Used vehicles fell 0.6 percent while new vehicles were flat. Also, shelter cost inflation slowed to a 0.1 percent rise after two moderately strong gains.
Year-on-year, overall CPI inflation rose to 3.9 percent from 3.8 percent (seasonally adjusted) in August. The core rate held steady at 2.0 percent on a year-ago basis. On an unadjusted year-ago basis, the headline number was up 3.9 percent in September and the core was up 2.0 percent.
The latest CPI report leaves question marks on whether inflation is decelerating as some Fed officials have been forecasting and hoping for. Energy and food components are remaining stubbornly strong despite softening in the core. The September CPI report will not encourage the inflation hawks within the Fed to back down.
 Recent weakness in oil prices has been less soft than typically seasonal as headline inflation in September surged at the producer level while the core rate nudged up. Producer prices jumped 0.8 percent in September, following no change in August. Recent weakness in oil prices has been less soft than typically seasonal as headline inflation in September surged at the producer level while the core rate nudged up. Producer prices jumped 0.8 percent in September, following no change in August.
Turning to major components, energy rebounded 2.3 percent after falling 1.0 percent in August. Gasoline gained 4.2 percent, following a 1.0 percent decrease the prior month. Food costs slowed to a still warm 0.6 percent rise after surging 1.1 percent in August.
 At the core level, PPI inflation posted a 0.2 percent rise, compared to a 0.1 percent increase in August. One-third of the September advance can be traced to prices for light motor trucks, which rose 0.6 percent. At the core level, PPI inflation posted a 0.2 percent rise, compared to a 0.1 percent increase in August. One-third of the September advance can be traced to prices for light motor trucks, which rose 0.6 percent.
Producer price inflation is quite strong. For the overall PPI, the year-ago pace in September came in at 7.0 percent, compared to 6.5 percent in August (seasonally adjusted). The core rate in September held steady at 2.5 percent. On a not seasonally adjusted basis for September, the year-ago headline PPI was up 6.9 percent while the core was up 2.5 percent.
 While third quarter current activity looks stronger, leading indicators suggest that growth is going to remain on the soft side in coming months. The index of leading indicators rose 0.2 percent in September, following a 0.3 percent gain the month before and a 0.6 percent jump in July. While third quarter current activity looks stronger, leading indicators suggest that growth is going to remain on the soft side in coming months. The index of leading indicators rose 0.2 percent in September, following a 0.3 percent gain the month before and a 0.6 percent jump in July.
The latest increase was led by the rate differential between the 10-year T-note and fed funds which contributed 0.20 percentage points. This continues to reflect the Fed’s loose policy of a near zero target rate. However, this leading indicator component’s contribution has eased due to the 10-year note rate coming down. So, the actual impact of this change in the yield curve is likely stronger than implied by its effect on the overall index of leading indicators.
Positives were also seen in money supply, vendor performance, consumer expectations, and new orders for consumer goods. However, the boost in money supply was likely related to flight to safety on declines in the stock market.
Negatives were led by a dip in housing permits with downward movement also seen in new orders for nondefense capital goods, stock prices, and initial jobless claims. The factory workweek was neutral.
The index of coincident indicators rebounded 0.1 percent, following a 0.1 percent dip in August. The latest rise was due to incremental contributions from all four components—payroll employment, personal income less transfer payments, industrial production, and business sales.
Overall, leading indicators point to soft growth rate in the near term.
The Fed’s latest collection of anecdotal economic news from District Banks indicates sluggish growth for the economy. Importantly, there is no indication of recession. The Beige Book prepared for the November 1-2 FOMC meeting stated that the twelve District Banks found overall economic activity continued to expand in September, although many Districts described the pace of growth as “modest” or “slight.” Contacts generally noted weaker or less certain outlooks for business conditions which are weighing on plans for business spending. Firms are reluctant to build inventories significantly due to uncertainty. Auto dealers were an exception, still rebuilding from Japanese supply shortages and with auto sales up. Consumer spending was up slightly in most Districts, with auto sales and tourism leading the way in several of them.
By sector, manufacturing and transportation activity was reported to have increased on balance. A few Districts also reported slight improvements in construction and real estate activity. Nonetheless, overall conditions for both residential and commercial real estate remained weak.
Respondents indicated that labor market conditions were little changed, on balance, in September. Several Districts cited only limited and selective demand for new hires. Some Districts, however, noted that firms in some sectors that were hiring more broadly (such as manufacturing, transportation, and energy) were also experiencing difficulties in finding appropriately skilled or qualified labor. A number of Districts reported that hiring was being restrained by elevated uncertainty or lower expectations for their future growth. There were mixed reports on the direction of upcoming seasonal hiring. Overall, the Beige Book argues that the recovery continues but at a very sluggish pace and with continued high unemployment.
Despite sluggish or pessimistic surveys and anecdotal news, the economy actually is improving, albeit at a modest pace.
Third quarter advance estimate of GDP on Thursday is the highlight of the week as investors look for signs that the economy is regaining momentum. Housing updates include Case-Shiller and FHFA house price indexes (Tuesday), new home sales (Wednesday), and pending home sales (Thursday). The consumer is in the spotlight with Friday's personal income and spending report. Other postings include consumer confidence (Tuesday) and consumer sentiment (Friday). Advance durable orders are on tap mid-week.
The S&P/Case-Shiller 20-city home price index (SA) for July showed a third straight unchanged reading. Half of the 20 cities tracked showed declines with eight gaining and two unchanged. Weakness was concentrated in the West including a third straight decline for Phoenix, San Diego and LA and a sixth straight decline for Las Vegas. Gainers were led by Detroit, Chicago and Washington D.C. Summer is a seasonally strong period for housing demand as seen in the unadjusted data that showed a 0.9 percent rise for the composite-20 index and followed June's 1.2 percent gain. But the unadjusted year-on-year rate, at minus 4.1 percent, underscored the housing sector's continuing weakness.
The S&P/Case-Shiller 20-city HPI (SA, m/m) Consensus Forecast for August 11: 0.0 percent
Range: -0.3 to +0.2 percent
The S&P/Case-Shiller 20-city HPI (NSA, y/y) Consensus Forecast for August 11: -3.6 percent
Range: -3.9 to -3.4 percent
The Conference Board's consumer confidence index edged up two tenths to 45.4 in September. Improvement was in expectations which rose to 54.0 from 52.4 in August. The present situation index dropped to 32.5 from 34.3 as consumers reacted to heavy stock markets losses and a soft labor market. Confidence may improve in early October on the recent improvement in equities.
Consumer confidence Consensus Forecast for October 11: 46.0
Range: 40.0 to 50.0
The FHFA purchase only house price index in July rose for the fourth month in a row, advancing 0.8 percent after a 0.7 percent increase the prior month. The FHFA house price index covers mortgages financed by or bundled by federal housing agencies. On a year-on-year basis, the FHFA HPI was down 3.3 percent, compared to down 4.5 percent in June.
FHFA purchase only house price index Consensus Forecast for August 11: +0.3 percent
Range: 0.0 to +0.4 percent
The Richmond Fed manufacturing index showed a moderation in the rate of decline in activity as the index posted at minus 6 for September, compared to minus 10 in August. However, the new orders index deepened to minus 17 in September from August's minus 11. On the positive side, shipments steadied from severe contraction in August and hiring is up.
Richmond Fed manufacturing index Consensus Forecast for October 11: -1
Range: -5 to 4
Durable goods orders in August nudged down 0.1 percent, following a 4.2 percent surge in July. Excluding transportation, durables slipped 0.1 percent after rising 0.8 percent in July. Components were mixed. A big positive was a 0.9 percent rebound in nondefense capital goods orders excluding aircraft, following a 0.3 percent decline in July.
New orders for durable goods Consensus Forecast for September 11: -1.0 percent
Range: -2.5 percent to +0.5 percent
New orders for durable goods, ex-trans., Consensus Forecast for September 11: +0.5 percent
Range: -1.0 percent to +1.7 percent
New home sales slipped 2.3 percent in August, to a nine-month low of 295,000 annualized versus 302,000 in July. The level of supply on the market is at a record low 162,000 units. But supply relative to sales remains moderately heavy at 6.6 months at the current sales rate compared to 6.5 months in July. However, sales might rebound somewhat in September as Hurricane Ira likely kept buyers from home shopping in parts of the eastern seaboard.
New home sales Consensus Forecast for September 11: 302 thousand-unit annual rate
Range: 285 thousand to 312 thousand-unit annual rate
GDP growth for the final estimate for second quarter was bumped up to a rise of 1.3 percent annualized, compared to the prior estimate of 1.0 percent annualized and to first quarter growth of 0.4 percent. Demand was somewhat stronger than previously believed but still soft. Final sales of domestic product were revised to an annualized 1.6 percent from the previous estimate of 1.2 percent. Final sales to domestic purchasers (excludes net exports) were revised up to 1.3 percent from the second estimate of 1.1 percent annualized. Economy-wide inflation was revised up incrementally to 2.5 percent annualized, compared to the previous estimate of 2.4 percent and the first quarter rise of 2.5 percent.
Real GDP Consensus Forecast for advance estimate Q3 11: +2.5 percent annual rate
Range: +1.8 to +3.5 percent annual rate
GDP price index Consensus Forecast for advance estimate Q3 11: +2.5 percent annual rate
Range: +2.0 to +2.7 percent annual rate
Initial jobless claims in the October 15 week edged 6,000 lower to 403,000. The four-week average was down for a fourth straight week—6,250 lower to a 403,000 level that is down nearly 20,000 from the month-ago comparison.
Jobless Claims Consensus Forecast for 10/22/11: 405,000
Range: 394,000 to 410,000
The pending home sales index in August fell 1.2 percent. August's data showed declines in contract signings in three of four regions with the largest region, the South, showing a small increase. The National Association of Realtors, which compiles the reports, noted that the month's sizable 5.8 percent decline in the Northeast was tied to Hurricane Irene.
Pending home sales Consensus Forecast for September 11: 0.0 percent
Range: -1.4 to +2.0 percent
The Kansas City Fed manufacturing index rose to 6 in September, up from 3 in August and 3 in July. The increase was mainly concentrated in durable goods plants, particularly for aircraft and computer equipment, while nondurable goods producers reported a continued slowing in activity. Most other month-over-month indexes also improved modestly in September. The production index rose from minus 2 to 3, and the shipments, new orders, and order backlog indexes also edged up.
Kansas City Fed manufacturing index Consensus Forecast for October 11: 8
Range: 4 to 10
Personal income in August slipped 0.1 percent, following a 0.1 percent gain the month before. Leading the decline, the wages & salaries component decreased 0.2 percent after a 0.3 percent boost in July. Consumer spending rose a modest 0.2 percent in August, following a sharp 0.7 percent surge the prior month. On the inflation front, the headline PCE price index eased to a 0.2 percent rise from 0.4 percent in July. The core rate softened to a 0.1 percent uptick, following a 0.2 percent increase in July. Looking ahead, income and spending should improve in September although headline inflation likely worsens. In personal income, there should be a healthy gain in the private wages & salaries component as aggregate private weekly earnings jumped 0.6 percent in September. Personal spending should be robust as unit new motor vehicle sales surged a monthly 8.0 percent in September while retail sales excluding autos jumped 0.6 percent. Headline CPI inflation rose 0.3 percent in September while the core CPI edged up 0.1 percent.
Personal income Consensus Forecast for September 11: +0.3 percent
Range: +0.1 to +0.5 percent
Personal consumption expenditures Consensus Forecast for September 11: +0.3 percent
Range: +0.1 to +0.5 percent
PCE price index Consensus Forecast for September 11: +0.2 percent
Range: +0.2 to +0.3 percent
Core PCE price index Consensus Forecast for September 11: +0.1 percent
Range: 0.0 to +0.2 percent
The employment cost index in the second quarter jumped a sharp 0.7 percent (not annualized), the largest increase of the recovery. Benefits, which make up 30 percent of the index, rose 1.3 percent on top of the first-quarter's 1.1 percent jump with wages & salaries, which make up the remaining 70 percent, showing no acceleration at plus 0.4 percent.
Employment cost index Consensus Forecast for Q3 11: +0.6 percent
Range: +0.5 to +0.8 percent
The Reuters/University of Michigan's consumer sentiment index fell 1.9 points at the mid-month October reading to 57.5, extending recently sharp weakness going back to the August shock month when equities plunged. Weakness was centered once again in the leading component of expectations which at 47.0, was down 2.4 points from September's final reading. The assessment of current conditions also declined, down 1.1 points to a 73.8 level that continues to show less severe weakness than expectations.
Consumer sentiment index Consensus Forecast for final October 11: 58.0
Range: 57.0 to 59.0
R. Mark Rogers is the author of The Complete Idiot’s Guide to Economic Indicators, Penguin Books, 2009.
Econoday Senior Writer Mark Pender contributed to this article.
|
