|
With Europe making progress this past week on solving its sovereign debt problems and with limited economic news mostly favorable, equities continued to rally.
 Stocks were boosted at the start of the week with positive news from Europe as German Chancellor Angela Merkel and French President Nicolas Sarkozy pledged to deliver a comprehensive new plan to recapitalize European banks and address the Greek debt crisis by November 3. Stocks were boosted at the start of the week with positive news from Europe as German Chancellor Angela Merkel and French President Nicolas Sarkozy pledged to deliver a comprehensive new plan to recapitalize European banks and address the Greek debt crisis by November 3.
On Tuesday most indexes gained on continuation of optimism about Europe. Nonetheless, investor attention was split between events in Europe and the start of earnings season. Mostly, they were waiting for the key vote by Slovakia—the last of the 17 member states of the Eurozone that needed to approve expansion of the European Financial Stability Facility (EFSF) rescue fund. After close, Alcoa started the Dow earnings season with somewhat disappointing numbers. Also after close, lawmakers in Slovakia rejected legislation to approve the EFSF but the vote was seen largely related to local politics and a second vote was expected later in the week to approve the package.
At mid-week, stocks gained after European Commission President Jose Barroso called for measures to re-capitalize European banks and to resolve Greece’s and other European countries’ sovereign debt problems. PepsiCo improved the mood about the earnings season with a slightly better-than-expected quarterly profit and after affirming its full year goal. U.S. stocks rose, briefly erasing the Dow Jones Industrial Average’s 2011 loss, as European leaders provided a road map to tame the debt crisis and the Federal Reserve said it discussed further asset purchases. Traders also liked the fact that the FOMC minutes indicated that the Fed is still keeping another round of quantitative easing on the table if needed.
On Thursday, stocks were tugged down modestly by lower earnings from JPMorgan Chase and due to a report from China that the country’s exports were not as strong as expected. On the upside, Slovakia's parliament approved the European Financial Stability Facility bringing the approval process to an end. Also, the U.S. trade deficit came in smaller than forecast. After close, blowout earnings from Google helped to offset the day’s negative news, setting a positive tone for Friday.
Friday’s very positive retail sales report provided sizeable lift for stocks. Expectations for stronger consumer demand led to significant gains for the energy patch, transports, and for industrials. A disappointing consumer sentiment number was mostly ignored.
Equities were up this past week. The Dow was up 4.9 percent; the S&P 500, up 6.0 percent; the Nasdaq, up 7.6 percent; and the Russell 2000, up 8.6 percent.
For the year-to-date, the Dow and Nasdaq returned to positive territory with both up 0.6 percent. The S&P 500 is down 2.6 percent while the Russell 2000 is down 9.1 percent.
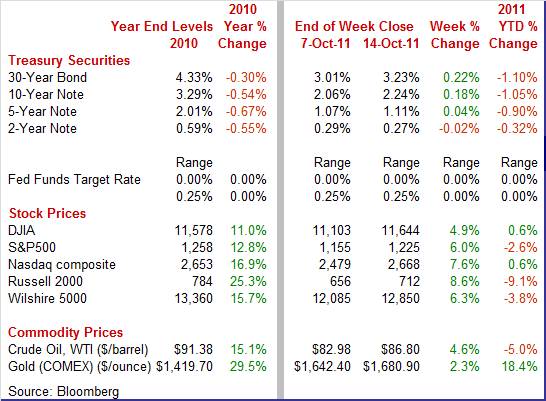
Weekly percent change column reflects percent changes for all components except interest rates. Interest rate changes are reflected in simple differences.
 Bond traders were primarily focused on Europe. Demand for Treasuries eased throughout most of the holiday shortened week for the bond market. The key factor was perceived improvement in resolution of the European sovereign debt crisis—though there was some reversal in this view on Thursday. The Fed’s keeping QE3 on the table as a possibility also weighed on rates Thursday. During the week, rates were also lifted by money flows into equities and by the very positive retail sales report on Friday. Bond traders were primarily focused on Europe. Demand for Treasuries eased throughout most of the holiday shortened week for the bond market. The key factor was perceived improvement in resolution of the European sovereign debt crisis—though there was some reversal in this view on Thursday. The Fed’s keeping QE3 on the table as a possibility also weighed on rates Thursday. During the week, rates were also lifted by money flows into equities and by the very positive retail sales report on Friday.
For this past week Treasury rates were mostly up as follows: 3-month T-bill, up 1 basis point; the 5-year note, up 4 basis points; the 7-year note, up 12 basis points; the 10-year note, up 18 basis points; and the 30-year bond, up 22 basis points. The 2-year note slipped 2 basis points.
 The spot price of crude rose significantly this past week. Lift was strongest on Monday after the leaders of Germany and France pledged to propose a comprehensive package to resolve Greek and other European sovereign debt problems as the spot price of West Texas Intermediate jumped more than 2-1/2 bucks a barrel. The spot price of crude rose significantly this past week. Lift was strongest on Monday after the leaders of Germany and France pledged to propose a comprehensive package to resolve Greek and other European sovereign debt problems as the spot price of West Texas Intermediate jumped more than 2-1/2 bucks a barrel.
Prices were steady until Thursday when crude prices dipped in sympathy with equities. On Friday, the strong gain in retail sales boosted crude more than $2-1/2 per barrel, indicating strong demand.
Net for the week, the spot price for West Texas Intermediate gained $3.82 per barrel to settle at $86.80.
Both retail sales and international trade surprised on the upside while consumer sentiment remained depressed.
 Despite continuing high unemployment and weak consumer confidence, retail sales have actually been on a recent strengthening trend. Retail sales in September made quite a comeback, pointing to a consumer that has more life than recently believed. Overall retail sales in September jumped 1.1 percent, following a 0.3 percent increase the prior month. Despite continuing high unemployment and weak consumer confidence, retail sales have actually been on a recent strengthening trend. Retail sales in September made quite a comeback, pointing to a consumer that has more life than recently believed. Overall retail sales in September jumped 1.1 percent, following a 0.3 percent increase the prior month.
Excluding autos, sales gained a robust 0.6 percent after rising 0.5 percent in August. Both the headline and ex autos series were revised up significantly for August from their respective original estimates of zero and 0.1 percent.
Gasoline sales boosted the core notably in the latest month. Nonetheless, sales excluding autos and gasoline in September were up a healthy 0.5 percent, following a 0.5 percent boost the month before.
 Component gains were widespread with only a few showing declines. Leading the pack was motor vehicles and parts, up 3.6 percent after a 0.8 percent dip in August. Gains in September were also seen in clothing & accessories, gasoline stations, food services & drinking places, furniture & home furnishings, miscellaneous store retailers, general merchandise, nonstore retailers, health & personal care, and electronics & appliance stores. Component gains were widespread with only a few showing declines. Leading the pack was motor vehicles and parts, up 3.6 percent after a 0.8 percent dip in August. Gains in September were also seen in clothing & accessories, gasoline stations, food services & drinking places, furniture & home furnishings, miscellaneous store retailers, general merchandise, nonstore retailers, health & personal care, and electronics & appliance stores.
Declines were seen in sporting goods, hobby, book & music stores; food & beverage; and building materials & garden equipment.
The September retail sales numbers add to the argument that the economy is gradually improving and not returning to recession. After the retail sales report, many economists upgraded their third quarter GDP forecast with some revised estimates topping an annualized 2.5 percent.
 It very much is still a two track economy for consumers—one for those with jobs and one for those still unemployed. But spending is strong as those with jobs are doing their part to support the economy. However, consumers agree that they are not happy about the economy. Consumers apparently are still depressed over the direction of recent 401(k) statements and still high unemployment. It very much is still a two track economy for consumers—one for those with jobs and one for those still unemployed. But spending is strong as those with jobs are doing their part to support the economy. However, consumers agree that they are not happy about the economy. Consumers apparently are still depressed over the direction of recent 401(k) statements and still high unemployment.
Consumer sentiment fell 1.9 points at the mid-month October reading to 57.5, extending recently sharp weakness going back to the August shock month when equities plunged.
 Weakness so far this month is centered once again in the leading component of expectations which at 47.0, down 2.4 points from September's final reading, indicates that consumers, hit by the soft jobs market and by soft income prospects, see no relief in sight. The assessment of current conditions also declined, down 1.1 points to a 73.8 level that continues to show less severe weakness than expectations. Weakness so far this month is centered once again in the leading component of expectations which at 47.0, down 2.4 points from September's final reading, indicates that consumers, hit by the soft jobs market and by soft income prospects, see no relief in sight. The assessment of current conditions also declined, down 1.1 points to a 73.8 level that continues to show less severe weakness than expectations.
One positive in the latest report is an easing in inflation expectations, down one tenth for the one-year view to 3.2 percent and down two tenths for the five-year view to 2.7 percent.
 The economy is getting support for the third quarter not just from the consumer but also from the international trade sector. The August trade deficit was unchanged at $45.6 billion with July a little more negative than the first estimate of $44.8 billion. Exports nudged back down only 0.1 percent after rebounding a sharp 3.4 percent in July. Imports were flat in both August and July. The economy is getting support for the third quarter not just from the consumer but also from the international trade sector. The August trade deficit was unchanged at $45.6 billion with July a little more negative than the first estimate of $44.8 billion. Exports nudged back down only 0.1 percent after rebounding a sharp 3.4 percent in July. Imports were flat in both August and July.
 A surprise within the report was the petroleum gap which worsened to $26.1 billion from $25.7 billion the prior month. The nonpetroleum goods gap shrank slightly to $34.3 billion from $34.5 billion in July. The services surplus slipped to $35.1 billion from $35.3 billion in July. Given that oil prices have come down in recent weeks, the petroleum gap is likely to improve in September. A surprise within the report was the petroleum gap which worsened to $26.1 billion from $25.7 billion the prior month. The nonpetroleum goods gap shrank slightly to $34.3 billion from $34.5 billion in July. The services surplus slipped to $35.1 billion from $35.3 billion in July. Given that oil prices have come down in recent weeks, the petroleum gap is likely to improve in September.
Turning to just goods, exports in August were virtually unchanged from the prior month. Increases occurred in industrial supplies and materials; consumer goods; foods, feeds, and beverages; and other goods. Decreases were seen in automotive vehicles and in capital goods.
The August rise in imports of goods reflected increases in industrial supplies and materials; other goods; and foods, feeds, and beverages. Decreases occurred in consumer goods; automotive vehicles; and capital goods. The softness in imports for consumer goods, autos, and capital equipment may reflect a downgrade in business expectations for demand in coming months.
The trade sector is likely to add to third quarter GDP growth. The second quarter trade deficit averaged $48.3 billion while the third quarter average for July and August is $45.6 billion. In chain dollars, the second quarter averaged $47.3 billion while the third quarter average so far is $46.5 billion. The chain dollar (real) numbers are input into real GDP. And importantly, despite monthly volatility, exports are still on an uptrend and that is good news for manufacturers.
 Import prices rose 0.3 percent in September, following a 0.2 percent dip the prior month. Leading the latest rise was a 0.3 percent gain in petroleum goods imports after dropping 1.6 percent in August. Import prices rose 0.3 percent in September, following a 0.2 percent dip the prior month. Leading the latest rise was a 0.3 percent gain in petroleum goods imports after dropping 1.6 percent in August.
Nonpetroleum imports prices advanced a more moderate 0.2 percent in September, following a 0.3 percent increase the month before.
 There is evidence of pass through to final goods. Import prices for consumer products are up 0.3 percent for the fourth month in a row that follows a 0.6 percent gain out to May. However, capital goods and also autos were not as strong, posting at 0.1 percent for both in September. There is evidence of pass through to final goods. Import prices for consumer products are up 0.3 percent for the fourth month in a row that follows a 0.6 percent gain out to May. However, capital goods and also autos were not as strong, posting at 0.1 percent for both in September.
On a year-ago basis, overall import price inflation grew hotter in September, coming in at 13.4 percent, compared to 13.0 percent the month before. Excluding petroleum, the September pace eased marginally to 5.5 percent from 5.6 percent in August.
 The latest FOMC minutes clearly show that there are notable differences of opinions about what monetary policy is appropriate. At the September 20 to 21 FOMC meeting, committee members voted seven to three for a somewhat complex policy, given the elevated level of the Fed’s balance sheet. The FOMC kept its key fed funds rate target at zero to 0.25 percent. The Fed has provided guidance that policy rates are likely to remain low until at least mid-2013. In addition, the FOMC adopted the Maturity Extension Program—or “Operation Twist” which appears to be a combination of compromise along with further study and debate on additional initiatives. The latest FOMC minutes clearly show that there are notable differences of opinions about what monetary policy is appropriate. At the September 20 to 21 FOMC meeting, committee members voted seven to three for a somewhat complex policy, given the elevated level of the Fed’s balance sheet. The FOMC kept its key fed funds rate target at zero to 0.25 percent. The Fed has provided guidance that policy rates are likely to remain low until at least mid-2013. In addition, the FOMC adopted the Maturity Extension Program—or “Operation Twist” which appears to be a combination of compromise along with further study and debate on additional initiatives.
Most participants saw a slowing the economy and a need for additional action based on the downgraded outlook. While most agreed that extending the average maturity of Fed holdings would help the economy by lowering longer term interest rates, some believed large asset purchases (another quantitative easing or QE3) would be more potent. However, some participants worried that another round of quantitative easing would raise inflation risks too much. Most FOMC members favored increased monetary policy transparency as a way to bolster the impact of policy. On whether the Fed should lower the interest rate on excess reserves, some were doubtful of much impact and most agreed that more study on this tool is needed.
The Fed certainly will have continued internal debate on future policy. But the three dissenters rotate off the voting membership in 2012 which points to less dissent in 2012. Of the four replacements in 2012, Atlanta’s Lockhart has leaned toward dovish positions as has San Francisco’s Williams. Cleveland’s Pianalto has followed the middle ground. However, Richmond’s Lacker is almost certain to make hawkish dissenting votes. At the November and December FOMC meetings of this year, we get to see if Kansas City’s newly installed Esther George is as hawkish as just retired Thomas Hoenig was.
The limited economic news this past week was better than expected and moderately encouraging. But the coming week is loaded with indicators and will clarify whether the third quarter—and even the early part of the fourth quarter—is gaining momentum.
Upcoming news runs the gamut on manufacturing, housing, and inflation. Empire State and industrial production post on Monday and the Philly Fed prints on Thursday for an update on the health of the manufacturing sector. Housing is updated with housing starts (Wednesday) and existing home sales (Thursday). The PPI and CPI are released Tuesday and Wednesday respectively. At mid-week, the Fed’s Beige Book will garner trader attention.
The Empire State manufacturing index for September nudged marginally lower in contraction territory, posting at minus 8.82 versus minus 7.72 the month before. September was the fourth straight negative single-digit reading. October also is likely to be weak as new orders were also in the negative column for the fourth straight month at minus 8.00 and compared to minus 7.82 in August.
Empire State Manufacturing Survey Consensus Forecast for October 11: -3.25
Range: -7.50 to 0.00
Industrial production softened in August, rising 0.2 percent, following a 0.9 percent jump the month before. Sluggishness was related to utilities. By major industry, manufacturing remained strong with a 0.5 percent rise after a robust 0.6 percent gain in July. The auto component advanced another 1.7 percent after a rebound of 4.5 percent in July. In other major sectors, utilities output fell back 3.0 percent after surging 2.8 percent in July on atypically hot weather. Mining output grew 1.2 percent after increasing 1.1 percent in July. Overall capacity utilization in August edged up to 77.4 percent from 77.3 percent the prior month. Looking ahead, the manufacturing component outside of autos is likely to be soft in September as production worker hours in manufacturing were flat for the month.
Industrial production Consensus Forecast for September 11: +0.2 percent
Range: 0.0 to +0.4 percent
Capacity utilization Consensus Forecast for September 11: 77.5 percent
Range: 77.2 to 77.7 percent
The producer price index in August eased despite a surge in food prices. Producer prices were unchanged after rebounding 0.2 percent in July. By major components, energy fell 1.0 percent after dipping 0.6 percent the month before. Gasoline dropped 1.0 percent, following a 2.8 percent decrease in July. Food costs, in contrast, surged 1.1 percent after jumping 0.6 percent the month before. At the core level, PPI inflation slowed to a 0.1 percent pace after accelerating to 0.4 percent in July.
PPI Consensus Forecast for September 11: +0.3 percent
Range: -0.2 to +0.6 percent
PPI ex food & energy Consensus Forecast for September 11: +0.1 percent
Range: 0.0 to +0.2 percent
The NAHB Housing Market Index slipped one point in September to 14. Since the expiration of the home buyer tax credit in June last year this index has held between 13 and 17. The breakeven level for this index is 50 in a signpost for how depressed conditions are.
NAHB Housing Market Index Consensus Forecast for October 11: 15
Range: 14 to 15
The consumer price index in August barely slowed to a 0.4 percent increase, following a strong 0.5 percent jump in July. Excluding food and energy, the CPI rose 0.2 percent, matching the pace the month before. For major components, energy continued to rise with a 1.2 percent increase after rebounding 2.8 percent in July. Gasoline increased 1.9 percent, following a 4.7 percent jump in July. Food price inflation accelerated, rising 0.5 percent after jumping 0.4 percent the prior month. Within the core, shelter and apparel were the biggest contributors to the gain.
CPI Consensus Forecast for September 11: +0.3 percent
Range: 0.0 to +0.4 percent
CPI ex food & energy Consensus Forecast for September 11: +0.2 percent
Range: 0.0 to +0.2 percent
Housing starts declined 5.0 percent in August, following a 2.3 percent decrease in July. The August annualized pace of 0.571 million units was down 5.8 percent on a year-ago basis. However, a rebound in permits suggests that some of the weakness in starts was weather related as Hurricane Irene likely weighed on new groundbreaking in the Northeast and parts of the South. In contrast to starts, housing permits rebounded 3.2 percent, following a 2.6 percent contraction in July. Permit issuance is less affected by weather since they are issued indoors.
Housing starts Consensus Forecast for September 11: 0.590 million-unit rate
Range: 0.565 million to 0.643 million-unit rate
Housing permits Consensus Forecast for September 11: 0.620 million-unit rate
Range: 0.595 million to 0.680 million-unit rate
The Beige Book is for the November 1-2 FOMC meeting. Traders will be looking for whether the economy is showing signs of strengthening or not as the basis for the Fed to consider another round of quantitative easing. While all sectors are important, indications of any improvement or worsening in the labor market likely will stand out.
Initial jobless claims slipped a very slight 1,000 in the October 8 week to 404,000 with the October 1 week revised 4,000 higher to 405,000. But these levels are still over 400,000 and were a disappointment given the brief dip to 395,000 in the September 24 week. But the four-week average is definitely moving in the right direction, down 7,000 for a third straight dip to a 408,000 level that is more than 10,000 below the month-ago comparison. Continuing claims fell 55,000 to 3.670 million with the four week average, at 3.724 million, down 25,000 from a month ago.
Jobless Claims Consensus Forecast for 10/15/11: 400,000
Range: 397,000 to 410,000
Existing home sales in August surged a monthly 7.7 percent in August to an annual rate of 5.03 million. All regions showed gains with strength centered in the key single-family component where sales jumped 8.5 percent. The sales surge drew supply on the market down by 3.0 percent to 3.577 million units. In terms of months at the current sales rate, supply fell sharply, to 8.5 months from 9.5 months in the prior month.
Existing home sales Consensus Forecast for September 11: 4.93 million-unit rate
Range: 4.75 to 5.25 million-unit rate
The general business conditions index of the Philadelphia Fed's Business Outlook Survey in September contracted for the second straight month but at a less severe rate, improving to minus 17.5 from August's severely negative reading of minus 30.7. Order readings unfortunately were also negative, at minus 11.3 for new orders, less severe than August's minus 26.8 level, with unfilled orders at minus 10.4 versus August's minus 20.9.
Philadelphia Fed survey Consensus Forecast for October 11: -9.8
Range: -15.0 to -5.0
The Conference Board's index of leading indicators rose 0.3 percent in August, following a 0.6 percent boost the month before. The biggest contributor to the latest rise was money supply with a 0.7 percentage point contribution—meaning the index would have fallen 0.4 percent without this component. With the plunge in the stock market and increased fear in financial markets overall, investors and traders moved money out of mutual funds and other investment accounts into cash—flight to safety. The second most positive component in August was the yield spread which has been a leading plus for this report throughout the recovery reflecting the Fed's near zero short rate policy. The drop in stock prices was August's biggest negative followed by consumer expectations and the factory workweek.
Leading indicators Consensus Forecast for September 11: +0.3 percent
Range: -0.3 to +0.5 percent
R. Mark Rogers is the author of The Complete Idiot’s Guide to Economic Indicators, Penguin Books, 2009.
Econoday Senior Writer Mark Pender contributed to this article.
|
