|
While financial developments in Europe have been the focus of traders, one of this past week’s economic indicators raises questions about the health of the consumer sector. And instead of improving, the data suggest net that the consumer sector is relapsing though hopefully modestly and only temporarily. Meanwhile, the housing sector remains stable but still on life support.
 At the start of the week, U.S. stocks got some lift from speculation originating over the weekend that European officials were considering more aggressive steps to counter the continent’s fiscal and banking crisis. Late in Monday trading, a report came out that a plan is being developed, specifically that would allow banks weighed down by bad European sovereign debt to exchange it for bonds issued by the European Investment Bank. Stocks continued to rally Tuesday, sparked by eurozone efforts to solidify the region's rescue fund in an attempt to alleviate the debt crisis. At the start of the week, U.S. stocks got some lift from speculation originating over the weekend that European officials were considering more aggressive steps to counter the continent’s fiscal and banking crisis. Late in Monday trading, a report came out that a plan is being developed, specifically that would allow banks weighed down by bad European sovereign debt to exchange it for bonds issued by the European Investment Bank. Stocks continued to rally Tuesday, sparked by eurozone efforts to solidify the region's rescue fund in an attempt to alleviate the debt crisis.
At midweek, stocks fell back significantly as doubts grew that not as much progress was being made on resolving the Greek debt crisis. Contributing to the downdraft was news that bans on short selling in France, Italy and Spain had been extended.
 Economic data moved to the fore on Thursday as jobless claims dropped sharply and fell below the critical 400,000 level. Also supporting the rally, pending homes slipped less than expected and the German Parliament approved the latest bailout package for Greece. Economic data moved to the fore on Thursday as jobless claims dropped sharply and fell below the critical 400,000 level. Also supporting the rally, pending homes slipped less than expected and the German Parliament approved the latest bailout package for Greece.
At week’s close and the last day of the third quarter, equities dropped sharply in thin trading as worries about European sovereign debt and contagion dominated. Also, personal income posted a modest decline instead of the expected modest increase. However, the Chicago PMI and consumer sentiment marginally beat expectations.
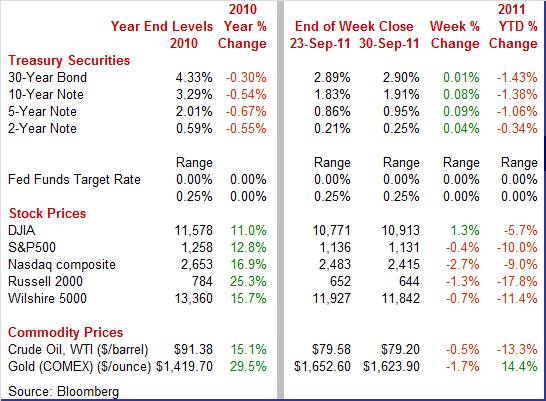
 Equities were mostly down this past week as follows: the Dow was up 1.3 percent; the S&P 500, down 0.4 percent; the Nasdaq, down 2.7 percent; and the Russell 2000, down 1.3 percent. Equities were mostly down this past week as follows: the Dow was up 1.3 percent; the S&P 500, down 0.4 percent; the Nasdaq, down 2.7 percent; and the Russell 2000, down 1.3 percent.
Equities were down sharply in September with key factors being intensified concern about the European debt crisis, a Fed downgrade to its economic outlook, and soft economic news—especially for employment. The Dow was down 6.0 percent; the S&P 500, down 7.2 percent; the Nasdaq, down 6.4 percent; and the Russell 2000, down 11.4 percent.
Stocks also posted heavy losses for the quarter with some of the same factors in September coming into play earlier in the quarter. Also, political wrangling over the federal debt ceiling and Standard & Poor’s downgrade of the U.S. credit rating helped push stocks down. For the third quarter, the Dow was down 12.1 percent; the S&P 500, down 14.3 percent; the Nasdaq, down 12.9 percent; and the Russell 2000, down 22.1 percent.
For the year-to-date, the Dow is down 5.7 percent; the S&P 500, down 10.0 percent; the Nasdaq, down 9.0 percent; and the Russell 2000, down 17.8 percent.
Weekly percent change column reflects percent changes for all components except interest rates. Interest rate changes are reflected in simple differences.
 Treasury rates rebounded moderately this past week, largely on partial reversal of flight to safety. Yields rose Monday and Tuesday on optimism on progress on resolution of the Greek debt crisis and on gains in equities. Treasury rates rebounded moderately this past week, largely on partial reversal of flight to safety. Yields rose Monday and Tuesday on optimism on progress on resolution of the Greek debt crisis and on gains in equities.
Rates were little changed Wednesday and also on Thursday despite a large drop in jobless claims. Treasury rates declined Friday as traders took positions ahead of the coming week’s start of the Fed’s Operation Twist.
For this past week Treasury rates were up as follows: 3-month T-bill, up 2 basis points; the 2-year note, up 4 basis points; the 5-year note, up 9 basis points; the 7-year note, up 10 basis points; the 10-year note, up 8 basis points; and the 30-year bond, up 1 basis point.
 Even though yields firmed for the past week, for the quarter, Treasury yields were down significantly for mid-range and long maturities on flight to safety on European debt concerns and sharp declines in equities. The Fed’s downgrade to its economic outlook and the announcement of Operation Twist also weighed on rates. Even though yields firmed for the past week, for the quarter, Treasury yields were down significantly for mid-range and long maturities on flight to safety on European debt concerns and sharp declines in equities. The Fed’s downgrade to its economic outlook and the announcement of Operation Twist also weighed on rates.
For the third quarter, Treasury rates were down as follows: 3-month T-bill, down 5 basis points; the 2-year note, down 22 basis points; the 5-year note, down 81 basis points; the 7-year note, down 107 basis points; the 10-year note, down 125 basis points; and the 30-year bond, down 148 basis points.
 Oil prices were net flat for the week although there was some daily volatility. The spot price of West Texas Intermediate surged over $4 per barrel on Tuesday on perceived progress on Greek debt problems but sentiment went in the other direction the next day, bumping crude down more than $3 per barrel at mid-week. WTI spot dropped almost $3 per barrel Friday on negative economic news out of China and on the dip in personal income for the U.S. Oil prices were net flat for the week although there was some daily volatility. The spot price of West Texas Intermediate surged over $4 per barrel on Tuesday on perceived progress on Greek debt problems but sentiment went in the other direction the next day, bumping crude down more than $3 per barrel at mid-week. WTI spot dropped almost $3 per barrel Friday on negative economic news out of China and on the dip in personal income for the U.S.
Net for the week, the spot price for West Texas Intermediate edged down 38 cents per barrel to settle at $79.20—the lowest settle since September 2010.
Economic news was mixed but showed a still soft economy and with new signs of weakness for the consumer sector.
 Economic growth for the second quarter ended up stronger than previously estimated but remained anemic. The Commerce Department’s final estimate for second quarter GDP growth was bumped up to a rise of 1.3 percent annualized, compared to the prior estimate of 1.0 percent annualized and to first quarter growth of 0.4 percent. Economic growth for the second quarter ended up stronger than previously estimated but remained anemic. The Commerce Department’s final estimate for second quarter GDP growth was bumped up to a rise of 1.3 percent annualized, compared to the prior estimate of 1.0 percent annualized and to first quarter growth of 0.4 percent.
Demand was somewhat stronger than previously believed but still soft. Final sales of domestic product were revised to an annualized 1.6 percent from the previous estimate of 1.2 percent. Final sales to domestic purchasers (excludes net exports) were revised up to 1.3 percent from the second estimate of 1.1 percent annualized. By components, the most notable upward revisions were to nonresidential structures, PCEs, and exports.
Economy-wide inflation was revised up incrementally to 2.5 percent annualized, compared to the previous estimate of 2.4 percent and the first quarter rise of 2.5 percent.
Overall, economic growth was very sluggish during the first half of 2011. More recent monthly data are very mixed but net suggest marginal strengthening at best for the third quarter.
 Personal income gains hit a recent high in January of this year but have been softening over the rest of the year. Growth in personal income not just slowed in August but declined slightly—but it should not have been a surprise. Personal income in August slipped 0.1 percent, following a 0.1 percent gain the month before. Personal income gains hit a recent high in January of this year but have been softening over the rest of the year. Growth in personal income not just slowed in August but declined slightly—but it should not have been a surprise. Personal income in August slipped 0.1 percent, following a 0.1 percent gain the month before.
Leading the decline, the wages & salaries component decreased 0.2 percent after a 0.3 percent boost in July. The weakness in wages & salaries was consistent with the 0.4 percent drop in private aggregate earnings in the employment situation report. Weakness in wages & salaries was led by privates services but private goods-producing industries also declined in August. The government component posted a modest rise.
 Consumer spending rose a modest 0.2 percent in August, following a sharp 0.7 percent surge the prior month. By components, durables edged down 0.1 percent after surging 2.2 percent in July as auto sales leveled. Nondurables advanced 0.3 percent, following a 0.5 percent gain in July. Services rose 0.2 percent after jumping 0.6 percent the month before. Consumer spending rose a modest 0.2 percent in August, following a sharp 0.7 percent surge the prior month. By components, durables edged down 0.1 percent after surging 2.2 percent in July as auto sales leveled. Nondurables advanced 0.3 percent, following a 0.5 percent gain in July. Services rose 0.2 percent after jumping 0.6 percent the month before.
But in inflation-adjusted terms, spending was unchanged in August after a 0.4 percent advance in July.
On the inflation front, the headline PCE price index eased to a 0.2 percent rise from 0.4 percent in July. The core rate softened to a 0.1 percent uptick, following a 0.2 percent increase in July. Year-on-year, headline prices are up 2.9 percent, compared to 2.8 percent in July. The core is up 1.6 percent on a year-ago basis, matching the pace the month before. Clearly, headline inflation is above the Fed’s implicit inflation target range of 1.5 to 2.0 percent but recent declines in oil prices should help ease headline inflation.
But the weakness in income growth will likely have economists nudging down their forecasts for second half GDP growth. Overall, personal income growth has decelerated along with employment growth. Similarly, personal spending has decelerated outside of catch up in auto sales from supply disruptions. Overall economic growth in the near term likely will not be getting the typical support provided by consumer spending.
 The mood of consumers improved marginally in September but measures remain at depressed levels. The Conference Board’s consumer confidence index edged up two tenths to 45.4 in September. Improvement was in expectations which rose to 54.0 from 52.4 in August. The present situation index dropped to 32.5 from 34.3 as consumers reacted to heavy stock markets losses and a soft labor market. The mood of consumers improved marginally in September but measures remain at depressed levels. The Conference Board’s consumer confidence index edged up two tenths to 45.4 in September. Improvement was in expectations which rose to 54.0 from 52.4 in August. The present situation index dropped to 32.5 from 34.3 as consumers reacted to heavy stock markets losses and a soft labor market.
And it is the labor market that consumers are most concerned about. Fifty percent of the Conference Board's sample say jobs are currently hard to get which is up a tangible 1.5 percentage points from August and compares with 44.8 percent in July and 43.2 percent June.
The Reuters/University of Michigan measure of the consumer mood also improved marginally as the consumer sentiment index finished the month of September at 59.4 versus 57.8 at mid-month and 55.7 at month-end August. The 1.6 point gain in the month-end to mid-month September comparison implies a 61.0 reading for the last two weeks of the month. Though higher than the shock-infested month of August, this reading is the weakest since the recession period of early 2009.
In contrast to the consumer confidence report, the sentiment report showed improvement in the assessment of current conditions. The assessment of future conditions improved both reports.
Overall, the consumer sector is still modestly positive net but is still struggling.
 While the consumer sector is losing some steam, manufacturing is still holding up. Durables orders edged down in August, but after such a strong July, the pace is still healthy. New factory orders for durables in August nudged down 0.1 percent, following a 4.1 percent surge in July. Excluding transportation, durables slipped 0.1 percent after rising 0.7 percent in July. While the consumer sector is losing some steam, manufacturing is still holding up. Durables orders edged down in August, but after such a strong July, the pace is still healthy. New factory orders for durables in August nudged down 0.1 percent, following a 4.1 percent surge in July. Excluding transportation, durables slipped 0.1 percent after rising 0.7 percent in July.
Components were mixed. On the downside in August were primary metals, down 0.8 percent; fabricated metals, down 0.5 percent; transportation, down 0.3 percent; and “other,” down 0.8 percent. On the plus side were machinery, up 0.1 percent; computers & electronics, up 1.3 percent; and electrical equipment, up 1.3 percent.
 Turning to the investment numbers in the durables report, a big positive was a 1.1 percent rebound in nondefense capital goods excluding aircraft, following a 0.2 percent decline in July. Shipments for this series jumped 2.8 percent in August after a 0.4 percent rise the month before. Turning to the investment numbers in the durables report, a big positive was a 1.1 percent rebound in nondefense capital goods excluding aircraft, following a 0.2 percent decline in July. Shipments for this series jumped 2.8 percent in August after a 0.4 percent rise the month before.
Overall, manufacturing remains on a moderate uptrend, taking into account the volatility of durables orders. While businesses may not be hiring people, it clearly looks like they are “hiring” equipment with the rise in nondefense capital goods excluding aircraft. Based on strong shipments, this will be a plus for third quarter equipment investment and export components in GDP.
 New home sales remain lifeless, slipping 2.3 percent in August, to a nine-month low of 295,000 annualized versus 302,000 in July. New home sales remain lifeless, slipping 2.3 percent in August, to a nine-month low of 295,000 annualized versus 302,000 in July.
Prices were hard hit in August, buckling 8.7 percent for the median, down to $209,100. On a year-on-year basis, prices had been showing mid-single digit gains in the prior two months but not anymore with the median price down 7.7 percent. An ongoing caveat is that prices are not based on repeat sales (new homes have never been sold before) and the median price can be affected by shifts in sales between the low and high ends.
Anemic sales and weak prices have scared supply off the market. The level of supply on the market is at a record low 162,000 units. But supply relative to sales remains moderately heavy at 6.6 months at the current sales rate compared to 6.5 months in July. New homes, especially weighed down by competition from foreclosures, are perhaps the hardest hit of any of the economy's sectors.
However, sales might rebound somewhat in September as Hurricane Ira likely kept buyers from home shopping in parts of the eastern seaboard. By region, the Northeast showed the biggest drop—suggesting that the hurricane did dampen sales. Also, potential purchases may have been given pause by the August plunge in stock prices. Nonetheless, homebuilders have little incentive to ramp up new construction for some time.
 Pending home sales weakened in August but much of the dip was likely related to Hurricane Irene. Fewer buyers signed contracts to purchase existing homes in August as the pending home sales index fell 1.2 percent to 88.6. Pending home sales weakened in August but much of the dip was likely related to Hurricane Irene. Fewer buyers signed contracts to purchase existing homes in August as the pending home sales index fell 1.2 percent to 88.6.
August's data show declines in contracts signings in three of four regions with the largest region, the South, showing a small increase. The National Association of Realtors, which compiles the reports, notes that the month's sizable 5.8 percent decline in the Northeast is tied to Hurricane Irene.
But a disconcerting trend is that the proportion of contracts successfully closing has fallen in recent months due to credit and appraisal problems and August sluggish level is likely to translate into fewer sales of existing home.
 Home price trends are holding steady based on S&P Case-Shiller data that, for July's adjusted composite-20 index, show a third straight unchanged reading. Half of the 20 cities tracked showed declines with eight gaining and two unchanged. Weakness was concentrated in the West including a third straight decline for Phoenix, San Diego and LA and a sixth straight decline for Las Vegas. Gainers are led by Detroit, Chicago and Washington DC. Home price trends are holding steady based on S&P Case-Shiller data that, for July's adjusted composite-20 index, show a third straight unchanged reading. Half of the 20 cities tracked showed declines with eight gaining and two unchanged. Weakness was concentrated in the West including a third straight decline for Phoenix, San Diego and LA and a sixth straight decline for Las Vegas. Gainers are led by Detroit, Chicago and Washington DC.
Case-Shiller data are based on repeat transactions and are more reliable measures of home prices though they do lag other home-price information including those in the existing and new home sales reports.
Summer is a seasonally strong period for housing demand as seen in the unadjusted data that showed a 0.9 percent rise for the composite-20 index and followed June's 1.2 percent gain. But the unadjusted year-on-year rate, at minus 4.1 percent, underscores the housing sector's continuing weakness. The minus 4.1 percent reading, though, is an improvement from minus 4.4 and minus 4.5 percent in the prior two months.
Housing remains anemic and the consumer sector has softened substantially. Manufacturing is the economy’s best hope for improvement in growth in the second half. But what is really needed is for the consumer sector to get a lift from healthier job growth—and that issue will be the focus next week.
The week’s highlight will be Friday’s employment situation report -- traders will get their chances to tweak their forecasts with ADP employment on Wednesday and jobless claims Thursday. But on Monday, the ISM’s manufacturing survey along with motor vehicle sales will capture investors' attention followed mid-week by the ISM nonmanufacturing report.
Sales of domestic light motor vehicles were essentially steady in August at a 9.4 million annual rate versus July's 9.5 million rate. Imports posted at 2.7 million units—the same as the prior two months. Combined domestics and imports sold at 12.1 million units annualized in August, following 12.2 million in July and 11.6 million in June. We may get a bump up as Hurricane Irene kept shoppers away from the showroom in parts of the East coast in August and the lost sales may show up in September.
Motor vehicle domestic sales Consensus Forecast for September 11: 10.0 million-unit rate
Range: 9.8 to 12.0 million-unit rate
Motor vehicle total sales Consensus Forecast for September 11: 12.6 million-unit rate
Range: 12.2 to 13.0 million-unit rate
The composite index from the ISM manufacturing survey edged three tenths lower to a plus-50 reading of 50.6 that still indicates monthly expansion in general activity though at a very slow rate. The composite was held back by a slowing in employment and a slight monthly contraction in production. The new orders index was up four tenths to 49.2.
ISM manufacturing composite index Consensus Forecast for September 11: 50.5
Range: 49.0 to 52.0
Construction spending in July declined 1.3 percent, following a revised 1.6 percent advance in June. The July decrease was led by a drop in public sector outlays with private residential and private nonresidential also slipping. Looking ahead, the 5.0 percent drop in August housing starts points to weakness in the private residential component of construction outlays although recently alternating severe weather may impact the numbers.
Construction spending Consensus Forecast for August 11: -0.2 percent
Range: -0.9 to +1.9 percent
Factory orders in July rose 2.4 percent, split between a 4.1 percent rise for durable goods and a 1.0 percent rise on the non-durables side. More recently, durables orders in August nudged down 0.1 percent and orders excluding transportation slipped 0.1 percent.
Factory orders Consensus Forecast for August 11: -0.3 percent
Range: -0.8 to +0.4 percent
ADP private payroll employment for August was calculated to be a 91,000 rise. The Bureau of Labor Statistics posted private payrolls at a 17,000 rise with total nonfarm employment unchanged for the month of August
ADP private payrolls Consensus Forecast for September 11: 90,000
Range: -10,000 to 100,000
The composite index from the ISM non-manufacturing survey in August edged 0.6 points higher to 53.3. The reading was above 50 and indicates monthly growth in activity, albeit modest growth. New orders showed a slight but welcome monthly acceleration to 52.8 for a 1.1 point gain from July.
ISM non-manufacturing composite index Consensus Forecast for September 11: 52.9
Range: 51.3 to 54.2
Initial jobless claims fell 37,000 in the week ending September 24 to 417,000. The Labor Department attributed the drop partly to state offices catching up with hurricane-related data. Seasonal adjustment problems tied to calendar shifts may also have come into play.
Jobless Claims Consensus Forecast for 10/1/11: 410,000
Range: 395,000 to 415,000
Nonfarm payroll employment was unchanged in August, following a revised 85,000 increase in July, and revised 20,000 in June. As in recent months, private sector employment was a little less weak since government jobs pulled down the total. Private nonfarm payrolls edged up 17,000 in August, following a 156,000 gain in July and a 75,000 increase in June. Earnings growth fell back from the auto-sector induced jump in July. Average hourly earnings slipped 0.1 percent after jumping 0.5 percent in July. The average workweek for all workers in August edged down to 34.2 hours from 34.3 in July. From the household survey, the unemployment rate posted at 9.1 percent, equaling the prior.
Nonfarm payrolls Consensus Forecast for September 11: 65,000
Range: 30,000 to 115,000
Private payrolls Consensus Forecast for September 11: 95,000
Range: 54,000 to 135,000
Unemployment rate Consensus Forecast for September 11: 9.2 percent
Range: 9.0 to 9.5 percent
Average workweek Consensus Forecast for September 11: 34.2 hours
Range: 34.2 to 34.3 hours
Average hourly earnings Consensus Forecast for September 11: +0.2 percent
Range: 0.0 to +0.5 percent
Consumer credit outstanding advanced $12.0 billion in July, following an $11.3 billion boost the prior month. The latest increase was due to a solid gain for auto sales in July as nonrevolving credit rose $15.4 billion. Nonrevolving credit has now risen for 11 straight months. In contrast, gains in revolving credit, reflecting credit-card use, have been hard to come by with the component down $3.4 billion in July to end a short run of strength. An incremental dip in motor vehicle sales in August points toward softness in credit growth for the month.
Consumer credit Consensus Forecast for August 11: +$8.0 billion
Range: +$4.0 billion to +$10.9 billion
R. Mark Rogers is the author of The Complete Idiot’s Guide to Economic Indicators, Penguin Books, 2009.
Econoday Senior Writer Mark Pender contributed to this article.
|
