|
Equities pulled off a five-day rally this past week on encouraging news out of Europe. Economic news in the U.S. real economy was mostly soft while inflation data were mixed.
 Starting the week, stocks rallied the last hour of trading after being down during the day. The boost was fueled by reports that China may come to the aid of the eurozone by purchasing significant amounts of Italian bonds and also may make investments in strategic companies. Starting the week, stocks rallied the last hour of trading after being down during the day. The boost was fueled by reports that China may come to the aid of the eurozone by purchasing significant amounts of Italian bonds and also may make investments in strategic companies.
Tuesday’s gains got support from news out of France after Société Générale’s Chief Executive Officer Frederic Oudea said in an interview that the bank’s potential losses from European sovereign debt were manageable. German Chancellor Angela Merkel sought to silence talk of an imminent Greek default, saying Europe was doing everything in its power to avoid a default.
Shares were up for a third day after German and French leaders expressed support for Greece. French President Nicolas Sarkozy and German Chancellor Angela Merkel are “convinced” Greece will remain in the eurozone, according to a statement issued by Sarkozy after they spoke to Greek Prime Minister George Papandreou by telephone Wednesday. The Greek government said in its own statement that it is determined to carry out all budget plans. News out of Europe offset a disappointing report on U.S. retail sales.
The rally continued Thursday on news that the ECB coordinated with the Fed, the Bank of England, the Bank of Japan and the Swiss National Bank to provide three-month loans to euro-area banks to help make sure banks have enough cash for the rest of the year. In the U.S., a positive report on national industrial production partially offset disappointing Empire State and Philly Fed reports and disappointing initial jobless claims.
Friday was relatively quiet but notably positive and dominated by the cheerier mood from favorable developments in Europe. Stocks gained despite a depressed reading on consumer sentiment. Friday also was quadruple witching—the expiration for U.S. futures and options contracts on indexes and individual stocks.
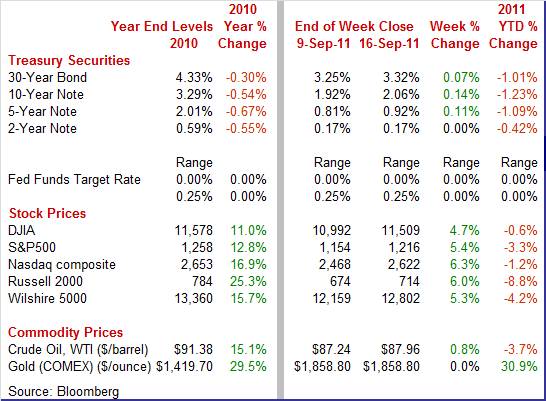
Equities were up significantly this past week. The Dow was up 4.7 percent; the S&P 500, up 5.4 percent; the Nasdaq, up 6.3 percent; and the Russell 2000, up 6.0 percent.
For the year-to-date, major indexes are down as follows: the Dow, down 0.6 percent; the S&P 500, down 3.3 percent; the Nasdaq, down 1.2 percent; and the Russell 2000, down 8.8 percent.
Weekly percent change column reflects percent changes for all components except interest rates. Interest rate changes are reflected in simple differences.
 Treasury yields were mostly up for the week—largely on favorable news regarding European sovereign debt problems. At the start of the week, rates rose on speculation that China will buy more Italian bonds. This led to some reversal of flight to safety to Treasuries. Treasury yields were mostly up for the week—largely on favorable news regarding European sovereign debt problems. At the start of the week, rates rose on speculation that China will buy more Italian bonds. This led to some reversal of flight to safety to Treasuries.
Treasury rates eased further Tuesday on comments by German Chancellor Angela Merkel that she will not allow Greece to go into “uncontrolled insolvency.”
 Rates were mixed and little changed at mid-week. But on Thursday, rates jumped on news that European Central Bank had coordinated with other central banks to provide liquidity for European banks. At week’s close, yields eased after European finance ministers dismissed the idea of boosting the sluggish European economy with tax cuts and other fiscal stimulus measures. Rates were mixed and little changed at mid-week. But on Thursday, rates jumped on news that European Central Bank had coordinated with other central banks to provide liquidity for European banks. At week’s close, yields eased after European finance ministers dismissed the idea of boosting the sluggish European economy with tax cuts and other fiscal stimulus measures.
For this past week Treasury rates were mostly up as follows: the 5-year note, up 11 basis points; the 7-year note, up 14 basis points; the 10-year note, up 14 basis points; and the 30-year bond, up 7 basis points. The 3-month T-bill edged down 2 basis points while the 2-year note was unchanged.
For broader trends, the 3-month T-bill is still hostage to the Fed’s near-zero fed funds target rate. Recently, the 2-year T-note has been acting like a T-bill after the Fed committed to keep fed funds exceptionally low through mid-2013. Long-rates have been tugged down by a sluggish recovery and recently by the possibility of the Fed extending the maturity range of its Treasury purchases in a possible policy move called Twist.
 The spot price of crude edged up marginally this past week. Crude rose moderately Monday as concern eased regarding European sovereign debt. This view continued to lift West Texas Intermediate on Tuesday—plus traders took the position the U.S. crude inventories fell the prior week due to production disruptions from severe storms in the Gulf of Mexico. At mid-week, although crude supplies were down, fuel inventories were up on weak demand, resulting in a dip in crude prices. After a quiet Thursday, spot crude WTI dipped on news that European finance ministers would not be pushing fiscal stimulus measures to boost the European economy. The spot price of crude edged up marginally this past week. Crude rose moderately Monday as concern eased regarding European sovereign debt. This view continued to lift West Texas Intermediate on Tuesday—plus traders took the position the U.S. crude inventories fell the prior week due to production disruptions from severe storms in the Gulf of Mexico. At mid-week, although crude supplies were down, fuel inventories were up on weak demand, resulting in a dip in crude prices. After a quiet Thursday, spot crude WTI dipped on news that European finance ministers would not be pushing fiscal stimulus measures to boost the European economy.
Net for the week, the spot price for West Texas Intermediate nudged up 72 cents per barrel to settle at $87.96.
Economic news was mixed with the consumer sector notably soft.
 The consumer sector is sputtering for the most part. Retail sales in August came in softer than expected. Overall retail sales in August slowed to flat after rising 0.3 percent in July. The August figure was below the market median estimate for a 0.2 percent boost. The consumer sector is sputtering for the most part. Retail sales in August came in softer than expected. Overall retail sales in August slowed to flat after rising 0.3 percent in July. The August figure was below the market median estimate for a 0.2 percent boost.
Excluding autos, sales edged up 0.1 percent, following a 0.3 percent rise in July (originally 0.5 percent). Gasoline sales rose 0.3 percent after jumping 0.9 percent in July. Sales excluding autos and gasoline in August increased 0.1 percent, following a 0.2 percent rise in July.
Outside of autos and gasoline, sales were mixed. On the upside, moderate strength was in electronics & appliance stores and sporting goods, hobby & book stores. Tugging down, the notables were miscellaneous store retailers and also clothing stores.
Clearly, the August retail sales numbers are somewhat disappointing. Hurricane Irene likely dampened sales a bit on the East Coast and we will need to see September numbers for further evaluation. Still, it looks like the consumer is being more cautious after the political circus over the debt ceiling legislation and retrenchment in equities. The latest retail sales number do not portend well for spending in the upcoming personal income report. Also, third quarter GDP forecasts are likely to be nudged down.
 Consumer sentiment improved in early September but remains extremely depressed. The Reuters/University of Michigan index of consumer sentiment rose to 57.8 for the mid-September reading from 55.7 for the final for August. Consumer sentiment improved in early September but remains extremely depressed. The Reuters/University of Michigan index of consumer sentiment rose to 57.8 for the mid-September reading from 55.7 for the final for August.
Improvement came from the current conditions component which gained to 74.5 from 68.7 at the end of August.
 Unfortunately, the consumer expectations component, in a reflection of the weak jobs market and recent trouble in the financial markets, is at the lowest point since the Iranian hostage and oil crisis more than 30 years ago. The assessment of the six-month outlook, which is the leading component of the consumer sentiment index, slipped four tenths at the mid-month reading to 47.0. As recently as May, this component was approaching a respectable 70. Unfortunately, the consumer expectations component, in a reflection of the weak jobs market and recent trouble in the financial markets, is at the lowest point since the Iranian hostage and oil crisis more than 30 years ago. The assessment of the six-month outlook, which is the leading component of the consumer sentiment index, slipped four tenths at the mid-month reading to 47.0. As recently as May, this component was approaching a respectable 70.
As seen in the latest consumer price index report, higher costs are likely part of what is keeping the consumer glum—not just high unemployment. Inflation expectations are up two tenths on the one-year outlook to 3.7 percent and up one tenth on the five-year outlook to 3.0 percent.
 After a strong July, manufacturing momentum remained relatively healthy in August—partly due to a continuing rebound in auto assemblies. But overall industrial production softened in August, rising 0.2 percent, following a 0.9 percent jump the month before (no revision). Sluggishness was related to utilities. After a strong July, manufacturing momentum remained relatively healthy in August—partly due to a continuing rebound in auto assemblies. But overall industrial production softened in August, rising 0.2 percent, following a 0.9 percent jump the month before (no revision). Sluggishness was related to utilities.
 By major industry, manufacturing remained strong with a 0.5 percent rise after a robust 0.6 percent gain in July. The auto component advanced another 1.7 percent after a rebound of 4.5 percent in July. By major industry, manufacturing remained strong with a 0.5 percent rise after a robust 0.6 percent gain in July. The auto component advanced another 1.7 percent after a rebound of 4.5 percent in July.
Motor vehicle production continued to recover from output constraints due to shortages of parts from Japan. Assemblies of light trucks and autos jumped to an annualized pace of 8.53 million units from 8.35 million in July and 7.59 million in June. The latest gain was primarily from increased auto assemblies as light trucks slipped.
Outside of autos, manufacturing is still healthy. Excluding motor vehicles, manufacturing rose 0.4 percent, following a 0.3 percent increase the prior month.
In addition to motor vehicles and parts, within durables notable gains were seen in primary metals; computer and electronic products; electrical equipment, appliances, and components; aerospace and miscellaneous transportation equipment; and furniture and related products. Within nondurables, strength was primarily petroleum and coal products.
In other major sectors, utilities output fell back 3.0 percent after surging 2.8 percent in July on atypically hot weather. Mining output grew 1.2 percent after increasing 1.1 percent in July.
Overall capacity utilization in August edged up to 77.4 percent from 77.3 percent the prior month.
Despite the negativism in various manufacturing surveys, national production numbers continue to look good—especially for manufacturing. But regional manufacturing surveys continued to raise questions about the health of this sector in September.
 Two key manufacturing areas continue to point to a recent contraction in manufacturing. Manufacturing conditions in New York State continue to contract at a steady but mild rate based on the Empire State index which, at minus 8.82 this month, shows its fourth straight negative single-digit reading and is marginally weaker than August's minus 7.72 reading. New orders, the most important leading indicator in the report, were also in the negative column for the fourth straight month at minus 8.00 and compared to minus 7.82 in August. Employment, which had provided encouragement in recent months, fell into the negative column, to minus 5.43 in September from plus 3.26 the month before. Two key manufacturing areas continue to point to a recent contraction in manufacturing. Manufacturing conditions in New York State continue to contract at a steady but mild rate based on the Empire State index which, at minus 8.82 this month, shows its fourth straight negative single-digit reading and is marginally weaker than August's minus 7.72 reading. New orders, the most important leading indicator in the report, were also in the negative column for the fourth straight month at minus 8.00 and compared to minus 7.82 in August. Employment, which had provided encouragement in recent months, fell into the negative column, to minus 5.43 in September from plus 3.26 the month before.
Future indexes were generally positive, suggesting that respondents expect business activity to improve in the months ahead, but optimism was well below levels observed earlier this year. The future general business conditions index advanced four points to 13.0, a low level by historical standards but still an indication that conditions are expected to improve. The future new orders and shipments indexes rose to similar levels.
 Business conditions in the Mid-Atlantic region contracted for the second straight month but at least they're contracting at a less severe rate. The Philly Fed's general business conditions index improved to minus 17.5 from August's severely negative reading of minus 30.7. This index has now posted negative readings in three of the last four months. Business conditions in the Mid-Atlantic region contracted for the second straight month but at least they're contracting at a less severe rate. The Philly Fed's general business conditions index improved to minus 17.5 from August's severely negative reading of minus 30.7. This index has now posted negative readings in three of the last four months.
Order readings unfortunately are also negative, at minus 11.3 for new orders, less severe than August's minus 26.8 level, with unfilled orders at minus 10.4 versus August's minus 20.9. Nonetheless, these September readings still show negative growth.
One positive is an increase in employment, to plus 5.8 from minus 5.2 though continued gains for the sample's workforce may not be in the cards given the contraction underway in orders and shipments.
Indicators for future activity remained positive and even strengthened this month. The broadest indicators for future activity improved notably, increasing 20 points and nearly reversed the 22-point decline in August. The indexes for future new orders and shipments also improved
Overall, the Empire State and Philly Fed reports show declining activity currently but expectations for improvement in coming months.
 Inflation at the consumer level remained surprisingly warm in August. The consumer price index in August barely slowed to a 0.4 percent increase, following a strong 0.5 percent jump in July. The August figure exceeded the median projection for a 0.2 percent increase. Excluding food and energy, the CPI rose 0.2 percent, matching the pace the month before. Inflation at the consumer level remained surprisingly warm in August. The consumer price index in August barely slowed to a 0.4 percent increase, following a strong 0.5 percent jump in July. The August figure exceeded the median projection for a 0.2 percent increase. Excluding food and energy, the CPI rose 0.2 percent, matching the pace the month before.
For major components, energy continued to rise with a 1.2 percent increase after rebounding 2.8 percent in July. Gasoline increased 1.9 percent, following a 4.7 percent jump in July. Food price inflation accelerated, rising 0.5 percent after jumping 0.4 percent the prior month.
 Within the core, shelter and apparel were the biggest contributors to the gain. Shelter rose 0.2 percent while apparel jumped 1.1 percent with the latter likely feeling pressure from higher costs for materials. Overall, most of the core’s major components posted increases, additionally including used cars and trucks, medical care, household furnishings and operations, recreation, tobacco, and personal care. The new vehicles index, unchanged for the second month in a row, was an exception. Within the core, shelter and apparel were the biggest contributors to the gain. Shelter rose 0.2 percent while apparel jumped 1.1 percent with the latter likely feeling pressure from higher costs for materials. Overall, most of the core’s major components posted increases, additionally including used cars and trucks, medical care, household furnishings and operations, recreation, tobacco, and personal care. The new vehicles index, unchanged for the second month in a row, was an exception.
The Fed definitely does not have to worry deflation currently. Year-on-year, overall CPI inflation worsened to 3.8 percent from 3.6 percent (seasonally adjusted) in July. The core rate accelerated to 2.0 percent from 1.8 percent on a year-ago basis. A key part of the boost in core inflation has been a recovery in shelter cost inflation which hit a recent low of minus 0.6 in May 2010 on a year-ago basis and now stands at up 1.6 percent. Within shelter, lodging is the strongest component at up 3.6 percent with rent at 2.0 percent and owners’ equivalent rent at 1.6 percent. Rent has been boosted by the difficulty by some in obtaining mortgage financing.
With the latest report, the core CPI hit the upper bound of the Fed’s implicit inflation target range of 1.5 to 2.0 percent. This will make it tougher for the doves in the FOMC to argue for another round of monetary easing at the September 20-21 FOMC meeting.
 Despite relatively strong numbers at the consumer level, there are hints that there may be some relief in the pipeline. At the producer level, inflation eased despite a surge in food prices. Producer prices in August were unchanged after rebounding 0.2 percent in July. Despite relatively strong numbers at the consumer level, there are hints that there may be some relief in the pipeline. At the producer level, inflation eased despite a surge in food prices. Producer prices in August were unchanged after rebounding 0.2 percent in July.
By major components, energy fell 1.0 percent after dipping 0.6 percent the month before. Gasoline dropped 1.0 percent, following a 2.8 percent decrease in July. Food costs, in contrast, surged 1.1 percent after jumping 0.6 percent the month before. Over 30 percent of the August advance in food can be traced to meat prices, which climbed 2.4 percent. Higher prices for processed poultry and eggs for fresh use also were major factors in the increase.
 At the core level, PPI inflation slowed to a 0.1 percent pace after accelerating to 0.4 percent in July. Weakness in the core included declines in prices for passenger cars (down 0.4 percent) and computers (down 2.6 percent). The dip for cars may be related to some relief in supply shortages from Japan. On the upside, the leader was tires (up 1.4 percent) which contributed over 20 percent of the August increase in the core. Higher prices for radio and television communication equipment also contributed to the rise in the finished core index. At the core level, PPI inflation slowed to a 0.1 percent pace after accelerating to 0.4 percent in July. Weakness in the core included declines in prices for passenger cars (down 0.4 percent) and computers (down 2.6 percent). The dip for cars may be related to some relief in supply shortages from Japan. On the upside, the leader was tires (up 1.4 percent) which contributed over 20 percent of the August increase in the core. Higher prices for radio and television communication equipment also contributed to the rise in the finished core index.
For the overall PPI, the year-ago pace in August came in at 6.5 percent, compared to 7.2 percent in July (seasonally adjusted). The core rate in July held steady at 2.5 percent on a year-ago basis (seasonally adjusted).
The third quarter may not regain as much strength as hoped unless manufacturing can continue to make solid advances. The consumer sector is not contributing as in recent quarters and housing is still depressed.
Investors will focus on the outcome of the two-day FOMC meeting on Wednesday. They will be looking to see if the Fed offers new easing to help the slumping economy. A trio of housing reports begins with housing starts (Tuesday), existing home sales (Wednesday) and FHFA house price index (Thursday). Leading indicators are on tap on Thursday as well.
Housing starts dipped 1.5 percent in July, following a 10.8 percent jump in June. The July annualized pace of 0.604 million units was up 9.8 percent on a year-ago basis. The decline in July was led by a 4.9 percent drop in the single-family component, following a 7.5 percent surge in June. The multifamily component continued upward, gaining 7.8 percent after jumping 21.2 percent the prior month. Homebuilders remained cautious as housing permits slipped 3.2 percent, following a 1.3 percent rise in June. The July pace of 0.597 million units annualized was up 3.8 percent on a year-ago basis.
Housing starts Consensus Forecast for August 11: 0.592 million-unit rate
Range: 0.570 million to 0.634 million-unit rate
Housing permits Consensus Forecast for August 11: 0.590 million-unit rate
Range: 0.570 million to 0.646 million-unit rate
Existing home sales fell 3.5 percent in July to a 4.67 million annual rate and followed a 0.6 percent rise in June. Supply on the market at the current sales pace turned higher to 9.4 months from 9.2 and 9.1 in the two prior months. In turn, the median price slipped 0.9 percent to $174,000 and down 0.8 percent for the average to $224,200. Year-on-year prices, which had turned positive in June, are back in the negative column, at minus 4.4 percent for the median.
Existing home sales Consensus Forecast for August 11: 4.75 million-unit rate
Range: 4.57 to 4.97 million-unit rate
The FOMC announcement at 2:15 p.m. ET for the September 20-21 FOMC policy meeting is expected to leave the fed funds target rate unchanged at a range of zero to 0.25 percent. However, even though some FOMC members are leaning toward additional easing, it is hardly certain. Traders will be watching whether there is a vote for QE3 or the so-called “twist”—the extension of maturities of Treasuries that the Fed purchases. And we may see rate cutting action with the Fed’s relatively new policy tool—interest paid on excess reserves.
FOMC Consensus Forecast for 6/21/11 policy vote on fed funds target range: unchanged at a range of zero to 0.25 percent
Initial jobless claims in the September 10 week rose 11,000 to an unexpectedly high 428,000. The Labor Department did not citing any effect from Hurricane Irene. Though there were no special factors for the September 10 week, the week was shortened by the Labor Day holiday which may be creating some noise.
Jobless Claims Consensus Forecast for 9/17/11: 420,000
Range: 415,000 to 430,000
The FHFA purchase only house price index rose a surprisingly strong 0.9 percent in June following a 0.4 percent increase in May. The year-on-year rate improved for a second straight month, to minus 4.3 percent compared to minus 6.2 in May and minus 6.3 percent in April.
FHFA purchase only house price index Consensus Forecast for July 11: +0.2 percent
Range: +0.1 to +0.5 percent
The Conference Board's index of leading indicators rose a very solid 0.5 percent in July, following a 0.3 percent gain the month before. However, July's strength was centered strongly in money supply with a 0.71 percentage point contribution. Normally, money supply growth means banks are lending which is a positive. But in this case, it appears that the jump in M2 was due to investors seeking safety and taking funds out of mutual funds and other investment accounts not a part of M2 and putting funds into more liquid cash-type accounts that are a part of M2. The stock market was a positive in July but that factor is a huge negative for August. Consumer expectations were a negative in July and fell further in August. Vendor performance, in this case fast delivery times, was a negative for July but more recently was a modest positive in August.
Leading indicators Consensus Forecast for August 11: 0.0 percent
Range: -0.3 to +0.4 percent
R. Mark Rogers is the author of The Complete Idiot’s Guide to Economic Indicators, Penguin Books, 2009.
Econoday Senior Writer Mark Pender contributed to this article.
|
