|
Equities swung violently this past week, initially pummeled by aftershock from a downgrade to the U.S. credit rating and then by a worsening in concern about the European sovereign debt crisis damaging European banks. Upswings popped on Fed news and on bottom fishing. Meanwhile, the economy was mixed.
 The week started on a huge down note Monday after the prior Friday evening downgrade by Standard & Poor’s to the U.S. credit rating from AAA to AA+. The downgrade was based on the economic outlook, a claim by S&P that there was not sufficient progress in the just enacted debt ceiling legislation to bring down the long-term deficit, and on the political atmosphere in Washington. While analysts, elected officials, and Treasury officials either rebutted the S&P findings as incorrect (allegations of a $2 trillion miscalculation by S&P) or inconsequential, investors saw the S&P move as confirming a belief that Washington is crippled in its ability to address economic issues and fled stocks. Adding to Monday’s downdraft, Standard & Poor’s announced additional downgrades, including cuts to the debt ratings of Fannie Mae and Freddie Mac and it lowered outlooks for companies including Warren Buffett's Berkshire Hathaway. The week started on a huge down note Monday after the prior Friday evening downgrade by Standard & Poor’s to the U.S. credit rating from AAA to AA+. The downgrade was based on the economic outlook, a claim by S&P that there was not sufficient progress in the just enacted debt ceiling legislation to bring down the long-term deficit, and on the political atmosphere in Washington. While analysts, elected officials, and Treasury officials either rebutted the S&P findings as incorrect (allegations of a $2 trillion miscalculation by S&P) or inconsequential, investors saw the S&P move as confirming a belief that Washington is crippled in its ability to address economic issues and fled stocks. Adding to Monday’s downdraft, Standard & Poor’s announced additional downgrades, including cuts to the debt ratings of Fannie Mae and Freddie Mac and it lowered outlooks for companies including Warren Buffett's Berkshire Hathaway.
Early Tuesday, stocks were up tentatively as investors awaited the afternoon FOMC policy statement. The Fed left its policy interest rate range at zero to 0.25 percent as expected but took an unprecedented step of explicitly stating that the duration of the exceptionally low target rate likely would last until mid-2013 to promote the ongoing economic recovery. A downgrade by the Fed of its outlook, however, sent stocks down. But by the end of the day, the extension of low rates was seen making stocks more attractive, resulting in a solid rebound for the day.
Stocks fell sharply on Wednesday, as investor attention was focused overseas on turmoil in the French banking sector, which has significant exposure to European debt including that of Italy, Greece and other troubled countries. Financial stocks led the declines on worries that any French bank problems could spread to the U.S. Overall stocks dropped on worries that European economic growth is grinding to a halt, damping global growth.
Equities swung back sharply Thursday with economic news actually being a key impetus as initial jobless claims dipped more than expected. Corporate news was positive with increased reports of insiders buying company stocks and news of corporate buybacks, and Warren Buffett was reported as being in a buy mode for Berkshire Hathaway’s holdings. Also, from Europe there was an easing of concern of a meltdown in the French banking system. Stocks rallied for a second day on Friday after favorable news on retail sales with gains broad-based. A dismal consumer sentiment number softened early gains but traders eventually discounted the sentiment number as overblown by recent events, notably the debt ceiling debate and stock market losses.
Despite wild swings during the week, most indexes ended the week down only moderately. The Dow was down 1.5 percent; the S&P 500, down 1.7 percent; the Nasdaq, down 1.0 percent; and the Russell 2000, down 2.4 percent.
For the year-to-date, major indexes are down as follows: the Dow, down 2.7 percent; the S&P 500, down 6.3 percent; the Nasdaq, down 5.5 percent; and the Russell 2000, down 11.0 percent.
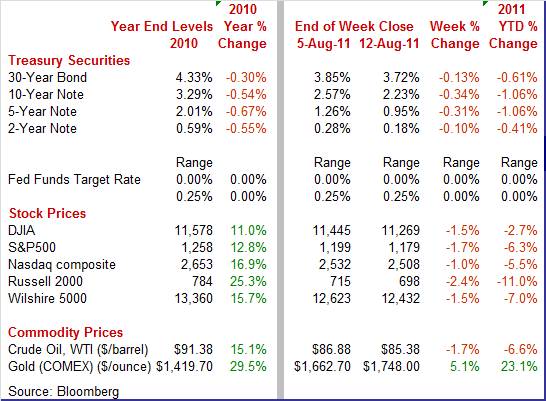
Weekly percent change column reflects percent changes for all components except interest rates. Interest rate changes are reflected in simple differences.
 Treasury yields fell sharply this past week, largely on flight to safety, on the Fed’s pledge to keep rates exceptionally low for another two years, and on the Fed’s weaker outlook for the economy. On Monday’s plunge in equities, funds quickly flowed to Treasuries with the 10-year T-bond dropping 22 basis points. Worries about growth in Europe also weighed on yields. Treasury yields fell sharply this past week, largely on flight to safety, on the Fed’s pledge to keep rates exceptionally low for another two years, and on the Fed’s weaker outlook for the economy. On Monday’s plunge in equities, funds quickly flowed to Treasuries with the 10-year T-bond dropping 22 basis points. Worries about growth in Europe also weighed on yields.
After the Fed’s policy statement on Tuesday rates fell further, putting the 2-year and 10-year  note yields at all-time lows. Basically, the Fed’s extension of the extended period has turned the 2-year note into a short-term bill. Demand was heavy for the Treasury’s sale of $32 billion in three-year notes, continuing the theme of flight to safety. Rates continued to fall at mid-week in the wake of the Fed’s decision to keep policy rates close to zero likely until mid-2013. The day’s auction of $24 billion in 10-year notes resulted in a record low auction rate for that maturity. The 10-year note auction posted a yield of 2.140 percent, below the previous record of 2.419 percent seen in January 2009 during the worst of the financial crisis. note yields at all-time lows. Basically, the Fed’s extension of the extended period has turned the 2-year note into a short-term bill. Demand was heavy for the Treasury’s sale of $32 billion in three-year notes, continuing the theme of flight to safety. Rates continued to fall at mid-week in the wake of the Fed’s decision to keep policy rates close to zero likely until mid-2013. The day’s auction of $24 billion in 10-year notes resulted in a record low auction rate for that maturity. The 10-year note auction posted a yield of 2.140 percent, below the previous record of 2.419 percent seen in January 2009 during the worst of the financial crisis.
 Rates reversed course on Thursday on an unexpected decline in initial jobless claims. With favorable corporate news added to the mix, funds flowed out of Treasuries and into strongly rising equities. Treasury yields eased the last day of trading as traders’ focus returned to the fact that the Fed is going to keep rates low for an exceptionally long time. Rates reversed course on Thursday on an unexpected decline in initial jobless claims. With favorable corporate news added to the mix, funds flowed out of Treasuries and into strongly rising equities. Treasury yields eased the last day of trading as traders’ focus returned to the fact that the Fed is going to keep rates low for an exceptionally long time.
For this past week Treasury rates were down as follows: the 2-year note, down 10 basis points; the 5-year note, down 31 basis points; the 7-year note, down 37 basis points; the 10-year note, down 34 basis points; and the 30-year bond, down 13 basis points. The 3-month T-bill was unchanged.
With recent credit downgrades, are the credit markets in bad shape' Or rather, how does the financial market actually rate the stability of credit markets' One measure is the TED spread. TED is short for Treasury-Eurodollar. The TED spread began as the difference between the yield on the Eurodollar minus the yield on the equivalent Treasury bill—a 3-month maturity for both. Today, the TED spread is the difference between the 3-month dollar-denominated LIBOR rate and the 3-month T-bill. This spread is an indicator of banks’ willingness to lend in the credit markets. When credit conditions are worsening, the LIBOR rises relative to the safe Treasury. Recently, the TED spread has nudged up on the concern over banks in Europe carrying questionable sovereign debt on their books. However, the spread’s current firming to about 28 basis points is moderately below the worst of the PIIGS crisis during mid-2010. Of course, recent events in Europe are still a continuation of the PIIGS crisis but at a more managed level.
The real point is that credit markets (despite volatility in rates and equities this week) are in far better shape than in 2008 and early 2009. Credit spreads are up but not dramatically. During the immediate aftermath of the Lehman Brothers and AIG crises, the TED spread surged to over 450 basis points—meaning credit was seizing and banks were not lending. Given the Fed’s continuation of a highly expanded balance sheet, liquidity is not an issue and traders agree according to only a moderate rise in the TED spread.
 The price of crude netted a modest weekly decline. The price of crude fell the first two days of the week. The spot price of West Texas Intermediate swooned $5-1/2 bucks Monday and another $2 on Tuesday, falling a little below $83 per barrel. On Monday, the key mover was flight to safety out of risky commodities to Treasuries and to the perceived safety of gold. On Tuesday, the Fed’s downgrade of it economic outlook bumped oil down further. The price of crude netted a modest weekly decline. The price of crude fell the first two days of the week. The spot price of West Texas Intermediate swooned $5-1/2 bucks Monday and another $2 on Tuesday, falling a little below $83 per barrel. On Monday, the key mover was flight to safety out of risky commodities to Treasuries and to the perceived safety of gold. On Tuesday, the Fed’s downgrade of it economic outlook bumped oil down further.
 At mid-week, oil rebounded over $3-1/2 per barrel on an unexpected drop in crude oil inventories. U.S. stockpiles fell a sharp 5.23 million barrels, or 1.5 percent, while analysts had projected a rise for the week. WTI spot rose almost another $3 per barrel on the drop in jobless claims and rose in tandem with the surge in equities. At close of the week, crude posted a modest gain on healthy retail sales. At mid-week, oil rebounded over $3-1/2 per barrel on an unexpected drop in crude oil inventories. U.S. stockpiles fell a sharp 5.23 million barrels, or 1.5 percent, while analysts had projected a rise for the week. WTI spot rose almost another $3 per barrel on the drop in jobless claims and rose in tandem with the surge in equities. At close of the week, crude posted a modest gain on healthy retail sales.
Net for the week, spot prices for West Texas Intermediate dropped $1.50 per barrel to settle at $85.38.
The real economy was mixed this past week and a little more negative than positive. On the plus side were retail sales and jobless claims. On the negative side were consumer sentiment and international trade. Also, the Fed came in mixed with a downgrade in its outlook but gave the markets a promise of easy liquidity for two years.
 Retail sales strengthened in July, led by a spurt in auto sales but with support from most other components. Overall retail sales in July jumped 0.5 percent, following a 0.3 percent rise the month before (originally up 0.1 percent). Auto sales continued to rebound, rising 0.4 percent, following a 0.7 percent jump in June. Retail sales strengthened in July, led by a spurt in auto sales but with support from most other components. Overall retail sales in July jumped 0.5 percent, following a 0.3 percent rise the month before (originally up 0.1 percent). Auto sales continued to rebound, rising 0.4 percent, following a 0.7 percent jump in June.
Excluding autos, sales were healthy, posting a 0.5 percent increase, following a 0.2 percent rise in June (originally flat). Sales excluding autos and gasoline in July advanced 0.3 percent, following a 0.5 percent rise in June. Outside of autos and gasoline, sales were mostly positive.
The good news is that retail sales gains were broad based as nine of 13 subcomponents retail categories were up, one was flat and only three were down. Overall, the consumer is still spending, although the pace is hardly gangbusters. Despite difficulties in the financial markets, the consumer has not withdrawn to the sidelines. While this week’s international trade numbers point to a downgrade in second quarter GDP, retail sales figures suggest some improvement for third quarter GDP. However, a recent question mark is how meaningful are recent numbers on consumer sentiment'
 Given the turmoil in Washington and in financial markets, it should be no surprise that consumers are in a really bad mood. The Reuters/University of Michigan index fell 8.9 points to 54.9 which is just below levels during the worst of the 2008 meltdown. This is nearly a record low, being the lowest reading since May 1980 during the period of the Iranian hostage crisis and 1980 recession. Given the turmoil in Washington and in financial markets, it should be no surprise that consumers are in a really bad mood. The Reuters/University of Michigan index fell 8.9 points to 54.9 which is just below levels during the worst of the 2008 meltdown. This is nearly a record low, being the lowest reading since May 1980 during the period of the Iranian hostage crisis and 1980 recession.
The expectations component, which is the leading component, fell 10.3 points to 45.7, a level that is severely depressed and near a record low. The current conditions component fell less severely, down more than six points to 69.3.
Given recent political and financial events, the consumer has much to be worried about. Again, the question is how much is this recent reading going to impact consumer spending' There is not always a one-to-one correlation between sentiment and spending and with the labor market improving marginally, those with jobs may keep opening their wallets. Hopefully, the extension of the federal debt ceiling and recent rallies for the equity markets will boost month-end readings for sentiment.
 Despite help from lower oil and commodities prices, the U.S., trade deficit worsened further in June to $53.1 billion, following the unexpected ballooning of the gap the month before to $50.8 billion. Weakness was led by exports which dropped 2.3 percent after slipping 0.5 percent in May. Imports actually dipped 0.8 percent, following a 2.9 percent jump the prior month. Despite help from lower oil and commodities prices, the U.S., trade deficit worsened further in June to $53.1 billion, following the unexpected ballooning of the gap the month before to $50.8 billion. Weakness was led by exports which dropped 2.3 percent after slipping 0.5 percent in May. Imports actually dipped 0.8 percent, following a 2.9 percent jump the prior month.
 The jump in the trade deficit was led by the nonpetroleum goods gap which widened to $36.9 billion from $33.7 billion in May. As expected, the petroleum goods gap narrowed to $29.6 billion from $33.7 billion in May. The services surplus nudged down to $14.5 billion in June from $14.6 billion the month before. The jump in the trade deficit was led by the nonpetroleum goods gap which widened to $36.9 billion from $33.7 billion in May. As expected, the petroleum goods gap narrowed to $29.6 billion from $33.7 billion in May. The services surplus nudged down to $14.5 billion in June from $14.6 billion the month before.
Looking at end use categories for goods, exports fell 3.2 percent while imports declined 1.0 percent in the latest month. The decrease in exports was led by a fall in industrial supplies, with declines also seen in capital goods excluding autos and foods, feeds & beverages. Modest gains were seen in consumer goods and automotive.
The drop in imports by end use categories was led by a fall in industrial supplies (only partly crude oil). Modest slippage was seen in capital goods ex autos, autos, and consumer goods.
While the economy appears to be getting a boost from lower oil and commodity prices, the reversal in exports (hopefully temporary) is an offset.
 If you worry about recession, one of the pressure points you check is inventories. And based on the latest numbers, the U.S. economy is not at risk for overstocking to weigh on production. The nation's businesses are managing their inventories well, paring accumulation back slightly in reaction to slightly lower growth in sales. Business inventories rose 0.3 in June against a 0.4 percent rise in business sales to keep the stock-to-sales ratio unchanged at relatively low 1.28. If you worry about recession, one of the pressure points you check is inventories. And based on the latest numbers, the U.S. economy is not at risk for overstocking to weigh on production. The nation's businesses are managing their inventories well, paring accumulation back slightly in reaction to slightly lower growth in sales. Business inventories rose 0.3 in June against a 0.4 percent rise in business sales to keep the stock-to-sales ratio unchanged at relatively low 1.28.
The retail sales component showed a 0.2 percent rise in June versus a 0.3 percent rise in sales. Other components in inventories included a 0.2 percent monthly rise in inventories at the manufacturing level and a 0.6 percent rise in inventories at the wholesale level, both of which are exactly in line with sales growth. The somewhat higher boost at the wholesale level likely is tied to auto imports. Businesses are showing caution in inventory accumulation at all levels.
 The Federal Reserve left its policy interest rate range at zero to 0.25 percent as expected. However, the FOMC took an unprecedented step and explicitly stated that economic conditions are likely to warrant exceptionally low target rate would be at least until mid-2013 to promote the ongoing economic recovery. Previously, the statement was vague, merely stating low rates will continue for an “extended period.” The Federal Reserve left its policy interest rate range at zero to 0.25 percent as expected. However, the FOMC took an unprecedented step and explicitly stated that economic conditions are likely to warrant exceptionally low target rate would be at least until mid-2013 to promote the ongoing economic recovery. Previously, the statement was vague, merely stating low rates will continue for an “extended period.”
The timing insertion was not unanimous. Voting against the action were regional Fed bank presidents Richard W. Fisher (Dallas), Narayana Kocherlakota (Minneapolis) and Charles I. Plosser (Philadelphia) who would have preferred to continue to describe economic conditions as likely to warrant exceptionally low levels for the federal funds rate for an extended period.
 While there is no QE3 for now (the door is open), the FOMC also said that it will maintain its existing policy of reinvesting principal payments from its securities holdings and would regularly review the size and composition of its securities holdings. It is prepared to adjust those holdings as appropriate. These comments mean the Fed still has the option to increase the balance sheet (or shrink it) and could reconsider making purchases other than Treasuries (such as mortgage-backed securities). While there is no QE3 for now (the door is open), the FOMC also said that it will maintain its existing policy of reinvesting principal payments from its securities holdings and would regularly review the size and composition of its securities holdings. It is prepared to adjust those holdings as appropriate. These comments mean the Fed still has the option to increase the balance sheet (or shrink it) and could reconsider making purchases other than Treasuries (such as mortgage-backed securities).
 The Fed downgraded its view of the economy noting that "economic growth so far this year has been considerably slower than the Committee had expected" which is even less positive than the prior statement's "the economic recovery is continuing at a moderate pace, though somewhat more slowly than the Committee had expected." Despite improvement in the latest employment report, the Fed still characterizes the labor market as worse than information available at the June FOMC. The Fed sees consumer spending as less robust and now attributes temporary factors slowing growth as only partially explaining the deceleration. The transitory factors were given greater weight in the prior statement. The Fed downgraded its view of the economy noting that "economic growth so far this year has been considerably slower than the Committee had expected" which is even less positive than the prior statement's "the economic recovery is continuing at a moderate pace, though somewhat more slowly than the Committee had expected." Despite improvement in the latest employment report, the Fed still characterizes the labor market as worse than information available at the June FOMC. The Fed sees consumer spending as less robust and now attributes temporary factors slowing growth as only partially explaining the deceleration. The transitory factors were given greater weight in the prior statement.
In response to the Fed’s latest statement, traders quickly lowered fed funds futures to reflect an implied rate of about 0.1 percent through early 2013.
Despite the downgrade to U.S. government credit, political wrangling in Washington, and violent swings in equities, the economy is still plodding along, albeit not as strong as hoped. Low interest rates will continue to support corporate earnings, help consumers pay down debt faster, and keep the cost of carry for inventories low for small and big businesses. And the low rate of return on Treasuries will make risk taking more attractive. If consumers are not truly sidelined by recent events, then the economy will continue to move forward.
Manufacturing, Housing and inflation share this week's spotlight. Empire States stars on Monday while industrial production will be in focus Tuesday. The Philly Fed follows on Thursday. Housing starts (Wednesday) and existing home sales (Thursday) will be closely monitored. The PPI and CPI will share the headlines with the housing data on Wednesday and Thursday. Given growth concerns, leading indicators may get more than usual attention on Thursday.
The Empire State manufacturing index came in at minus 3.76 in July, a sub-zero reading indicating month-to-month contraction (albeit slight) in business conditions but still an improvement from minus 7.79 in June to indicate a slightly less severe rate of contraction. Shipments were a clear positive, showing monthly expansion at plus 2.22, compared to June's minus 8.02. Employment, at plus 1.11, also expanded though at a slower rate than June's 10.20. Other readings were more downbeat including a minus 5.45 for new orders, the second negative reading in a row, and a minus 12.22 reading for unfilled orders that suggests manufacturers in the region are aggressively working down their backlog.
Empire State Manufacturing Survey Consensus Forecast for August 11: 1.0
Range: -10.0 to 8.5
Housing starts jumped 14.6 percent in June, following no change in May. June’s annualized pace of 0.629 million units is up 16.7 percent on a year-ago basis. The boost in June was led by a 30.4 percent surge in the multifamily component, following a 2.2 percent dip in May. The single-family component rose 9.4 percent after gaining 0.7 percent the prior month. Nonetheless, starts remain at very weak levels.
Housing starts Consensus Forecast for July 11: 0.600 million-unit rate
Range: 0.574 million to 0.635 million-unit rate
Housing permits Consensus Forecast for July 11: 0.606 million-unit rate
Range: 0.602 million to 0.655 million-unit rate
Import prices in June import fell 0.5 percent overall and, importantly, also fell excluding petroleum products, down 0.2 percent. Declines were broad through nearly all input components with output components, including capital goods and consumer goods, showing moderating pressure from already incremental rates. Yet the monthly decline didn't hold down the year-on-year increase which at 13.6 percent is the largest since August 2008. The export side showed a mild 0.1 percent increase though here too the year-on-year rate remains extremely elevated, at 9.9 percent.
Import prices Consensus Forecast for July 11: -0.1 percent
Range: -0.8 to +0.5 percent
Industrial production in June rebounded 0.9 percent after dropping 2.0 percent in May. Overall industrial production in June advanced a modest 0.2 percent, following a 0.1 percent dip in May. Manufacturing, however, was soft with no change after a 0.1 percent increase the month before. The auto component, depressed by Japanese-related supply shortages, fell 2.0 percent in June, following a 0.3 percent decrease the month before. Excluding motor vehicles, manufacturing rose 0.2 percent, following a 0.1 percent uptick in May. Mining output, the report's third component, grew 0.5 percent after May's 0.7 percent increase. Overall capacity utilization in June held steady at 76.7 percent. Looking ahead, a 0.3 percent boost in production worker hours (from the employment report) suggests a moderately healthy gain in July for the manufacturing component of industrial production.
Industrial production Consensus Forecast for July 11: +0.5 percent
Range: +0.2 to +1.0 percent
Capacity utilization Consensus Forecast for July 11: 77.0 percent
Range: 76.7 to 77.5 percent
The producer price index in June turned negative with prices dropping 0.4 percent, following a relatively soft rise of 0.2 percent in May. By major components, energy fell a sizeable 2.8 percent after rising 1.5 percent in May. Gasoline dropped 4.7 percent after rising 2.7 percent the prior month. Food costs rebounded 0.6, following a 1.4 percent dip the prior month. At the core level, PPI inflation bumped up to 0.3 percent from 0.2 percent in May. Almost half of the June rise can be traced to prices for light motor trucks, which increased 1.6 percent, following a 0.6 percent decline. Prices for this subcomponent likely were supported by shortages of models dependent on parts from Japan.
PPI Consensus Forecast for July 11: 0.0 percent
Range: -0.6 to +0.6 percent
PPI ex food & energy Consensus Forecast for July 11: +0.2 percent
Range: +0.1 to +0.3 percent
The consumer price index in June dipped 0.2 percent, following a 0.2 percent increase the month before. With lower energy costs pulling down the CPI, this was the first negative number in 12 months. Excluding food and energy, the CPI rose 0.3 percent, equaling the May rate.
Turning to major components, energy dropped 4.4 percent, following a 1.0 percent decline. Gasoline fell 6.8 percent after decreasing 2.0 percent in May. Food price inflation slowed with a 0.2 percent gain after a 0.4 percent surge the month before. Within the core new vehicles increased 0.6 percent, used cars and trucks jumped 1.6 percent, and apparel increased 1.4 percent in June. And owners’ equivalent rent is no longer as soft as in recent months, rising 0.2 percent.
CPI Consensus Forecast for July 11: +0.2 percent
Range: -0.2 to +0.5 percent
CPI ex food & energy Consensus Forecast for July 11: +0.2 percent
Range: +0.1 to +0.2 percent
Initial jobless claims for the August 6 week for the first time since early April dipped to under 400,000 with a weekly 7,000 decline to reach 395,000. The four-week average posted at 405,000, down 3,250 in the week and is the lowest since mid-April. Continuing claims also showed improvement, down 60,000 in data for the July 30 week to 3.688 million.
Jobless Claims Consensus Forecast for 8/13/11: 400,000
Range: 391,000 to 420,000
Existing home sales failed to pick up in June, slipping 0.8 percent to an annual adjusted rate of 4.770 million and following May’s 3.8 percent decline. More homes are coming on the market, at an unadjusted 508,000 for an 11 percent gain from May. Certainly, some of the increased supply is seasonal but months’ supply is now back up to 9.5 months at the current sales rate versus 9.1 months in May. This is still lower than the recent high of 12.5 months in July 2010. Price readings were positive but come with a couple of caveats. The median price jumped a monthly 8.9 percent to $184,300 with the year-on-year rate moving into positive ground for the first time this year at plus 0.8 percent. Prices in this report are not seasonally adjusted and spring and summer are when prices are seasonally stronger. Additionally, prices are not a repeat transactions measure (same house price changes) and shifts in composition of sales (high end versus low end) affect the median prices.
Existing home sales Consensus Forecast for July 11: 4.92 million-unit rate
Range: 4.32 to 5.04 million-unit rate
The general business conditions index of the Philadelphia Fed's Business Outlook Survey improved to 3.2 for July, only a bit above break-even zero to indicate very slight growth compared to June. But this was better than June's reading of minus 7.7 and was in line with the soft reading in May of 3.9. Basically, overall conditions are improving marginally after a dip in June. But forward momentum is flat instead of gaining strength. New orders posted at 0.1, compared to June's depressed level of minus 7.6 that indicated contraction. Backlogs, at minus 16.3 for a second month, show significant contraction. Nonetheless, plant managers appear to be a little optimistic about improving conditions as hiring picked up a bit this month.
Philadelphia Fed survey Consensus Forecast for August 11: 4.0
Range: -10.0 to 9.0
The Conference Board's index of leading indicators rose 0.3 percent in June on top of May's outsized gain of 0.8 percent. The top factor for June was an increase in money supply with the second factor once again the yield spread between long rates and short rates with the latter being kept near zero by the Federal Reserve. Building permits were a slight plus as is a slowing in vendor performance, a slowing that points to activity in the supply chain. The negative side was led by consumer expectations which have slid back toward recovery lows. The stock market is also a negative for June as is the factory workweek. The composite index of coincident indicators confirms current softness in growth, edging up only 0.1 percent—the same rate as in May.
Leading indicators Consensus Forecast for July 11: +0.2 percent
Range: -0.2 to +0.6 percent
R. Mark Rogers is the author of The Complete Idiot’s Guide to Economic Indicators, Penguin Books, 2009.
Econoday Senior Writer Mark Pender contributed to this article.
|
