|
Market anxiety was heightened sharply this past week and outweighed a moderately positive jobs report, leaving equities down the most since the worst of the financial crisis.
 Equities dropped sharply this past week on concern about a global economic slowdown and even a possible recession according to some pundits. The week started off little changed after news from President Barack Obama of a bi-partisan deal to increase the US debt limit was offset by a weaker-than-expected ISM manufacturing report. Equities dropped sharply this past week on concern about a global economic slowdown and even a possible recession according to some pundits. The week started off little changed after news from President Barack Obama of a bi-partisan deal to increase the US debt limit was offset by a weaker-than-expected ISM manufacturing report.
Tuesday saw equities drop notably as personal spending was softer than forecast and investors shrugged off news of the approval of the debt limit agreement in Washington.
Following passage of the Budget Control Act of 2011 by the House of Representatives Monday night, the Senate on Tuesday passed this legislation by a vote of 74 to 26. This bill will raise the debt ceiling by between US$2.1 trillion and US$2.4 trillion and is expected to cover Treasury's borrowing needs until 2013. However, the specifics of budget cuts are yet to be made. The bill sets up a 12-member bipartisan committee to propose the specifics and the proposals must be passed by December 23, 2011.
Despite the enactment of a higher debt ceiling, traders continued to worry about a downgrade in the U.S. credit rating. Reports of strong gains in auto sales were ignored by the markets (especially since the numbers trickled in over the day).
At mid-week, a better-than-expected ADP private employment report initially lifted stocks but a sluggish ISM non-manufacturing report tugged equities down. Stocks rebounded after the Wall Street Journal said three former top officials at the Fed believe the central bank may consider a new round of securities purchases to bolster growth, leaving equities in positive territory for the day.
Equities plummeted Thursday despite a dip in initial jobless claims. Stocks in the U.S. and globally fell sharply Thursday on intensifying investor fears about a slowdown in economic growth and heightened worries about Europe’s ongoing debt crisis. Concern now is centered on Italy and Spain. The fears are that these governments will default and negatively impact the balance sheets of European banks and others holding their debt.
The week ended on an incredibly volatile note. Stocks initially rose on an upside surprise on July payroll employment but fell on continued worries over sovereign debt of Italy and Spain. Stocks whipsawed throughout the day, ending mixed. The Dow had a massive trading range of 416 points for the day.
Equities were down sharply this past week. The Dow was down 5.8 percent; the S&P 500, down 7.2 percent; the Nasdaq, down 8.1 percent; and the Russell 2000, down 10.3 percent.
For the year-to-date, major indexes are down as follows: the Dow, down 1.1 percent; the S&P 500, down 4.6 percent; the Nasdaq, down 4.5 percent; and the Russell 2000, down 8.8 percent.
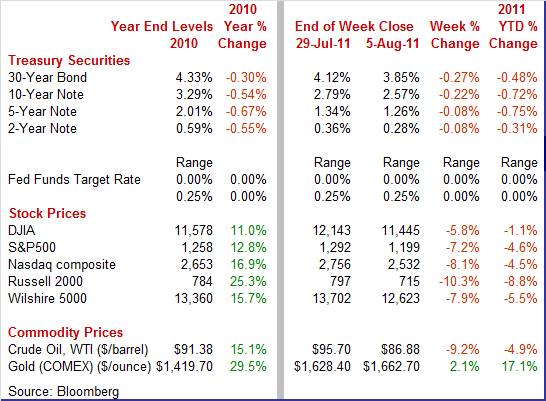
Weekly percent change column reflects percent changes for all components except interest rates. Interest rate changes are reflected in simple differences.
 Yes, it is a paradox. There is increased worry about a downgrade to the U.S. government’s credit rating (due to a pending possible conclusion by a rating company that the just enacted deficit reduction legislation is not strong enough) but traders and investors flocked to Treasuries as a safe haven this week. Slowing economic growth in Europe and worries about possible default in Italy and Spain made the U.S. currency look good. Yes, it is a paradox. There is increased worry about a downgrade to the U.S. government’s credit rating (due to a pending possible conclusion by a rating company that the just enacted deficit reduction legislation is not strong enough) but traders and investors flocked to Treasuries as a safe haven this week. Slowing economic growth in Europe and worries about possible default in Italy and Spain made the U.S. currency look good.
 Economic news was mostly interpreted to be weak even though data actually were more on the positive side than negative. The prior Friday’s disappointing GDP report basically set the tone at open for the week. ISM manufacturing on Monday and personal income on Tuesday were seen as soft while Tuesday’s jump in motor vehicles sales was ignored. A moderately good increase in ADP employment slowed the decline in rates at midweek. The big drop in yields was on Thursday as funds flowed sharply from equities into the safety of Treasuries on the rout in stocks. The positive employment report at week’s end bumped rates back up but yields were down dramatically for the week as a whole. Economic news was mostly interpreted to be weak even though data actually were more on the positive side than negative. The prior Friday’s disappointing GDP report basically set the tone at open for the week. ISM manufacturing on Monday and personal income on Tuesday were seen as soft while Tuesday’s jump in motor vehicles sales was ignored. A moderately good increase in ADP employment slowed the decline in rates at midweek. The big drop in yields was on Thursday as funds flowed sharply from equities into the safety of Treasuries on the rout in stocks. The positive employment report at week’s end bumped rates back up but yields were down dramatically for the week as a whole.
For this past week Treasury rates were down as follows: 3-month T-bill, down 9 basis points; the 2-year note, down 8 basis points; the 5-year note, down 8 basis points; the 7-year note, down 17 basis points; the 10-year note, down 22 basis points; and the 30-year bond, down 27 basis points.
 The spot price of oil dropped heavily this past week on the view that economic growth is slowing globally. The spot price of West Texas Intermediate fell in each of the first four days of trading, culminating in a more than $5 fall in crude on Thursday as crude plunged in tandem with equities. Crude nudged up a fraction of a dollar on Friday. The spot price of oil dropped heavily this past week on the view that economic growth is slowing globally. The spot price of West Texas Intermediate fell in each of the first four days of trading, culminating in a more than $5 fall in crude on Thursday as crude plunged in tandem with equities. Crude nudged up a fraction of a dollar on Friday.
Net for the week, spot prices for West Texas Intermediate dropped a whopping $8.82 per barrel to settle at $86.88. This is the lowest close since mid-February of this year.
Based on the week’s plunge in equities, you would think that economic news was abysmal. In fact, news was more upside than downside. While employment beat expectations, the most overlooked indicators of the week were motor vehicle sales and consumer credit which posted strong gains.
 The consumer sector is not as weak as feared. Employment growth has picked up but remains soft. Payroll jobs in July advanced 117,000, following a revised 46,000 rise in June, and a revised 53,000 increase in May. Private sector growth was somewhat healthier as private nonfarm payrolls grew 154,000 in July, following an 80,000 rise in June and 99,000 increase in May. The consumer sector is not as weak as feared. Employment growth has picked up but remains soft. Payroll jobs in July advanced 117,000, following a revised 46,000 rise in June, and a revised 53,000 increase in May. Private sector growth was somewhat healthier as private nonfarm payrolls grew 154,000 in July, following an 80,000 rise in June and 99,000 increase in May.
In the private sector, improvement was seen in both goods-producing and services-providing sectors. Goods-producing jobs gained 42,000, following a 16,000 rise in June. Manufacturing jobs increased 24,000 after an 11,000 rise the month before. For June, auto industry jobs gained 12,000. Construction employment rebounded 8,000 after decreasing 5,000. Mining advanced 9,000, following a 10,000 boost in June.
Within private services-providing industries, gains were led by health care and retail trade. Health was up 31,000 in July while retail trade gained 26,000. Also, professional & technical services advanced 18,000.
The public sector weighed on overall employment but a special factor affected the latest data. Government employment dropped 37,000, following a 34,000 decrease in June. Employment in state government decreased by 23,000, almost entirely due to a partial shutdown of the Minnesota state government. Local government jobs fell 16,000 with 12,200 in education.
 A rebound in the auto sector appears to be helping earnings. Wage growth picked up as average hourly earnings increased 0.4 percent, following no change in June. The average workweek for all workers in July was unchanged at 34.3 hours and matched the market consensus. A rebound in the auto sector appears to be helping earnings. Wage growth picked up as average hourly earnings increased 0.4 percent, following no change in June. The average workweek for all workers in July was unchanged at 34.3 hours and matched the market consensus.
On a year-ago basis, overall payroll jobs in July improved to a 1.0 percent gain from 0.8 percent the month before.
From the household survey, the unemployment rate slipped to 9.1 percent from 9.2 percent in June. The July figure came in below expectations for 9.2 percent. The July dip was primarily due to a contraction in the labor force.
Looking ahead, a 0.6 percent jump in aggregate weekly earnings suggests a strong gain in the private wages & salaries component of personal income. A 0.3 percent rise in production worker hours in manufacturing points to a moderately healthy rise in the manufacturing component of industrial production for July.
The latest employment situation report should relieve fears that the economy is headed back into recession. Growth is still modest but positive. And maybe the phrase “transitory” will again be seen applying to first half weakness.
 The data are a little dated at this point but consumer income and spending were sluggish in June. Strong hints were given earlier in earnings numbers, motor vehicle sales, and retail sales. Personal income in June edged up a modest 0.1 percent, easing from a 0.2 percent rise in May. Wages & salaries were unchanged, following a gain of 0.2 percent the prior month. The data are a little dated at this point but consumer income and spending were sluggish in June. Strong hints were given earlier in earnings numbers, motor vehicle sales, and retail sales. Personal income in June edged up a modest 0.1 percent, easing from a 0.2 percent rise in May. Wages & salaries were unchanged, following a gain of 0.2 percent the prior month.
 Consumer spending turned down in June, weighed down by modest job growth, a decline in a decline in motor vehicle sales, and a decrease in gasoline prices. Consumer spending declined 0.2 percent after posting a 0.1 percent uptick in May. By components, durables dropped 0.4 percent after falling 1.3 percent in May. This was partly due to shortages of vehicles dependent upon auto parts from Japan. Nondurables dropped 0.6 percent, following a 0.3 percent dip the month before. Lower gasoline prices played a role here. Services were flat, following a 0.4 percent jump in May. Discounting inflation, overall PCEs were unchanged in June, following a 0.1 percent slip in May. Consumer spending turned down in June, weighed down by modest job growth, a decline in a decline in motor vehicle sales, and a decrease in gasoline prices. Consumer spending declined 0.2 percent after posting a 0.1 percent uptick in May. By components, durables dropped 0.4 percent after falling 1.3 percent in May. This was partly due to shortages of vehicles dependent upon auto parts from Japan. Nondurables dropped 0.6 percent, following a 0.3 percent dip the month before. Lower gasoline prices played a role here. Services were flat, following a 0.4 percent jump in May. Discounting inflation, overall PCEs were unchanged in June, following a 0.1 percent slip in May.
On a more favorable note, real disposable personal income increased 0.3 percent in June, compared to no change in May as inflation was negative and taxes dipped in the latest month.
 On the inflation front, the headline PCE price index declined 0.2 percent on lower energy costs, after increasing 0.2 percent the month before. The core rate rose but eased to 0.1 percent from 0.2 percent in May. On the inflation front, the headline PCE price index declined 0.2 percent on lower energy costs, after increasing 0.2 percent the month before. The core rate rose but eased to 0.1 percent from 0.2 percent in May.
Year-on-year, headline prices are up 2.6 percent—the same as in May. The core is up 1.3 percent on a year-ago basis, matching May’s pace. The Fed will like the relatively strong core rate—hinting that quantitative easing has reduced deflation risks—but will be hoping that softer energy costs will pull down the headline number.
The latest personal income report does not paint a rosy picture for the consumer sector. But it is not as bad as the headline numbers given the gain in real disposable income. Also, there has been improvement in employment and earnings and the dip in auto sales does appear to have been transitory given the July gain in motor vehicle sales.
 The economy may actually be getting some lift from the auto sector as improved sales suggest pending increases in production. Sales of unit new motor vehicles showed a big monthly gain in July, up 5.8 percent from June to a 12.2 million annual rate. The gain points to relief for the motor vehicle component of the retail sales report which has been weak in the aftermath of the March earthquake and tsunami that disrupted the Japanese supply chain. More importantly, the numbers point to a consumer that is still willing to spend and to likely increases in motor vehicle assemblies. Based on these data alone, look for a strengthening in third quarter GDP and in personal consumption. The economy may actually be getting some lift from the auto sector as improved sales suggest pending increases in production. Sales of unit new motor vehicles showed a big monthly gain in July, up 5.8 percent from June to a 12.2 million annual rate. The gain points to relief for the motor vehicle component of the retail sales report which has been weak in the aftermath of the March earthquake and tsunami that disrupted the Japanese supply chain. More importantly, the numbers point to a consumer that is still willing to spend and to likely increases in motor vehicle assemblies. Based on these data alone, look for a strengthening in third quarter GDP and in personal consumption.
 Despite all of the reports of a gloomy mood in the consumer sector, consumers are confident enough to start pulling out the plastic. Consumer credit outstanding in June surged $15.5 billion, following a $5.1 billion rise the month before. The latest jump was the largest gain in more than four years. The gain was led by a $10.3 billion surge for non-revolving credit, reflecting June's rebound in motor vehicle sales. But the best news was revolving credit which rose $5.2 billion for a second straight solid gain that hints at consumer confidence to take on new debt. Despite all of the reports of a gloomy mood in the consumer sector, consumers are confident enough to start pulling out the plastic. Consumer credit outstanding in June surged $15.5 billion, following a $5.1 billion rise the month before. The latest jump was the largest gain in more than four years. The gain was led by a $10.3 billion surge for non-revolving credit, reflecting June's rebound in motor vehicle sales. But the best news was revolving credit which rose $5.2 billion for a second straight solid gain that hints at consumer confidence to take on new debt.
 Manufacturing has been the engine of recovery but now there are questions of whether that is continuing. The Institute For Supply Management's manufacturing index for July eased to a disappointing 50.9 reading from a moderately healthy 55.3 figure for June. Although the July index is still above 50 to indicate monthly expansion in business conditions, it indicates only very marginal growth and is now at the slowest rate so far of the recovery. Manufacturing has been the engine of recovery but now there are questions of whether that is continuing. The Institute For Supply Management's manufacturing index for July eased to a disappointing 50.9 reading from a moderately healthy 55.3 figure for June. Although the July index is still above 50 to indicate monthly expansion in business conditions, it indicates only very marginal growth and is now at the slowest rate so far of the recovery.
Forward momentum has stalled. New orders technically contracted in the month, coming in below breakeven at 49.3. However, new orders are volatile and this is the first sub-50 reading since June 2009. Backlog orders contracted more deeply, down four points to 45.0 for the lowest reading since April 2009.
Factory managers are still hopeful about output growth as the employment index posted in positive territory 53.5 (indicating workforce gain). But optimism is less confident as the employment index was notably lower than the 59.9 reading in June. This is the lowest level for employment since December 2009. Input price inflation eased whic, though boosting margins, is another sign of economic sluggishness.
Overall, manufacturing has softened but is still growing. The problem is that the economy needs this engine of growth.
 The latest ISM non-manufacturing was almost unchanged in July, maintaining a slow growth pace. The ISM non-manufacturing composite index for July edged down 0.6 points to a 52.7 level. Unfortunately weakness was led by the new orders index, falling nearly 1.9 points to 51.7 and barely staying above the breakeven level of 50. This index was in the 60s as recently as March. Backlog orders shrank at a faster pace, down 4-1/2 points in the month to 44.0. Also slowing was the survey’s employment index at 52.5 versus 54.1 in June. The latest ISM non-manufacturing was almost unchanged in July, maintaining a slow growth pace. The ISM non-manufacturing composite index for July edged down 0.6 points to a 52.7 level. Unfortunately weakness was led by the new orders index, falling nearly 1.9 points to 51.7 and barely staying above the breakeven level of 50. This index was in the 60s as recently as March. Backlog orders shrank at a faster pace, down 4-1/2 points in the month to 44.0. Also slowing was the survey’s employment index at 52.5 versus 54.1 in June.
On the upside, business activity, a component that is akin to a production index on the manufacturing side, rose more than 2-1/2 points to 56.1.
The latest ISM non-manufacturing report suggests a slowing in economic growth. However, the mild acceleration in BLS payroll employment indicates otherwise.
 A little noticed surprise this week was another gain in construction spending. Construction outlays in June advanced 0.2 percent, following a revised 0.3 percent gain in May (originally a 0.6 percent decrease). A little noticed surprise this week was another gain in construction spending. Construction outlays in June advanced 0.2 percent, following a revised 0.3 percent gain in May (originally a 0.6 percent decrease).
The boost was led by private nonresidential outlays with public spending also up. Private nonresidental spending rose 1.8 percent, following a 1.2 percent boost in May.
But weakness continues with the usual suspects. Public construction was down 0.7 percent in June after a 0.4 percent rise the month before. Homebuilders held back on housing activity despite a 14.6 percent jump in starts in June. Private residential outlays slipped another 0.3 percent after falling 0.8 percent in May. In June weakness was led by a 0.9 percent downturn in the multifamily component with the one-family component down 0.8 percent.
Despite recent improvement, construction outlays are still soft. On a year-ago basis, overall construction outlays improved to minus 4.7 percent in June from down 5.0 percent in May.
Equities were pummeled by worries over the wrangling to resolve the U.S. debt ceiling, a possible downgrade in the U.S. credit rating, slower than expected economic growth, and sovereign debt problems in Europe. Perhaps equities were due for a correction to adjust to slower economic growth. But the actual economic news was more on the upside than downside. Even though the jobs report was welcome relief, the sleeper reports of the week were motor vehicles and consumer credit—both better than expected. They also indicate that the consumer sector may be in better shape and less glum than believed. Again, it is important to remember the consumer sector is a two track sector—those with a job and those without a job. At a minimum, one part of this two-track consumer sector is willing to spend. Those with jobs are no longer putting off new car purchases and feel secure enough to take on new debt. Of course, the jobless portion of the consumer sector is still restraining growth.
Fed watchers Tuesday afternoon will be looking to see how the FOMC responds to the turmoil in the financial markets and the weak string of economic data. Thursday brings the latest look at international trade and especially exports to see if the weak dollar is boosting sales abroad. Investors will be looking for a rebound in consumer spending Friday in the retail sales report after last month's dour results.
Nonfarm business productivity rose an annualized 1.8 percent in the first quarter, compared to the original estimate of 1.6 percent and after a 2.9 percent rise in the previous quarter. The growth in productivity reflected an output gain of 3.2 percent in the nonfarm business sector, up from the original estimate of 3.1 percent. Hours worked increased an annualized 1.4 percent, unrevised. Unit labor costs were revised down to a 0.7 percent increase from the first estimate of a 1.0 percent rise. Looking ahead the soft second quarter GDP number of 1.3 percent annualized suggests a weak productivity figure for the period. Also, the downward revision to first quarter GDP to 0.4 percent annualized points to a sharp downward revision in first quarter productivity.
Nonfarm Business Productivity Consensus Forecast for initial Q2 11: -0.7 percent annual rate
Range: -1.5 to +1.0 percent annual rate
Unit Labor Costs Consensus Forecast for initial Q2 11: +1.9 percent annual rate
Range: +0.9 to +3.5 percent annual rate
The FOMC announcement at 2:15 p.m. ET for the August 9 FOMC policy meeting is expected to leave the Fed funds target unchanged at a range of zero to 0.25 percent. Traders will focus on any changes in participants’ views on the economy, notably for the consumer sector and credit conditions. Also garnering attention will be discussion on future plans for unwinding or delaying unwinding of the Fed’s expanded balance sheet.
FOMC Consensus Forecast for 8/9/11 policy vote on fed funds target range: unchanged at a range of zero to 0.25 percent
The U.S. Treasury monthly budget report showed improvement in June with a deficit at $43.1 billion in versus $68.4 billion last June. The fiscal year-to-date deficit was $970.5 billion, about $30 billion less than June 2010. The latest monthly improvement reflected smaller estimates for education loan subsidies and less spending on Fannie Mae and Freddie Mac. Looking ahead, the month of July typically shows a sizeable deficit for the month. Over the past 10 years, the average deficit for the month of July has been $72.2 billion and $103.6 billion over the past 5 years. The July 2010 deficit came in at $165.0 billion.
The U.S. international trade gap in May ballooned to $50.2 billion from $43.6 billion in April. Exports slipped 0.5 percent after improving 1.4 percent in April. Imports jumped 2.6 percent after edging down 0.3 percent the month before. The widening in the trade deficit was led by the petroleum gap which expanded to $30.4 billion from $26.1 billion in April. The nonpetroleum goods shortfall worsened to $33.3 billion from $31.1 billion the prior month. The services surplus advanced to $14.7 billion from $14.5 billion in April.
International trade balance Consensus Forecast for June 11: -$48.0 billion
Range: -$49.5 billion to -$45.5 billion
Initial jobless claims were little changed in the July 30 week, right at the 400,000 level, compared to the prior week’s 401,000. The four-week average was down for the fifth straight week, 6,750 lower to a 407,750 level that is roughly 20,000 lower from a month-ago.
Continuing claims rose 10,000 for the July 23 week to 3.730 million. The four-week average, which is also at 3.730 million, was little changed from the month-ago comparison.
Jobless Claims Consensus Forecast for 8/6/11: 405,000
Range: 397,000 to 450,000
Retail sales in June edged up only 0.1 percent, following a 0.1 percent dip in May. Motor vehicle sales made a partial 0.8 percent rebound after dropping 1.8 percent in May. Both months’ sales were constrained by shortages of models dependent upon parts from Japan. Excluding autos, sales were flat, following a 0.2 percent gain in May. Here, components were mixed but softened largely by weak gasoline sales. Sales excluding autos and gasoline in June posted a modest 0.2 percent rise, matching the gain in May. Looking ahead, we may see a gain in July retail sales as chain store sales appear to have risen modestly in July; unit new motor vehicle sales jumped 5.8 percent, and the price of gasoline is up.
Retail sales Consensus Forecast for July 11: +0.6 percent
Range: +0.1 to +1.5 percent
Retail sales excluding motor vehicles Consensus Forecast for July 11: +0.3 percent
Range: -0.2 to +1.6 percent
The Reuter's/University of Michigan's consumer sentiment index posted a final July reading of 63.7, compared to 63.8 at mid-month and 71.5 for final June. The July readings were the weakest since first-quarter 2009 when the economy was in recession. Pessimism was centered in expectations where the component is at 56.0, up slightly from 55.8 at mid-month but down substantially from 64.8 from June. The current conditions component showed less severe erosion with the final July reading at 75.8 versus 76.3 at mid-month and 82.0 in final June.
Consumer sentiment Consensus Forecast for preliminary August 11: 63.0
Range: 60.5 to 65.0
Business inventories rose 1.0 percent in May in contrast to a 0.1 percent decline for sales, a mismatch that put the stock-to-sales ratio at 1.28 versus 1.27 in April and up notably from March's 1.25. More recently, factory inventories rose 0.2 percent in June.
Business inventories Consensus Forecast for June 11: +0.6 percent
Range: +0.3 to +0.9 percent
R. Mark Rogers is the author of The Complete Idiot’s Guide to Economic Indicators, Penguin Books, 2009.
Econoday Senior Writer Mark Pender contributed to this article.
|
